
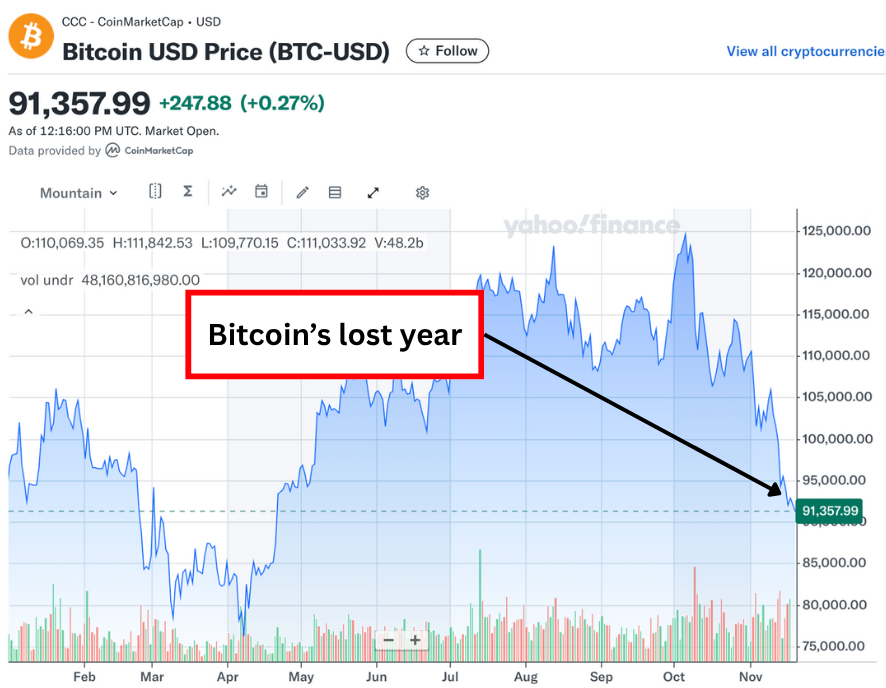
Bitcoin (BTC) can’t stop falling. After hitting an all-time high of $126,272 on Oct. 6, the cryptocurrency has lost over 27% of its value and currently trades at around $91,655. Every bit of progress Bitcoin made this year has been lost. It has slipped firmly into bear market territory after briefly surpassing the psychologically important $100,000 milestone, only to lose it again within weeks.
What’s Driving the Collapse?
This rapid reversal has multiple triggers. Large holders who accumulated during the spring and summer rally have been methodically taking profits, with on-chain data showing billions in BTC moved to exchanges since late October. Spot Bitcoin ETF inflows – which drove much of the year’s upside – have slowed to a trickle or even turned negative on heavy-volume days.
Broader macro headwinds are amplifying the pressure: the Federal Reserve and other major central banks have pushed back aggressive rate-cut expectations into 2026, draining liquidity from risk assets. Rising real yields on U.S. Treasuries and a resurgent dollar have made zero-yielding Bitcoin less attractive in the short term.
Retail enthusiasm – a hallmark of previous bull runs – is conspicuously absent. Google search volume for “Bitcoin” has fallen 65% from its May peak, and social-media mention volume sits at 2023 levels. Without fresh capital from smaller investors chasing FOMO, the market lacks the fuel to counter institutional distribution.
 How Low Can This Bear Market Go?
History offers a sobering guide. Since 2014, Bitcoin’s average bear market drawdown has been between 30% and 35% from cycle highs, with most corrections finding support in that zone. The 2018 and 2022 bears, however, saw peak-to-trough declines of 84% and 77% respectively when leverage, contagion, and macro shocks aligned. More relevant to today are the mid-cycle corrections of 2021 and 2022, which twice saw 45% to 54% drops before eventually recovering.
At a 27% loss, Bitcoin is approaching the depth of a typical correction but has not yet reached the zone that has historically marked interim bottoms in maturing cycles. Technical damage is mounting, too: the 50-day moving average has crossed below the 200-day – a classic death cross – weekly RSI is oversold for the first time since January, and the pi-cycle top indicator – once eerily accurate – flashed a sell signal weeks ago.
A Chilly Winter?
Yet this cycle is different. Institutional adoption is deeper than ever. Public companies and ETFs now hold over 1.1 million BTC, BlackRock (BLK) and Fidelity alone account for hundreds of thousands of coins, and Strategy (MSTR) continues to issue debt to buy more. These entities are far less likely to panic-sell than the leveraged retail cohorts of prior winters. Realized capitulation – when long-term holders finally throw in the towel – remains modest compared with 2022 lows.
Long-term tailwinds also remain intact, such as the growing federal deficit,, central banks quietly resuming balance-sheet expansion, and nation-state and corporate treasury adoption continuing behind the scenes.
For now, however, near-term price action is firmly in the bears’ control. A decisive break and weekly close below $80,000 to $82,000 (the 200-week moving average and prior cycle high) would likely confirm a multi-month downturn.
Bitcoin’s 2025 narrative has flipped from euphoria to survival-of-the-fittest in just six weeks. Seasoned traders know that bear markets are where fortunes are both lost and made – patience and capital preservation separate the winners from the wreckage.
— Rich Duprey
The company manufacturing Nvidia's AI servers trades under a secret name. AI revenue: $30B this year. Stock price: $8. Click for the hidden identity →
Source: Money Morning
