Picking a winning trade on a consistent basis is not simply a stroke of luck. It’s the result of calculated screening, planning, and deliberation.
With this in mind, we have started a new weekly series on our top 10 stocks to watch this week — stocks that look poised for a possible breakout in the coming days. Traders should add these stocks to their watchlist now.

The Top 10 Stocks to Watch This Week for Possible Breakouts
| Sl # | Name of the Stock | Stock Ticker | Last Close | Buy Level(s) | Reason |
| 1 | Novanta Inc. | NASDAQ: NOVT | $128.65 | $129.60 | Falling Wedge Pattern Breakout |
| 2 | Teekay Corporation Ltd | NYSE: TK | $9.10 | $9.30 | Symmetrical Triangle Pattern Breakout |
| 3 | Brunswick Corp | NYSE: BC | $71.91 | $73.20 | Uptrend Channel |
| 4 | International Business Machines Corp | NYSE: IBM | $307.46 | $310.00 | Ascending Triangle Pattern Breakout |
| 5 | Western Union Company | NYSE: WU | $8.97 | $9.05 | Downtrend Channel Breakout |
| 6 | Brookfield Corporation | NYSE: BN | $46.19 | $46.60 | Flag Pattern Breakout |
| 7 | World Kinect Corp | NYSE: WKC | $26.66 | $27.00 | Symmetrical Triangle Pattern Breakout |
| 8 | Grindr Inc. | NYSE: GRND | $15.06 | $16.20 | Falling Wedge Pattern Breakout |
| 9 | Axalta Coating Systems Ltd | NYSE: AXTA | $29.04 | $30.40 | Downtrend Channel |
| 10 | Digital Realty Trust Inc. | NYSE: DLR | $179.28 | $181.30 | Symmetrical Triangle Pattern Breakout |
Important: Typically, these trades offer a risk: reward ratio of 1:2 or 1:3 in the next 6 months, which implies 2x to 3x rewards when compared to risks. So, be sure to set your stop-loss levels and target prices accordingly to manage your risk. In addition, these trade ideas are triggered using daily closing prices, not intra-day pricing. So, if you participate in these trades, make sure that you only buy the stock once its daily close is above the recommended price level.
That said, here are the top 10 stocks to watch for a breakout, in no particular order.
#1 Novanta Inc. (NASDAQ: NOVT)
Sector: Technology • Scientific & Technical Instruments
Reason: Falling Wedge Pattern Breakout
A falling wedge pattern is formed by joining two downward-sloping, converging trendlines having a contracting range. The pattern appears to be wide at the top and continues to contract as prices fall. A breakout from a falling wedge pattern can indicate either reversal or continuation depending on where the pattern appeared in the trend.
A stock that has broken out of a falling wedge pattern would have gained momentum and would have the potential to move higher.
Buy Level(s): The stock has currently broken out of a falling wedge pattern. However, the ideal buy level for NOVT is above the nearest resistance level of $129.60. This is marked in the chart below as a green color dotted line.
Daily chart – NOVT
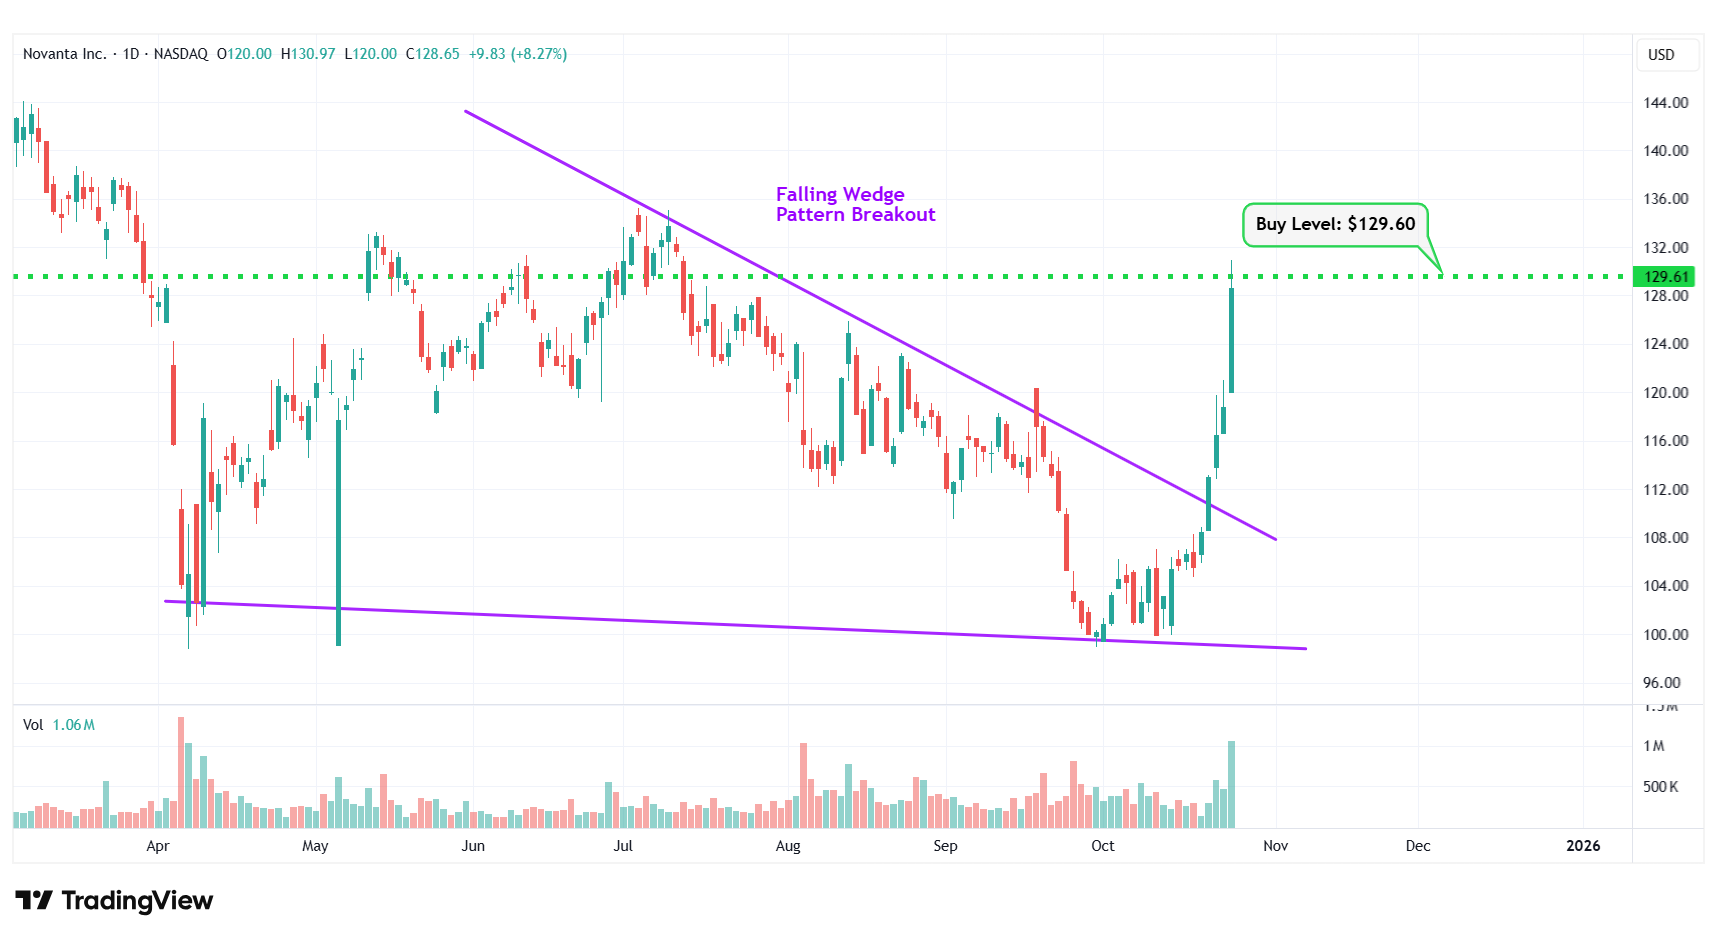
NOVT – Falling Wedge Pattern Breakout
#2 Teekay Corporation Ltd (NYSE: TK)
Sector: Energy • Oil & Gas Midstream
Reason: Symmetrical Triangle Pattern Breakout
A symmetrical triangle is a chart pattern formed by two converging trend lines connecting a series of sequential peaks and troughs. These two lines result in the formation of a triangle that appears to be symmetrical.
A symmetrical triangle pattern is usually formed when there is indecision in the price movements and there is uncertainty among the buyers and sellers. This chart pattern represents a period of consolidation before the price breaks out or breaks down. In case a breakout occurs from the upper trend line, it is a strong bullish indication as it signifies the start of a new bullish trend.
Buy Level(s): The stock has currently broken out of a symmetrical triangle pattern. However, the ideal buy level for TK is if the stock closes above the immediate resistance level of $9.30. This is marked in the chart below as a green color dotted line.
Daily chart – TK
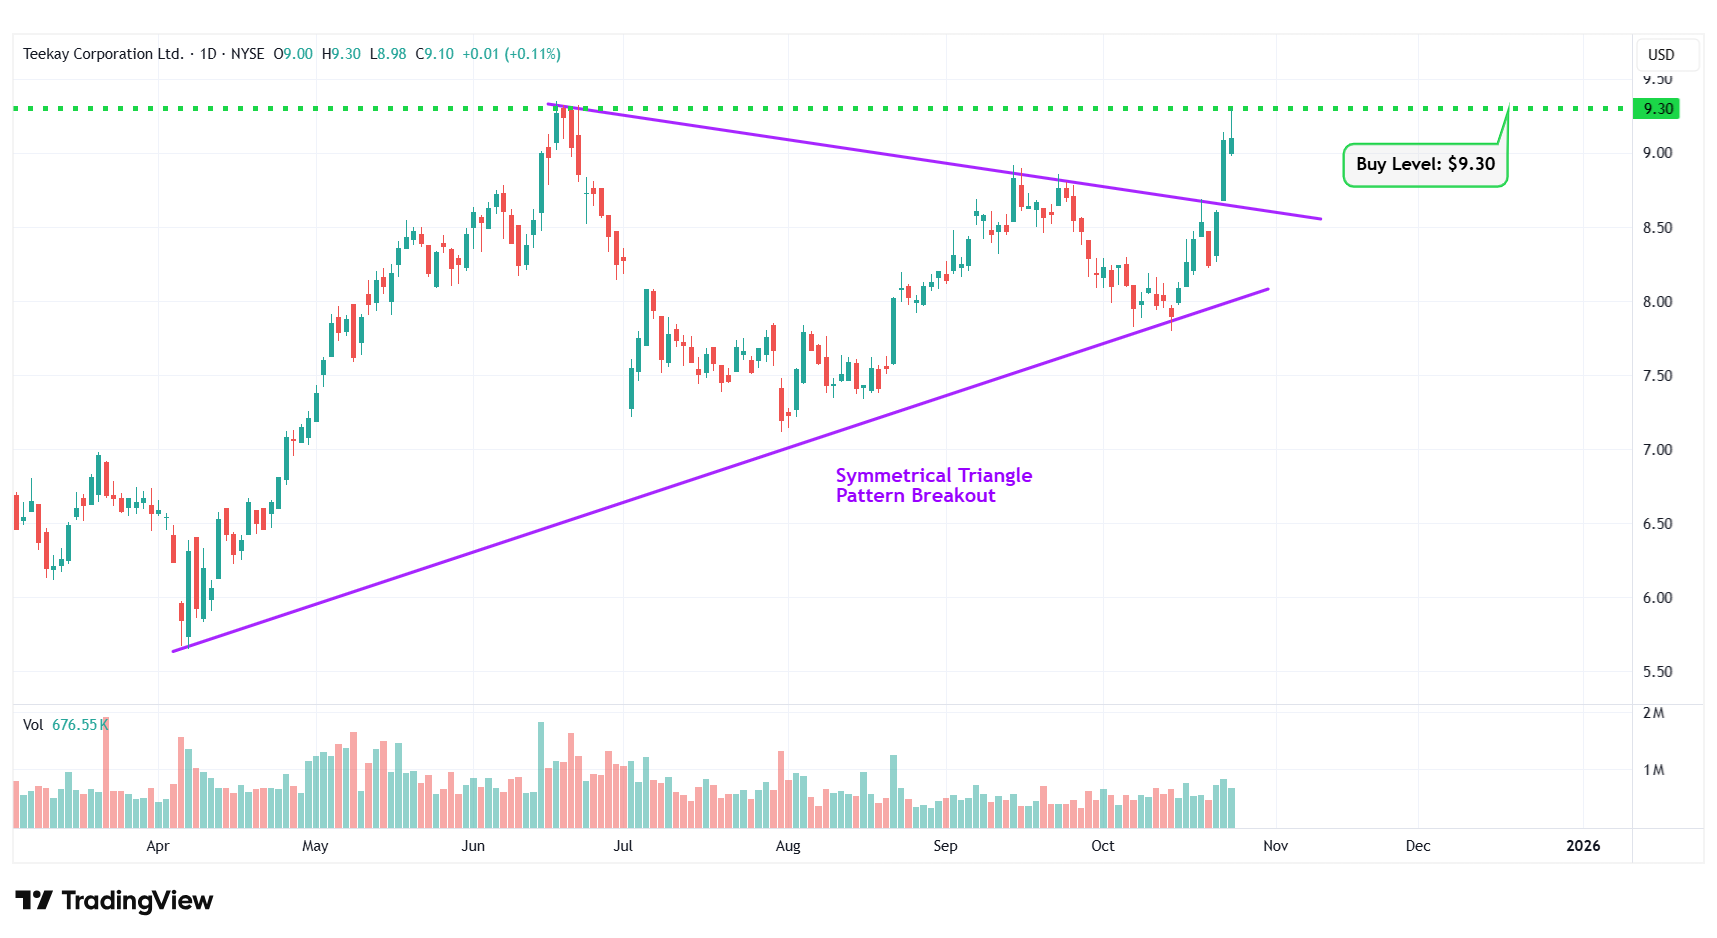
TK – Symmetrical Triangle Pattern Breakout
#3 Brunswick Corp (NYSE: BC)
Sector: Consumer Cyclical • Recreational Vehicles
Reason: Formation of an Uptrend Channel
An uptrend channel or an ascending channel is the price action contained between upward sloping parallel lines. It is formed by a lower trend line that connects the swing lows, and an upper channel line that joins the swing highs. A stock usually trades between the two rails of the uptrend channel before finally breaking out from the upper rail.
Buy Level(s): The ideal buy level for BC is if the stock breaks out of the uptrend channel and has a daily close above $73.20. This is marked in the chart below as a green color dotted line.
Daily chart – BC
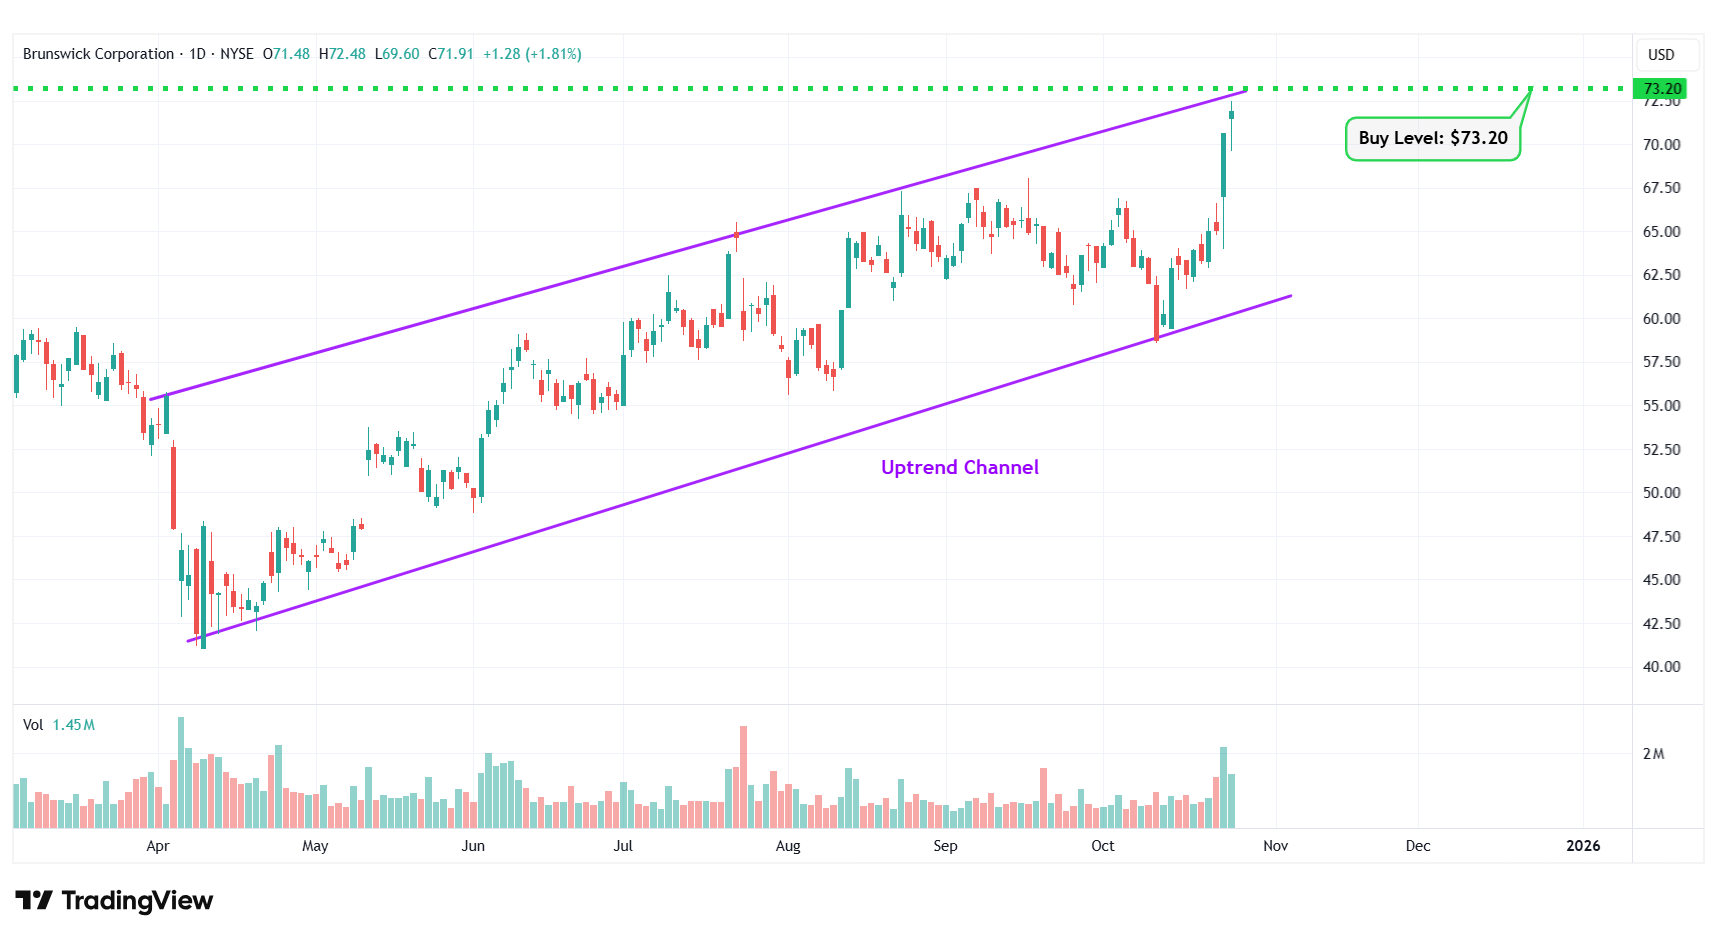
BC – Uptrend Channel
#4 International Business Machines Corp (NYSE: IBM)
Sector: Technology • Information Technology Services
Reason: Breakout From an Ascending Triangle Pattern
An ascending triangle pattern is a bullish pattern formed by drawing a horizontal line along the swing highs, and a rising trendline along the swing lows. These two lines result in the formation of a triangle. A breakout from this pattern is typically a strong bullish indication.
Buy Level(s): Although the stock has broken out of the ascending triangle pattern, the ideal buy level for IBM is if the stock has a daily close above the near-term resistance level of $310.00. This is marked in the chart below as a green color dotted line.
Daily chart – IBM
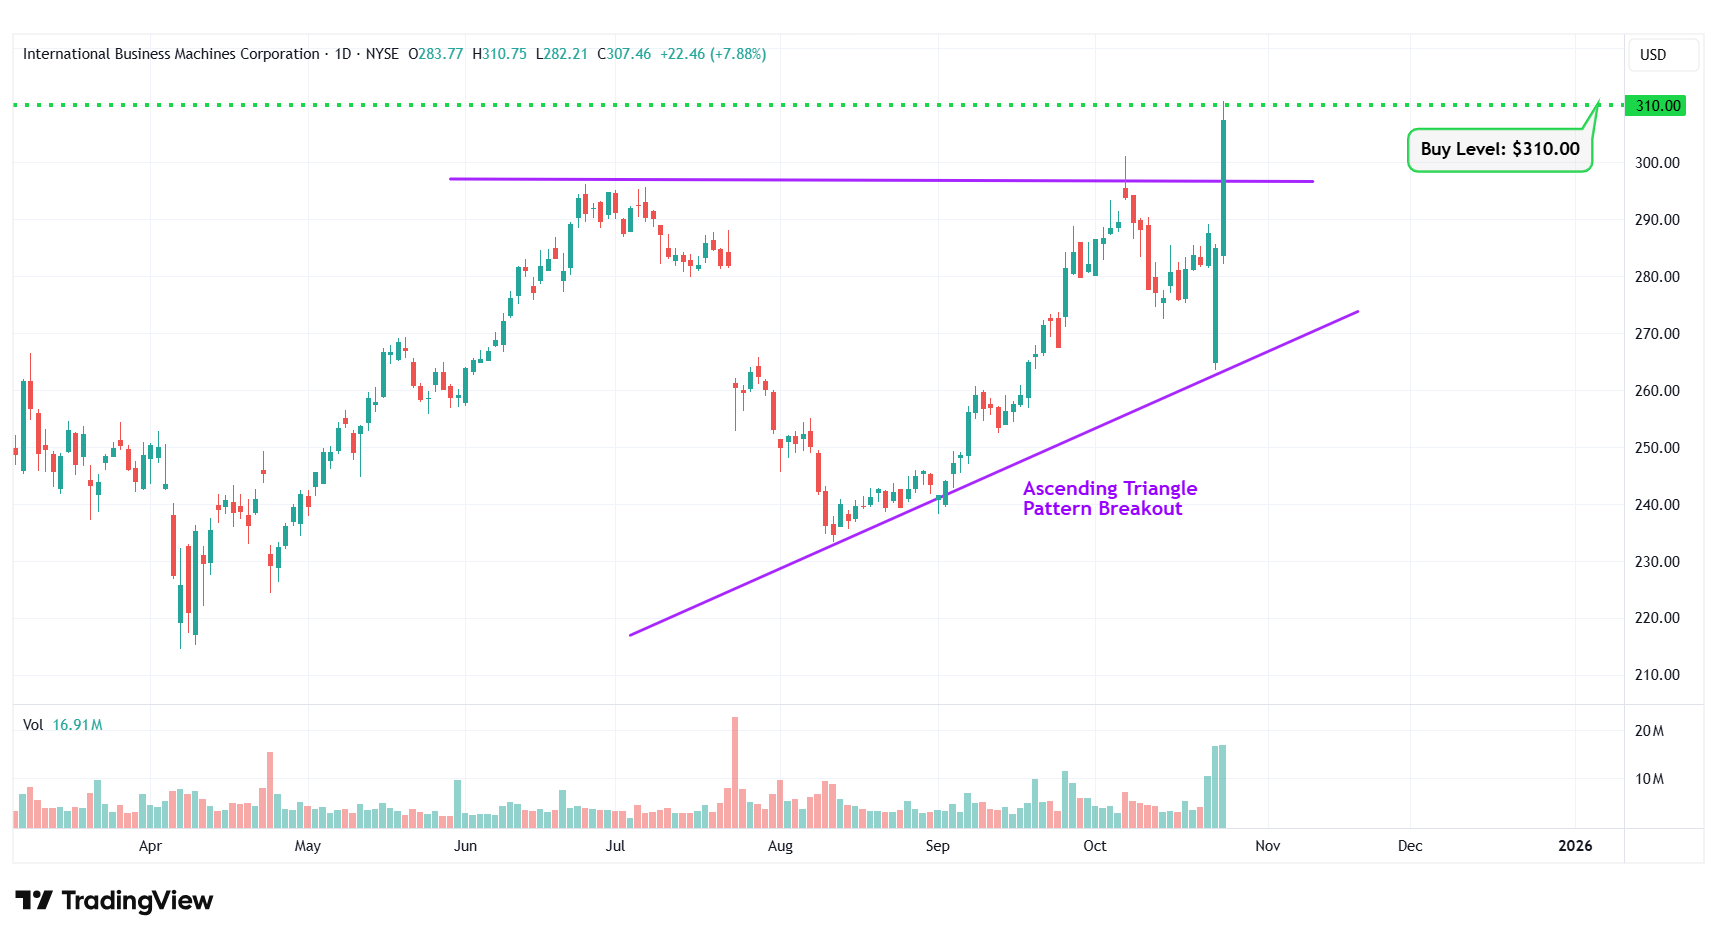
IBM – Ascending Triangle Pattern Breakout
#5 Western Union Company (NYSE: WU)
Sector: Financial • Credit Services
Reason: Downtrend Channel Breakout
A downtrend or descending channel is the price action contained between downward sloping parallel lines. It is formed by two lines that are drawn by connecting the lower highs and lower lows of a stock’s price. Even though this is typically a bearish pattern, a breakout from the upper rail of this pattern is considered a good bullish indication.
Buy Level(s): The daily chart shows that the stock has currently broken out of a downtrend channel. However, there is a near-term resistance level for the stock. Hence, the ideal buy level for WU is if the stock has a daily close above $9.05. This is marked in the chart below as a green color dotted line.
Daily chart – WU
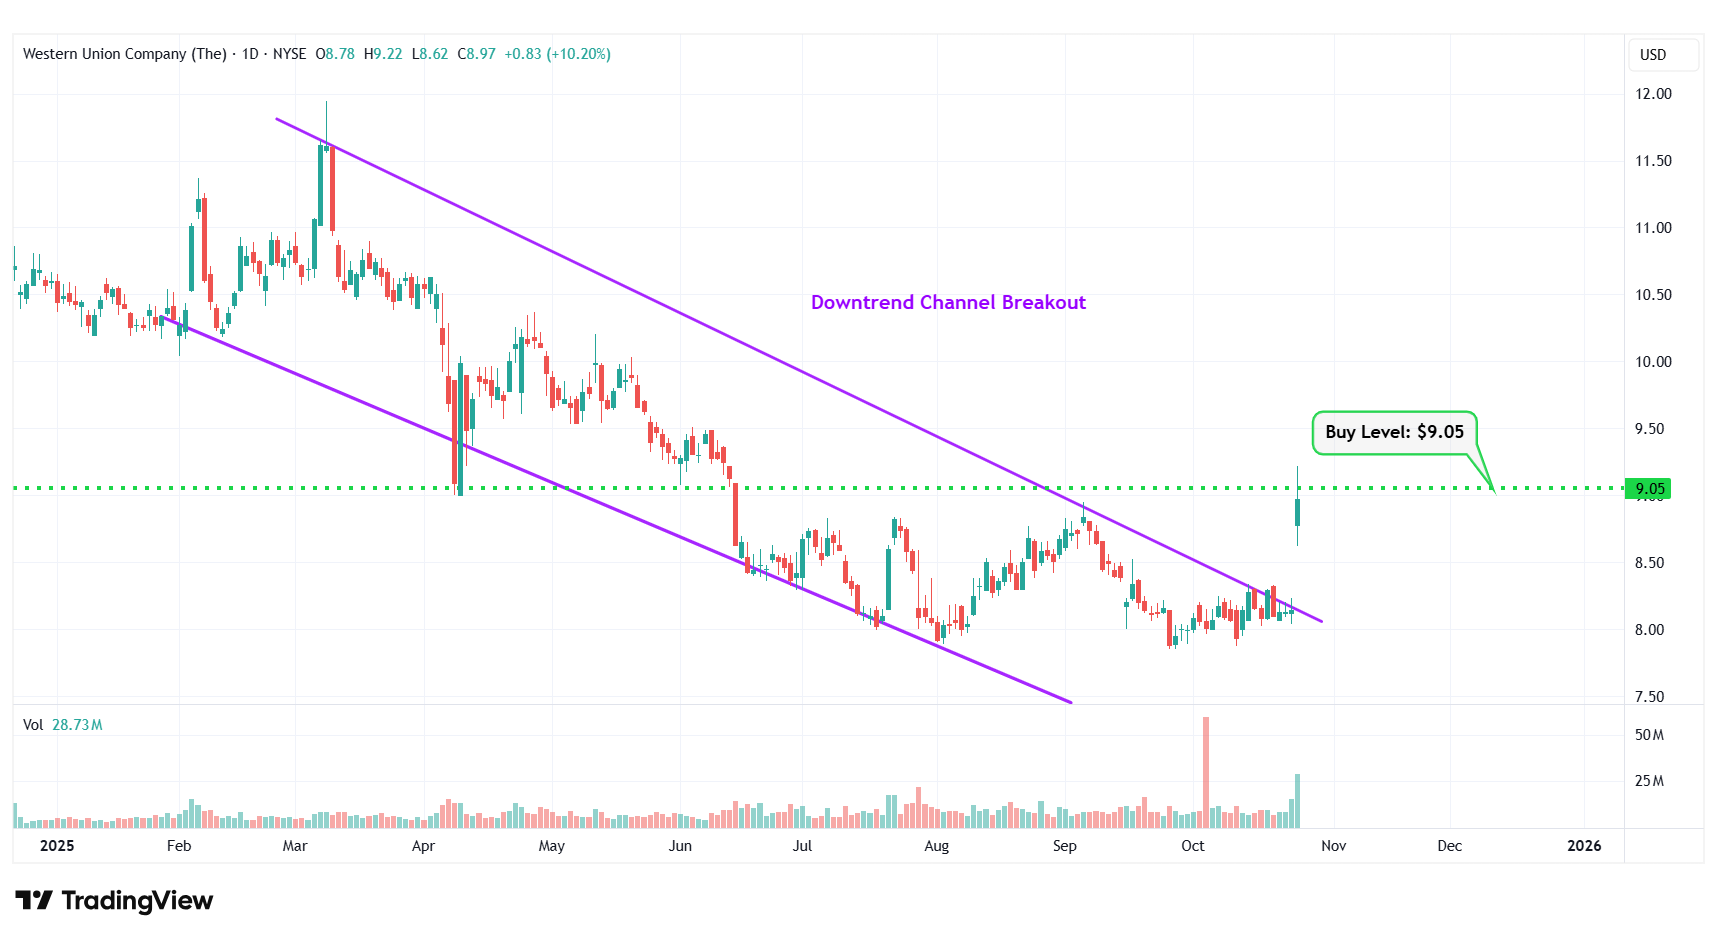
WU – Downtrend Channel Breakout
#6 Brookfield Corporation (NYSE: BN)
Sector: Financial • Asset Management
Reason: Breakout From a Flag Pattern
A flag pattern is a short-term continuation pattern that marks a small consolidation before the previous move resumes. The pattern is formed when the market consolidates in a narrow range after a sharp move. For a stock in an uptrend, a breakout from this pattern is typically a strong bullish indication.
Buy Level(s): Although the stock has currently broken out of the flag pattern, the ideal buy level for BN is above the near-term resistance level of $46.60. This is marked in the chart below as a green color dotted line.
Daily chart – BN
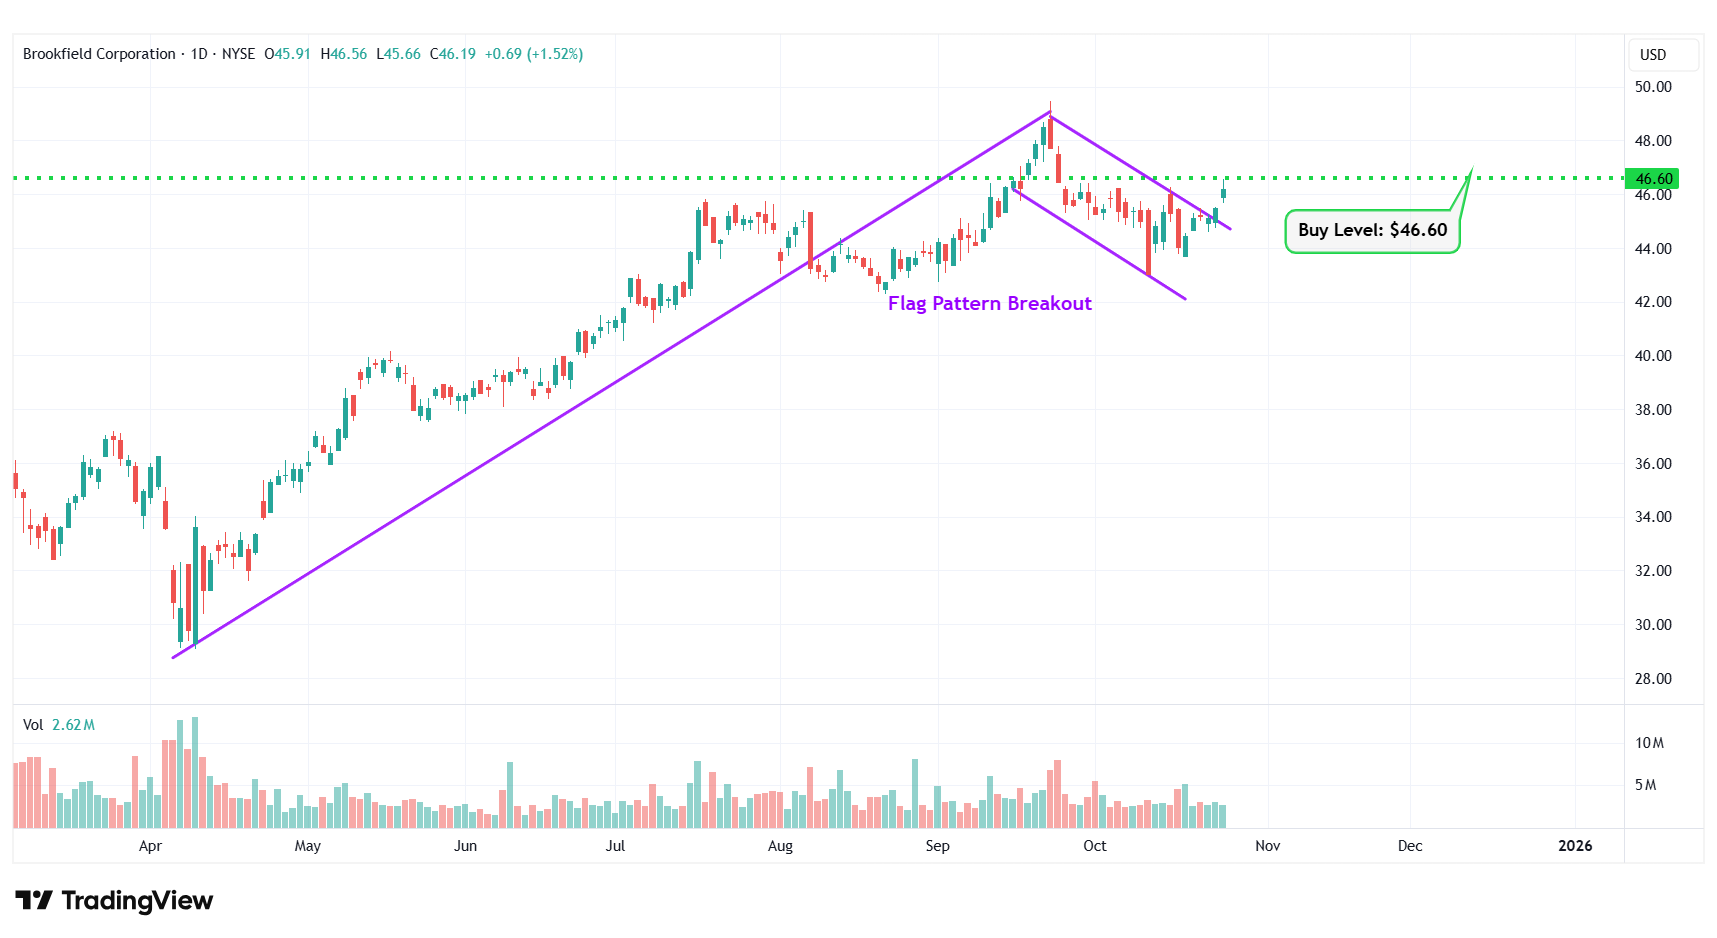
BN – Flag Pattern Breakout
#7 World Kinect Corp (NYSE: WKC)
Sector: Energy • Oil & Gas Refining & Marketing
Reason: Symmetrical Triangle Pattern Breakout
A symmetrical triangle is a chart pattern formed by two converging trend lines connecting a series of sequential peaks and troughs. These two lines result in the formation of a triangle that appears to be symmetrical.
A symmetrical triangle pattern is usually formed when there is indecision in the price movements and there is uncertainty among the buyers and sellers. This chart pattern represents a period of consolidation before the price breaks out or breaks down. In case a breakout occurs from the upper trend line, it is a strong bullish indication as it signifies the start of a new bullish trend.
Buy Level(s): The stock has currently broken out of a symmetrical triangle pattern. However, the ideal buy level for WKC is if the stock closes above the immediate resistance level of $27.00. This is marked in the chart below as a green color dotted line.
Daily chart – WKC
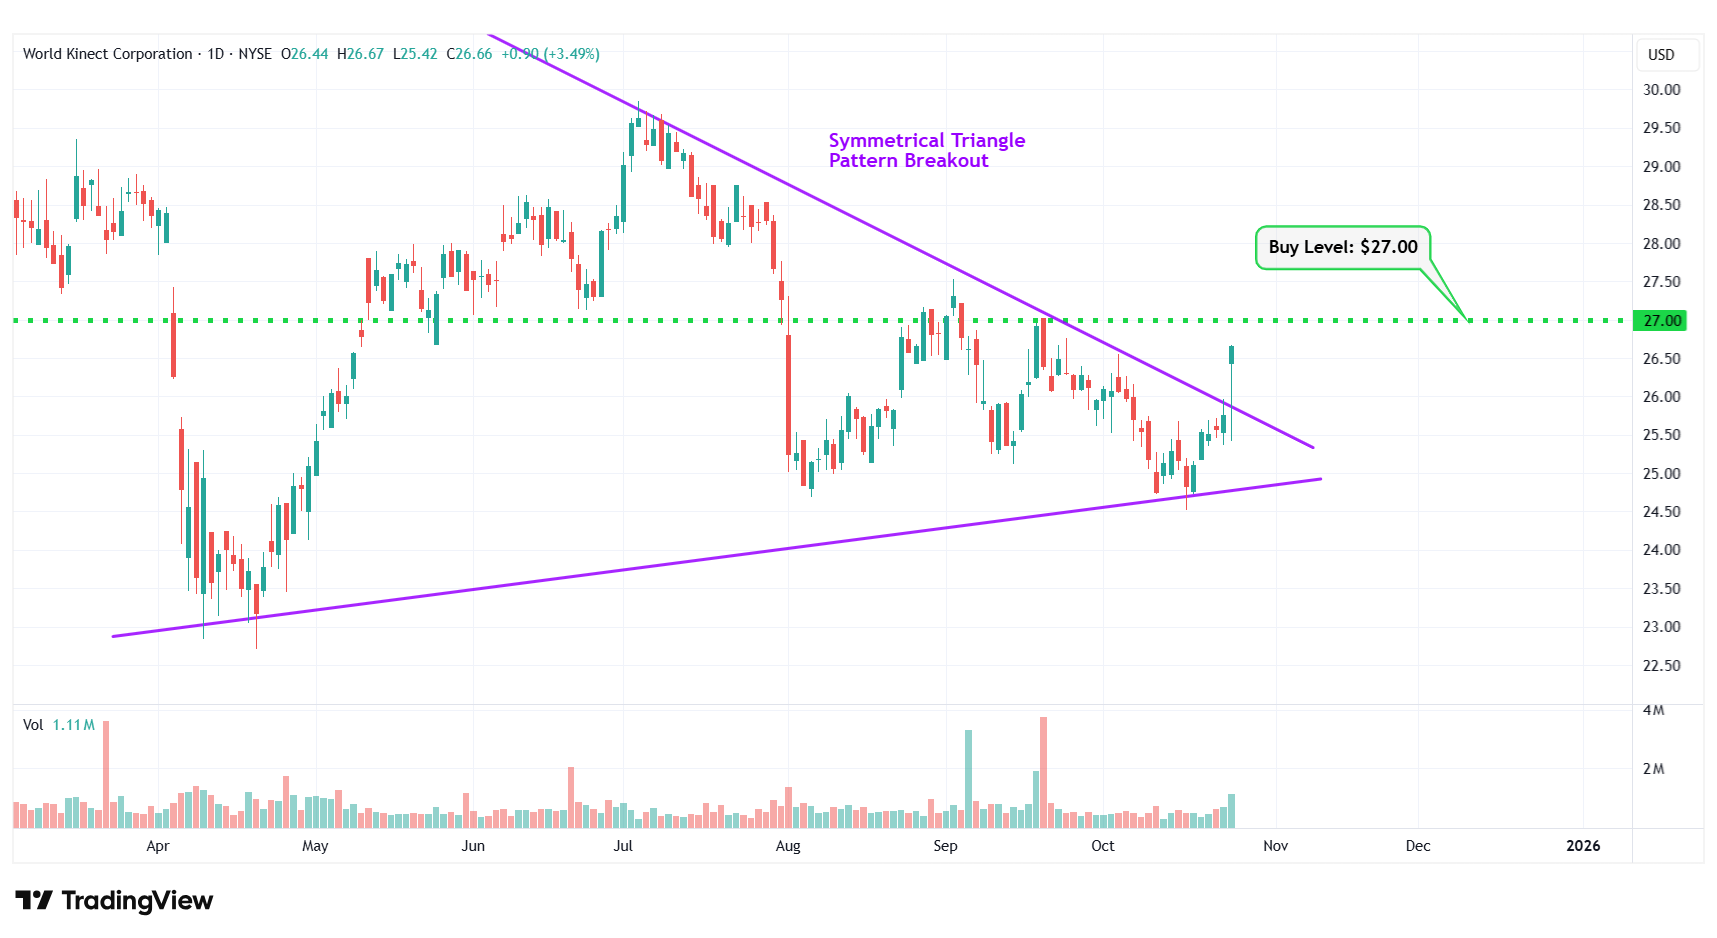
WKC – Symmetrical Triangle Pattern Breakout
#8 Grindr Inc. (NYSE: GRND)
Sector: Technology • Software – Application
Reason: Falling Wedge Pattern Breakout
A falling wedge pattern is formed by joining two downward-sloping, converging trendlines having a contracting range. The pattern appears to be wide at the top and continues to contract as prices fall. A breakout from a falling wedge pattern can indicate either reversal or continuation depending on where the pattern appeared in the trend.
A stock that has broken out of a falling wedge pattern would have gained momentum and would have the potential to move higher.
Buy Level(s): The stock has currently broken out of a falling wedge pattern. However, the ideal buy level for GRND is above the nearest resistance level of $16.20. This is marked in the chart below as a green color dotted line.
Daily chart – GRND
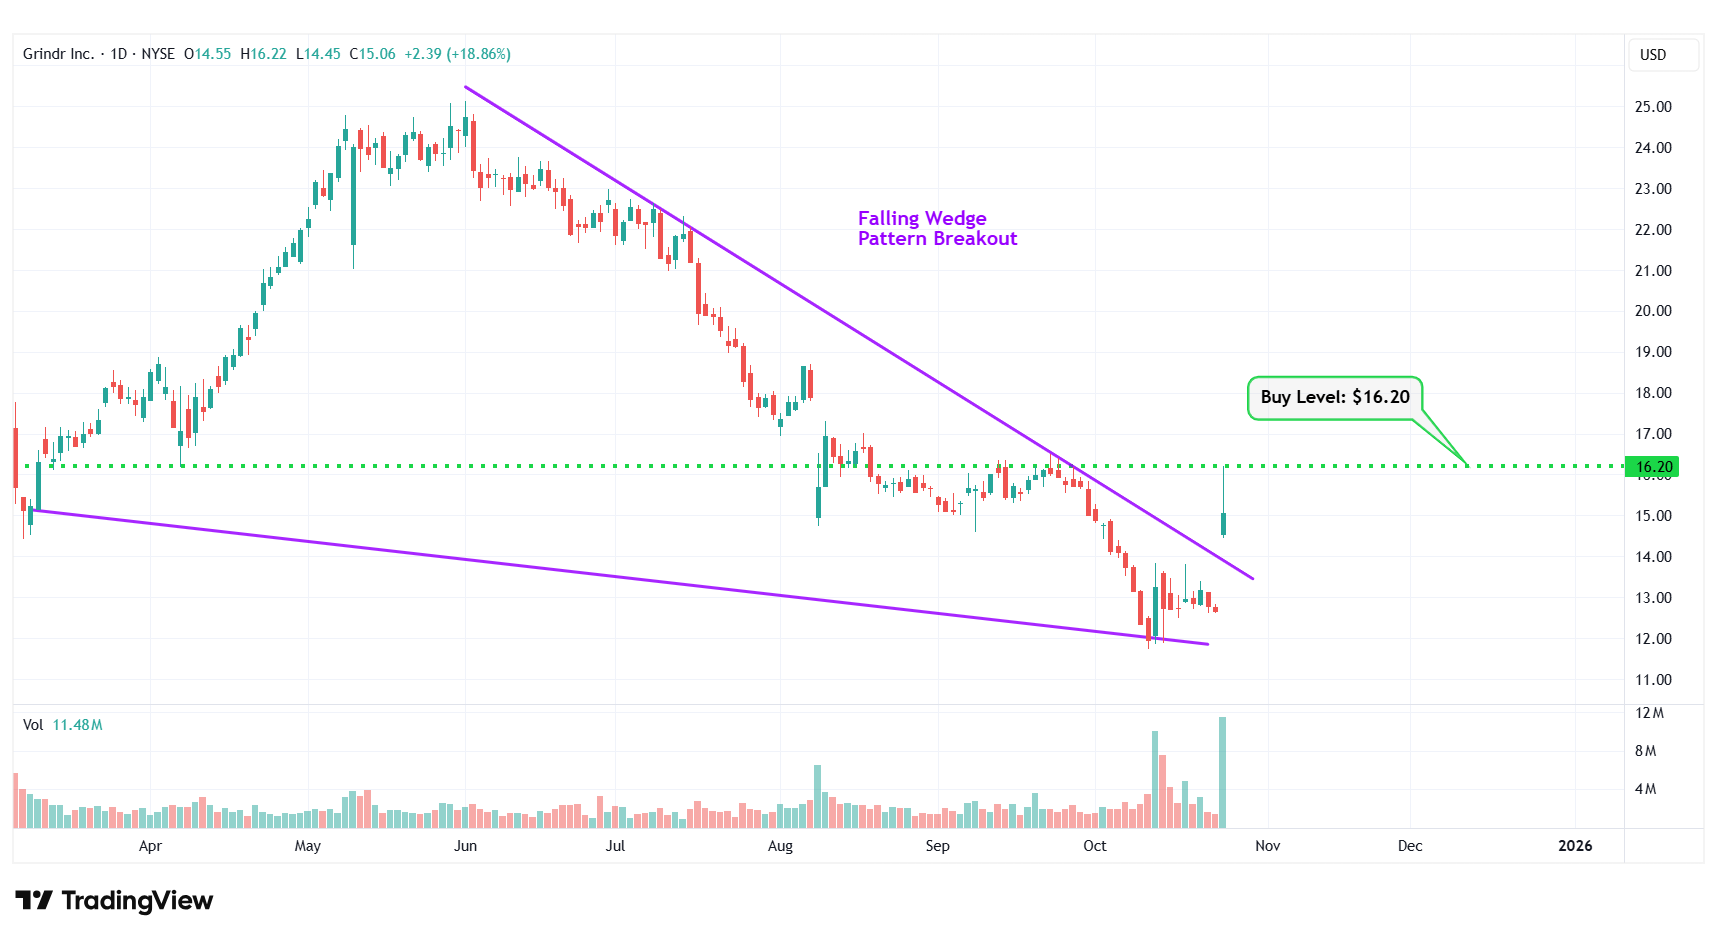
GRND – Falling Wedge Pattern Breakout
#9 Axalta Coating Systems Ltd (NYSE: AXTA)
Sector: Basic Materials • Specialty Chemicals
Reason: Formation of a Downtrend Channel
A downtrend or descending channel is the price action contained between downward sloping parallel lines. It is formed by two lines that are drawn by connecting the lower highs and lower lows of a stock’s price. Even though this is typically a bearish pattern, a breakout from the upper rail of this pattern is considered a good bullish indication.
Buy Level(s): The daily chart shows that the stock is currently forming a downtrend channel. The ideal buy level for AXTA is if the stock breaks out of the downtrend channel and has a daily close above $30.40. This is marked in the chart below as a green color dotted line.
Daily chart – AXTA
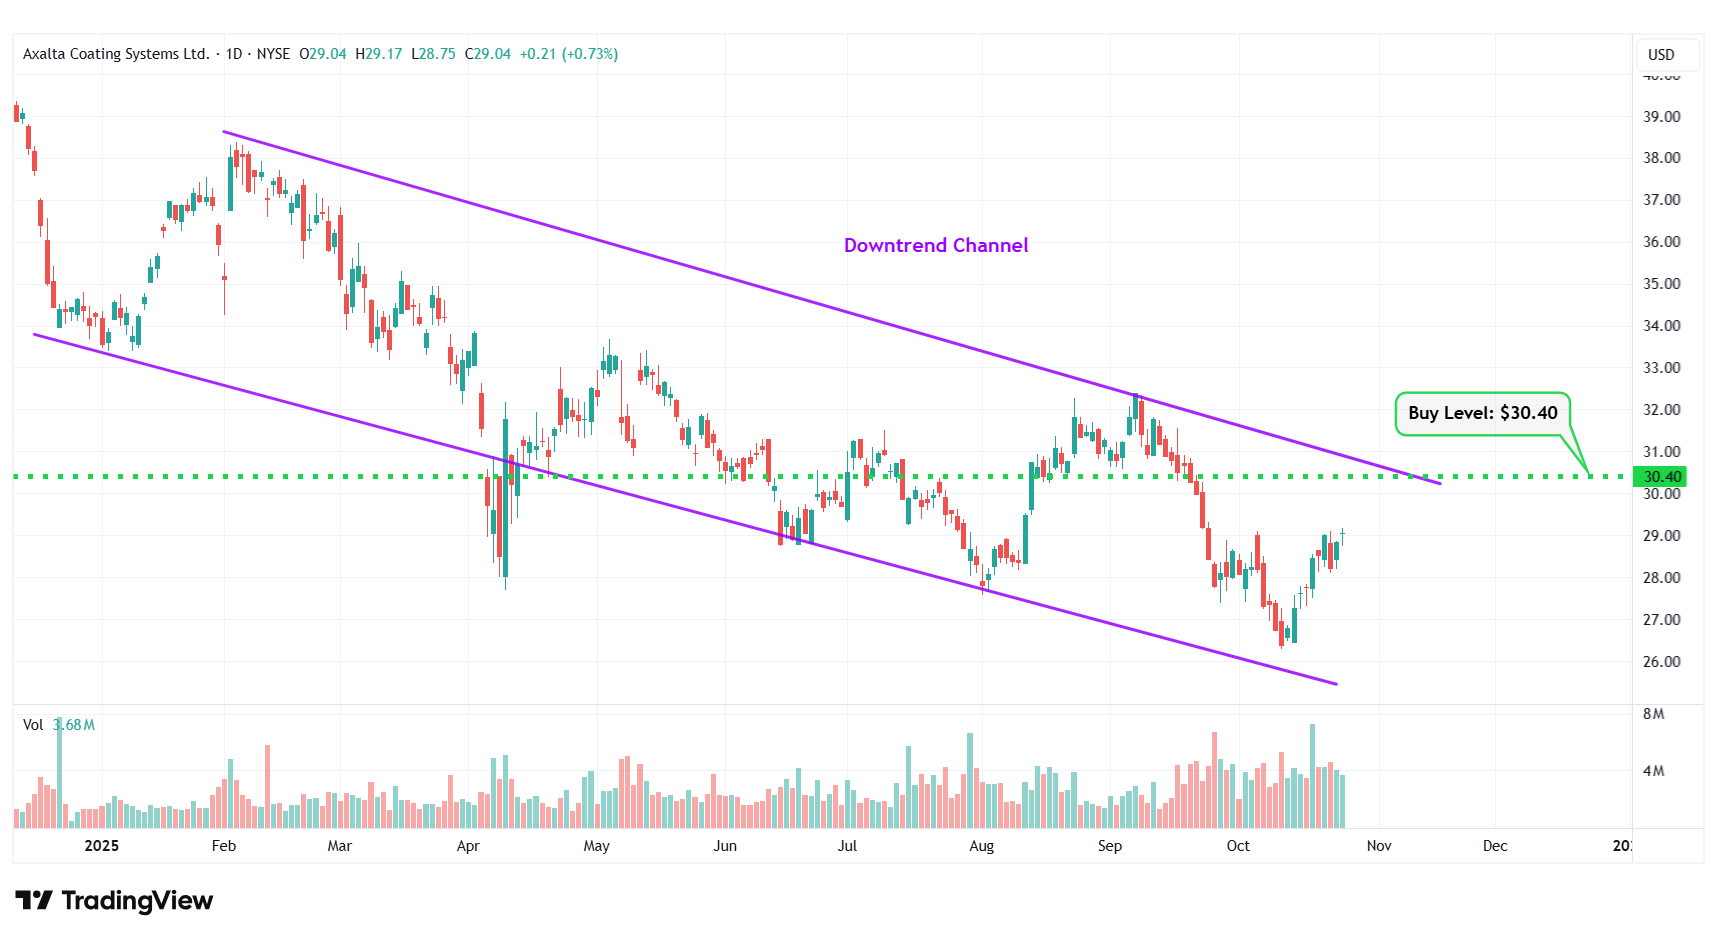
AXTA – Downtrend Channel
#10 Digital Realty Trust Inc. (NYSE: DLR)
Sector: Real Estate • REIT – Specialty
Reason: Symmetrical Triangle Pattern Breakout
A symmetrical triangle is a chart pattern formed by two converging trend lines connecting a series of sequential peaks and troughs. These two lines result in the formation of a triangle that appears to be symmetrical.
A symmetrical triangle pattern is usually formed when there is indecision in the price movements and there is uncertainty among the buyers and sellers. This chart pattern represents a period of consolidation before the price breaks out or breaks down. In case a breakout occurs from the upper trend line, it is a strong bullish indication as it signifies the start of a new bullish trend.
Buy Level(s): The stock has currently broken out of a symmetrical triangle pattern. However, the ideal buy level for DLR is if the stock closes above the immediate resistance level of $181.30. This is marked in the chart below as a green color dotted line.
Daily chart – DLR
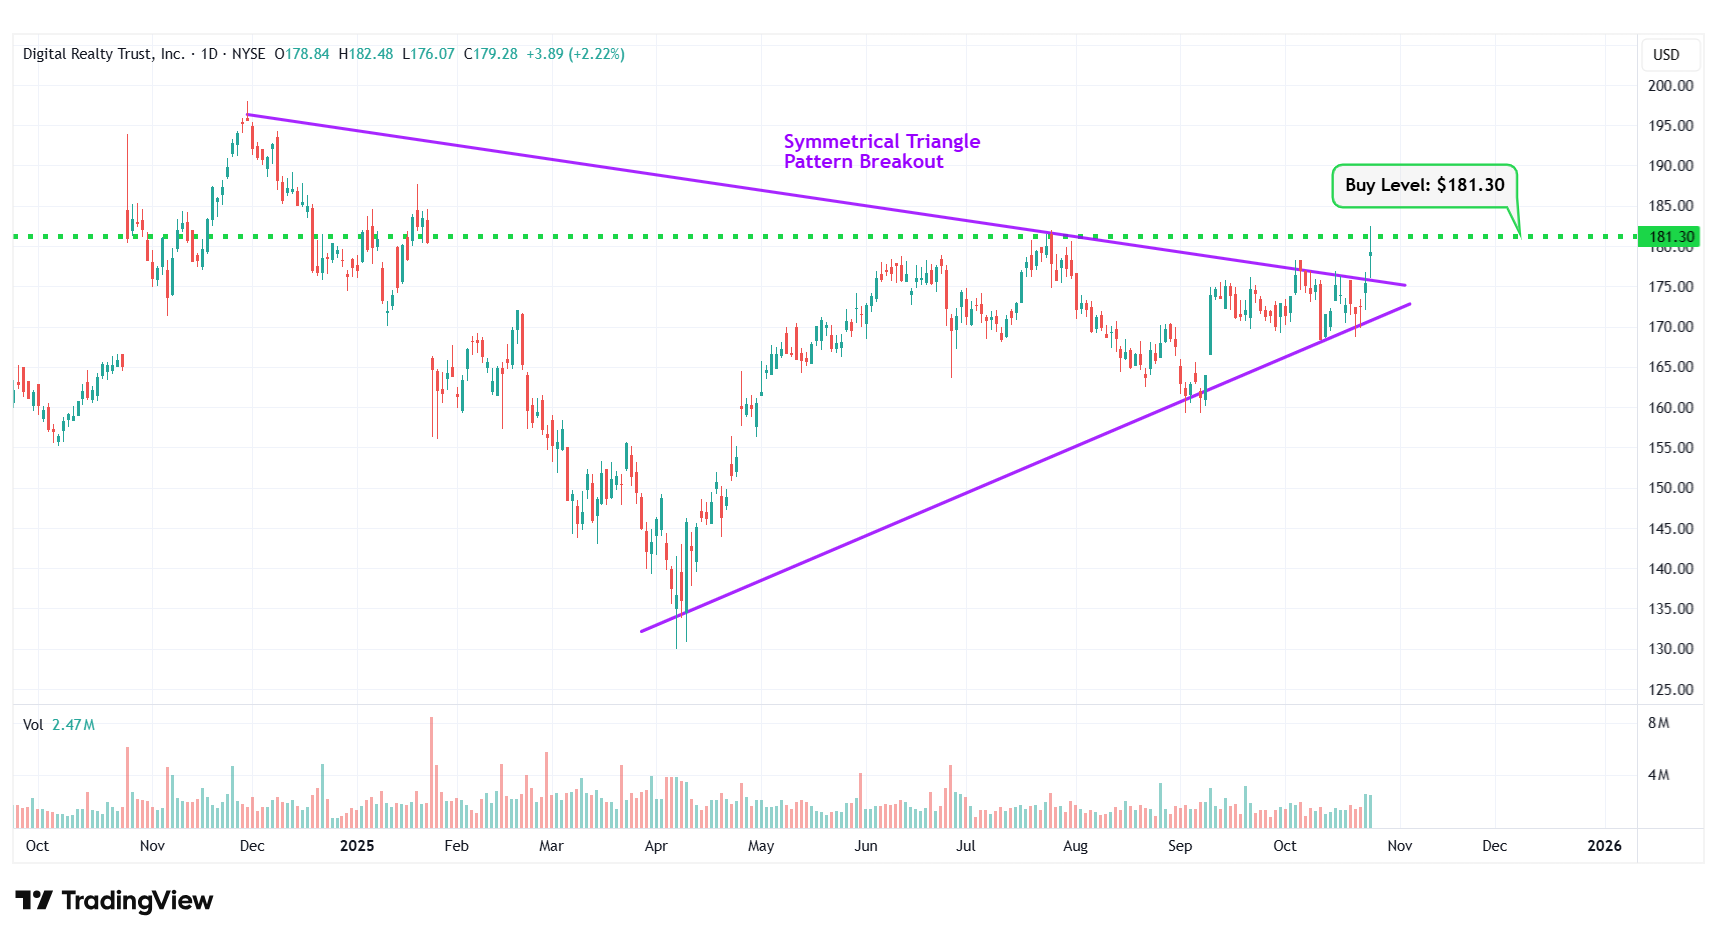
DLR – Symmetrical Triangle Pattern Breakout
Happy Trading!
Trades of The Day Research Team
The old way of investing in tech giants is over. A NEW strategy unlocks 146X more income on the SAME underlying stocks (like Meta, Apple, and Amazon) -- WITHOUT options trading. Click here to uncover the NEW MAG-7 alternative.
Source: Trades of the Day
