Zoom Communications Inc. (NASDAQ: ZM) seems poised for a price surge based on its latest charts. The company provides an Artificial Intelligence-first work platform for human connection in the Americas, the Asia Pacific, Europe, the Middle East, and Africa.
The company offers Zoom Meetings that offer HD video, voice, chat, and content sharing through mobile devices, desktops, laptops, telephones, and conference room systems; Zoom Phone, a cloud phone system; Zoom Team Chat; Zoom Workflow Automation; and Zoom Mail and Calendar.
The company’s recent earnings beat (revenue +4.7%, EPS +10%), raised FY guide, and AI-driven growth may help drive its price higher.
Bullish Indications
#1 Symmetrical Triangle Pattern: The daily chart shows that the stock has recently formed a Symmetrical Triangle pattern. This is a continuation pattern and is characterized by two converging trend lines connecting a series of sequential peaks and troughs. This pattern is marked on the daily chart as purple lines. The breakout from a symmetrical triangle pattern usually signifies a bullish move. Currently, the stock looks poised for a breakout of the symmetrical triangle pattern which is a possible bullish sign.
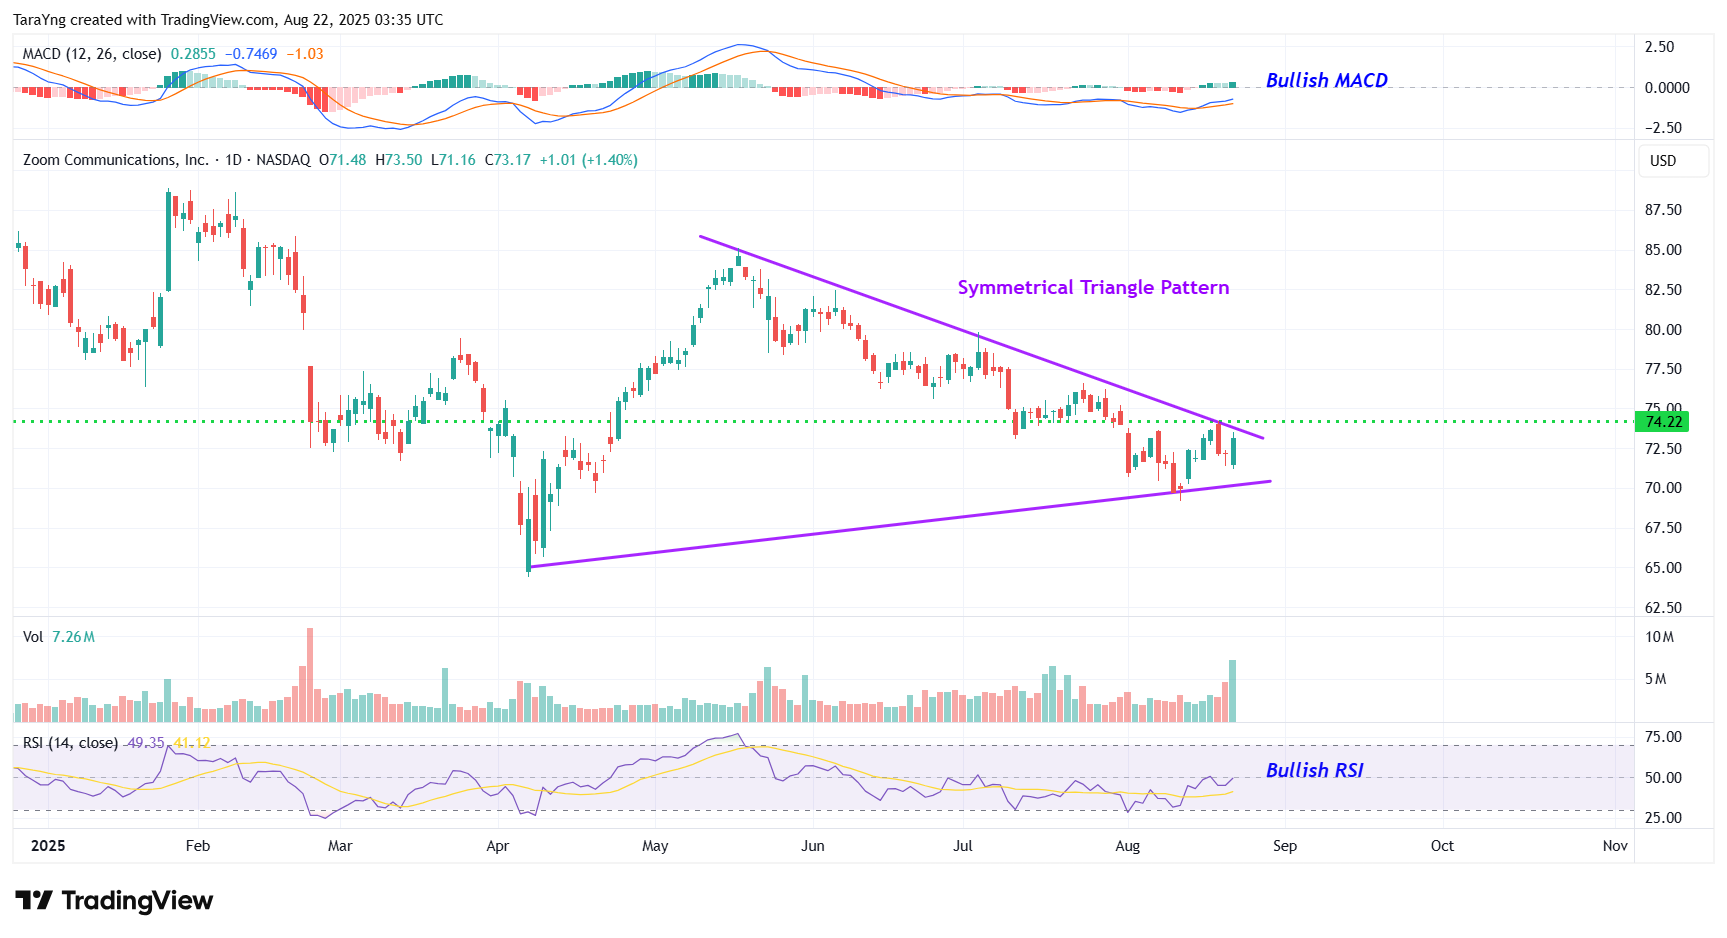
ZM – Daily Chart
#2 MACD Above Signal Line: In the daily chart, the MACD line (light blue color) is currently above the MACD signal line (orange color) which is typically considered bullish.
#3 Bullish RSI: The daily chart shows that the RSI is moving higher from oversold levels and is currently nearing 50. This is a possible bullish sign.
#4 Above Support Area: As you can see from the weekly chart, the stock has currently moved up from a resistance-turned-support level. This level is marked as a pink dotted line. This looks like a good area for the stock to move higher.
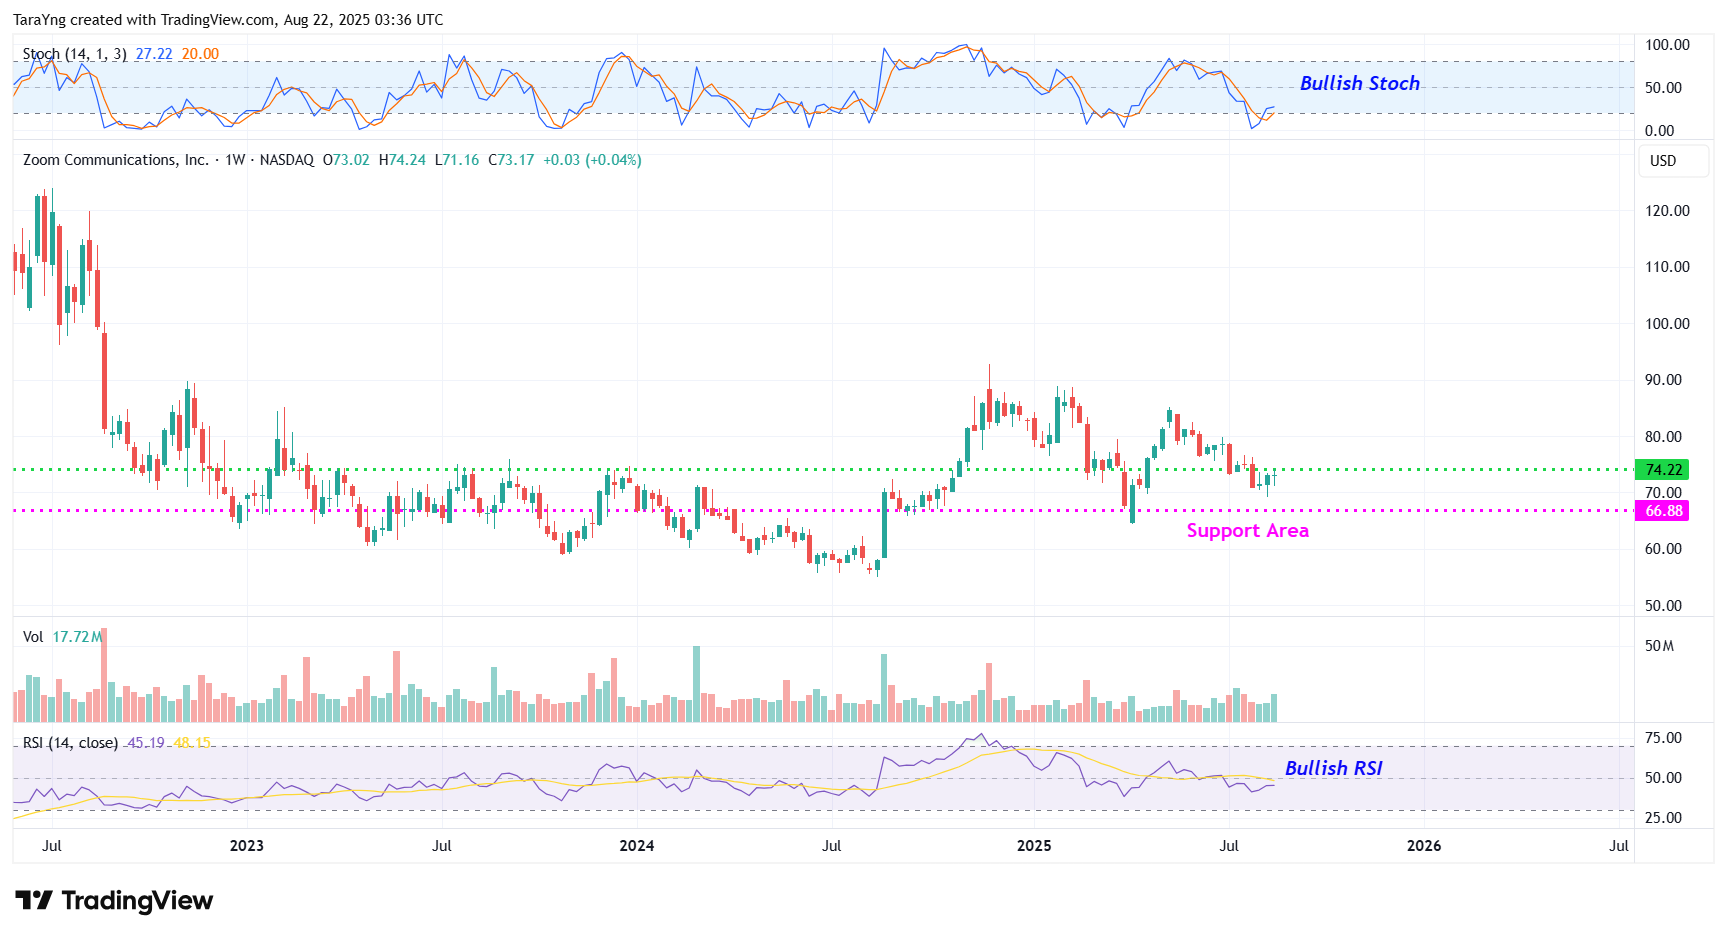
ZM – Weekly Chart
#5 %K above %D: The %K (blue) line of stochastic has currently crossed above the %D (Orange) line in the weekly chart and is also moving higher from oversold levels. This is a possible bullish indication.
#6 Bullish RSI: In the weekly chart, the RSI is currently nearing 50 and moving higher. This is a possible bullish sign.
Recommended Trade (based on the charts)
Buy Levels: If you want to get in on this trade, you can purchase shares of ZM above the price of around $74.20.
TP: Our target prices are $83.00 and $90.00 in the next 3-6 months.
SL: To limit risk, place a stop-loss at $69.00. Note that the stop-loss is on a closing basis.
Our target potential upside is 12% to 21% in the next 3 to 6 months.
For a risk of $5.20, our target rewards are $8.80 and $15.80. This is a nearly 1:2 and 1:3 risk-reward trade.
In other words, this trade offers nearly 2x to 3x more potential upside than downside.
Risks to Consider
The stock may reverse its overall trend if it breaks down from the symmetrical triangle pattern with a high volume. The sell-off of the stock could also be triggered in case of any negative news, overall weakness in the market, or any regulatory changes in the sector.
Happy Trading!
Tara
The old way of investing in tech giants is over. A NEW strategy unlocks 146X more income on the SAME underlying stocks (like Meta, Apple, and Amazon) -- WITHOUT options trading. Click here to uncover the NEW MAG-7 alternative.
Source: Trades of the Day
