
Picking a winning trade on a consistent basis is not simply a stroke of luck. It’s the result of calculated screening, planning, and deliberation.
With this in mind, we have started a new weekly series on our top 10 stocks to watch this week — stocks that look poised for a possible breakout in the coming days. Traders should add these stocks to their watchlist now.
The Top 10 Stocks to Watch This Week for Possible Breakouts
| Sl # | Name of the Stock | Stock Ticker | Last Close | Buy Level(s) | Reason |
| 1 | Lilly & Co. | NYSE: LLY | $771.71 | $791.00 | Symmetrical Triangle Pattern |
| 2 | Mesoblast Ltd ADR | NASDAQ: MESO | $15.62 | $16.00 | Falling Wedge Pattern Breakout |
| 3 | Invesco Ltd. | NYSE: IVZ | $19.92 | $20.10 | Symmetrical Triangle Pattern Breakout |
| 4 | Talen Energy Corp | NASDAQ: TLN | $328.63 | $331.30 | Uptrend Channel Breakout |
| 5 | Riot Platforms Inc. | NASDAQ: RIOT | $13.86 | $14.10 | Symmetrical Triangle Pattern Breakout |
| 6 | Charles Schwab Corp | NYSE: SCHW | $95.80 | $96.40 | Rising Wedge Pattern Breakout |
| 7 | Applied Digital Corporation | NASDAQ: APLD | $11.93 | $12.10 | Symmetrical Triangle Pattern Breakout |
| 8 | Cheniere Energy Inc. | NYSE: LNG | $244.28 | $245.80 | Symmetrical Triangle Pattern |
| 9 | Regions Financial Corp | NYSE: RF | $26.01 | $26.40 | Symmetrical Triangle Pattern Breakout |
| 10 | IonQ Inc. | NYSE: IONQ | $46.51 | $48.20 | Symmetrical Triangle Pattern |
Important: Typically, these trades offer a risk: reward ratio of 1:2 or 1:3 in the next 6 months, which implies 2x to 3x rewards when compared to risks. So, be sure to set your stop-loss levels and target prices accordingly to manage your risk. In addition, these trade ideas are triggered using daily closing prices, not intra-day pricing. So, if you participate in these trades, make sure that you only buy the stock once its daily close is above the recommended price level.
That said, here are the top 10 stocks to watch for a breakout, in no particular order.
#1 Lilly(Eli) & Co. (NYSE: LLY)
Sector: Healthcare • Drug Manufacturers – General
Reason: Formation of a Symmetrical Triangle Pattern
A symmetrical triangle is a chart pattern formed by two converging trend lines connecting a series of sequential peaks and troughs. These two lines result in the formation of a triangle that appears to be symmetrical.
A symmetrical triangle pattern is usually formed when there is indecision in the price movements and there is uncertainty among the buyers and sellers. This chart pattern represents a period of consolidation before the price breaks out or breaks down. In case a breakout occurs from the upper trend line, it is a strong bullish indication as it signifies the start of a new bullish trend.
Buy Level(s): The ideal buy level for LLY is if the stock has a daily close above the breakout level of the symmetrical triangle pattern, at around $791.00. This is marked in the chart below as a green color dotted line.
Daily chart – LLY
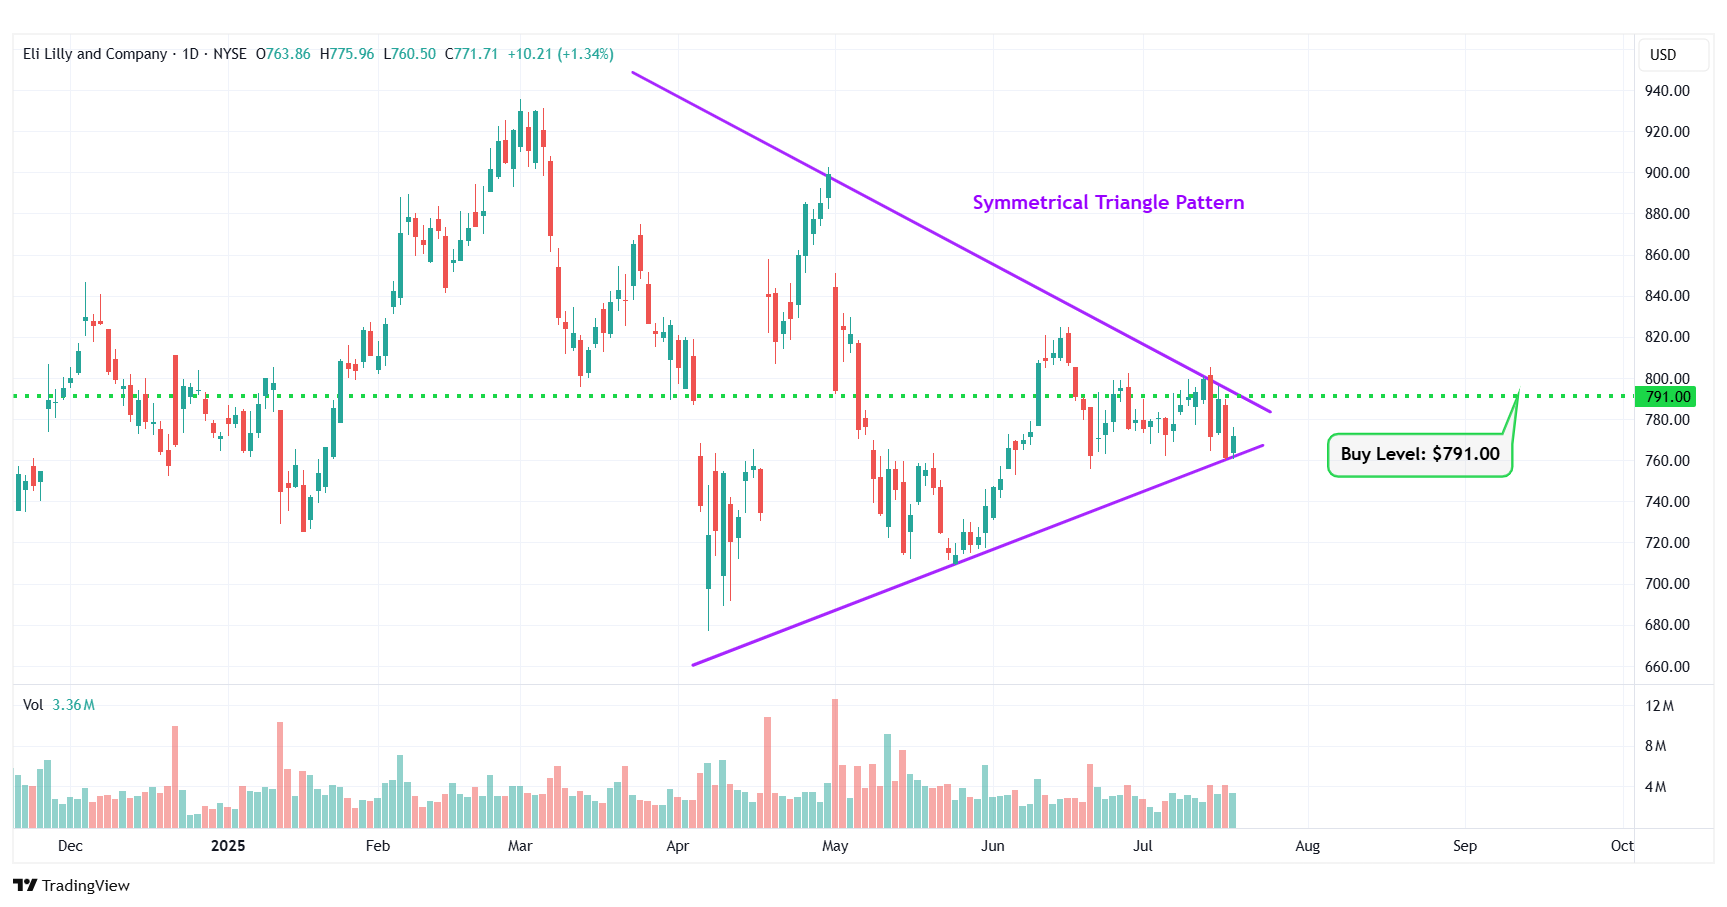
LLY – Symmetrical Triangle Pattern
#2 Mesoblast Ltd ADR (NASDAQ: MESO)
Sector: Healthcare • Biotechnology
Reason: Falling Wedge Pattern Breakout
A falling wedge pattern is formed by joining two downward-sloping, converging trendlines having a contracting range. The pattern appears to be wide at the top and continues to contract as prices fall. A breakout from a falling wedge pattern can indicate either reversal or continuation depending on where the pattern appeared in the trend.
A stock that has broken out of a falling wedge pattern would have gained momentum and would have the potential to move higher.
Buy Level(s): The stock has currently broken out of a falling wedge pattern. However, the ideal buy level for MESO is above the nearest resistance level of $16.00. This is marked in the chart below as a green color dotted line.
Daily chart – MESO
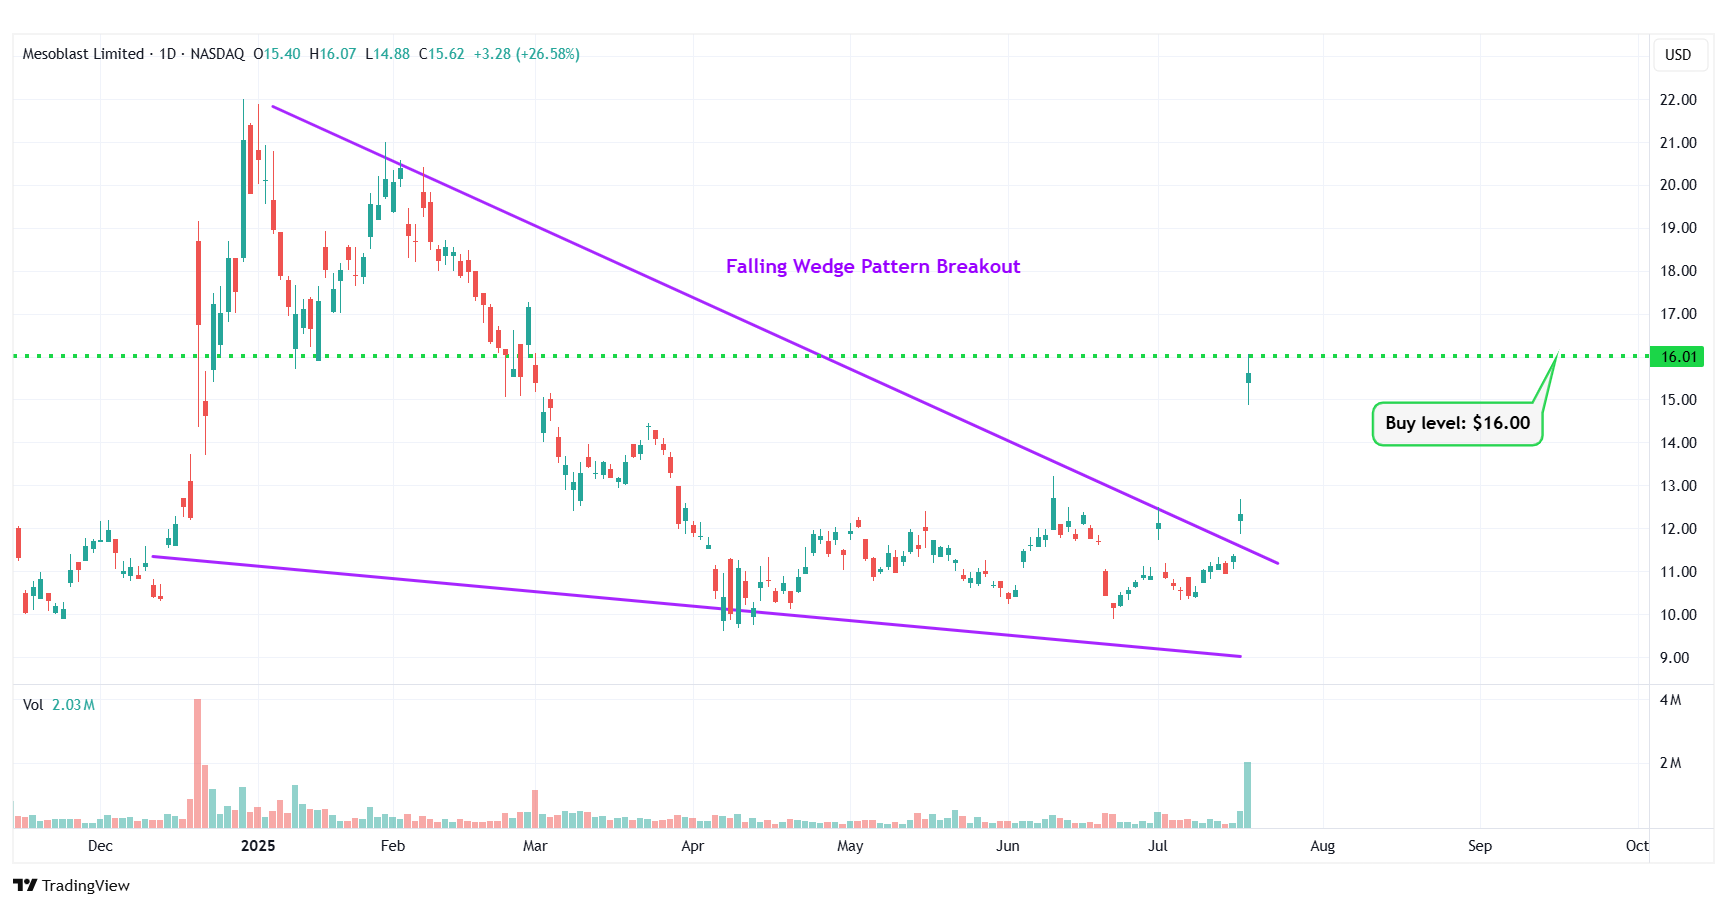
MESO – Falling Wedge Pattern Breakout
#3 Invesco Ltd. (NYSE: IVZ)
Sector: Financial • Asset Management
Reason: Symmetrical Triangle Pattern Breakout
A symmetrical triangle is a chart pattern formed by two converging trend lines connecting a series of sequential peaks and troughs. These two lines result in the formation of a triangle that appears to be symmetrical.
A symmetrical triangle pattern is usually formed when there is indecision in the price movements and there is uncertainty among the buyers and sellers. This chart pattern represents a period of consolidation before the price breaks out or breaks down. In case a breakout occurs from the upper trend line, it is a strong bullish indication as it signifies the start of a new bullish trend.
Buy Level(s): The stock has currently broken out of a symmetrical triangle pattern. However, the ideal buy level for IVZ is if the stock closes above the immediate resistance level of $20.10. This is marked in the chart below as a green color dotted line.
Daily chart – IVZ
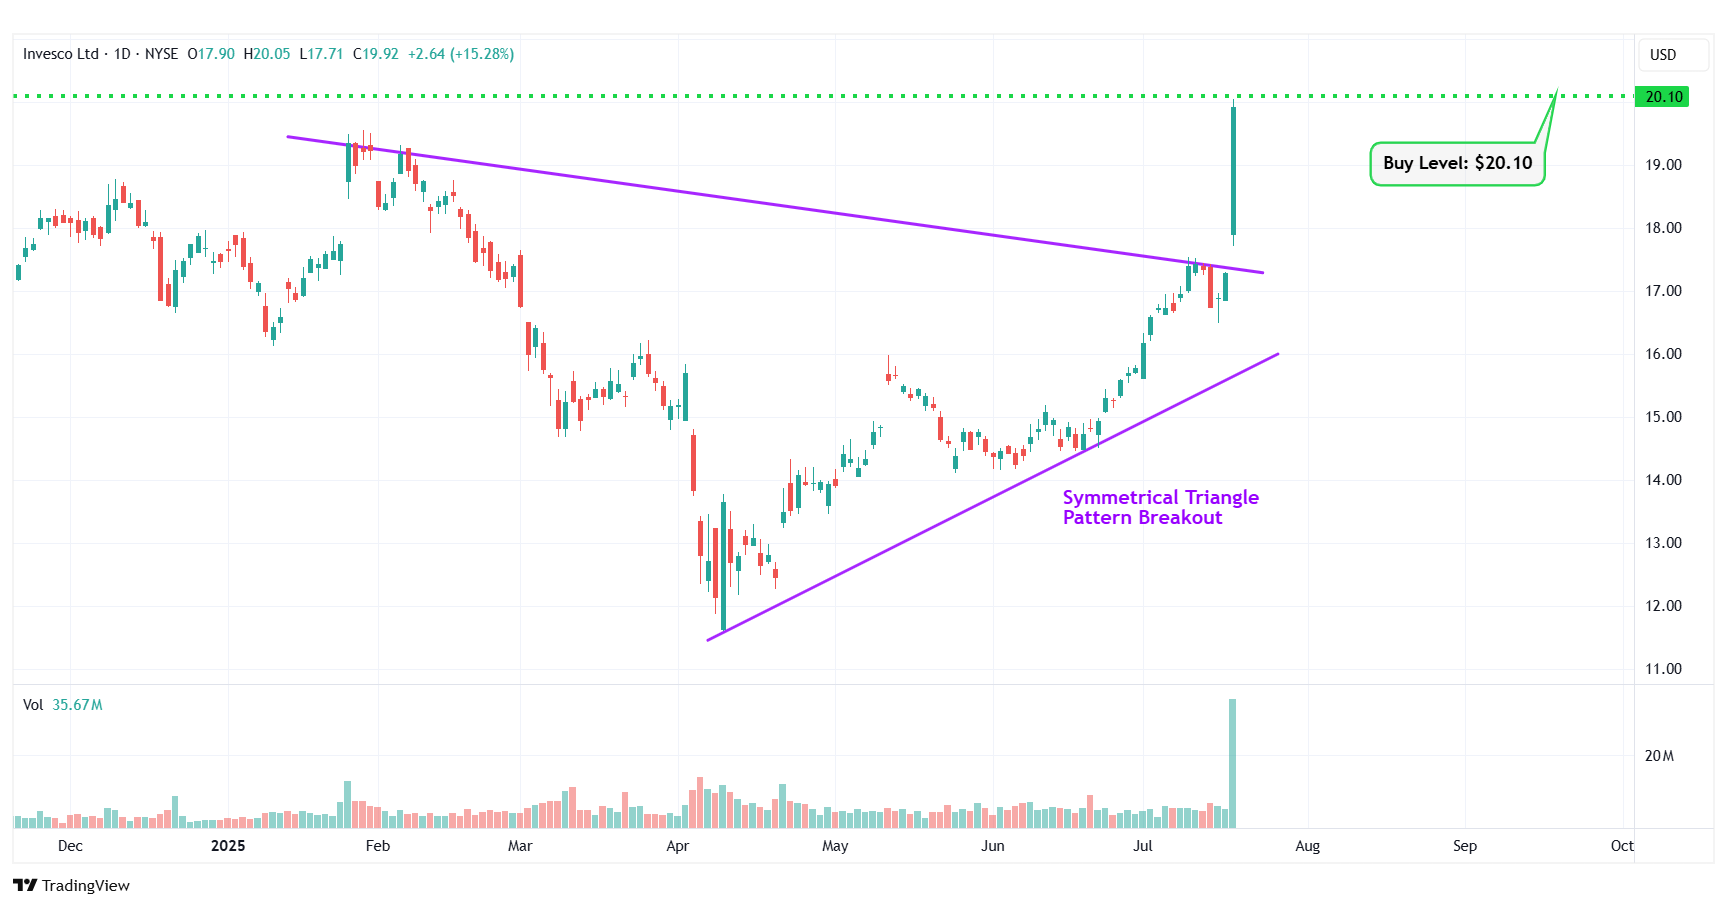
IVZ – Symmetrical Triangle Pattern Breakout
#4 Talen Energy Corp (NASDAQ: TLN)
Sector: Utilities • Utilities – Independent Power Producers
Reason: Breakout From an Uptrend Channel
An uptrend channel or an ascending channel is the price action contained between upward sloping parallel lines. It is formed by a lower trend line that connects the swing lows, and an upper channel line that joins the swing highs. A stock usually trades between the two rails of the uptrend channel before finally breaking out from the upper rail.
Buy Level(s): The stock has currently broken out of the uptrend channel. However, the ideal buy level for TLN is if the stock has a daily close above the near-term resistance level of $331.30. This is marked in the chart below as a green color dotted line.
Daily chart – TLN
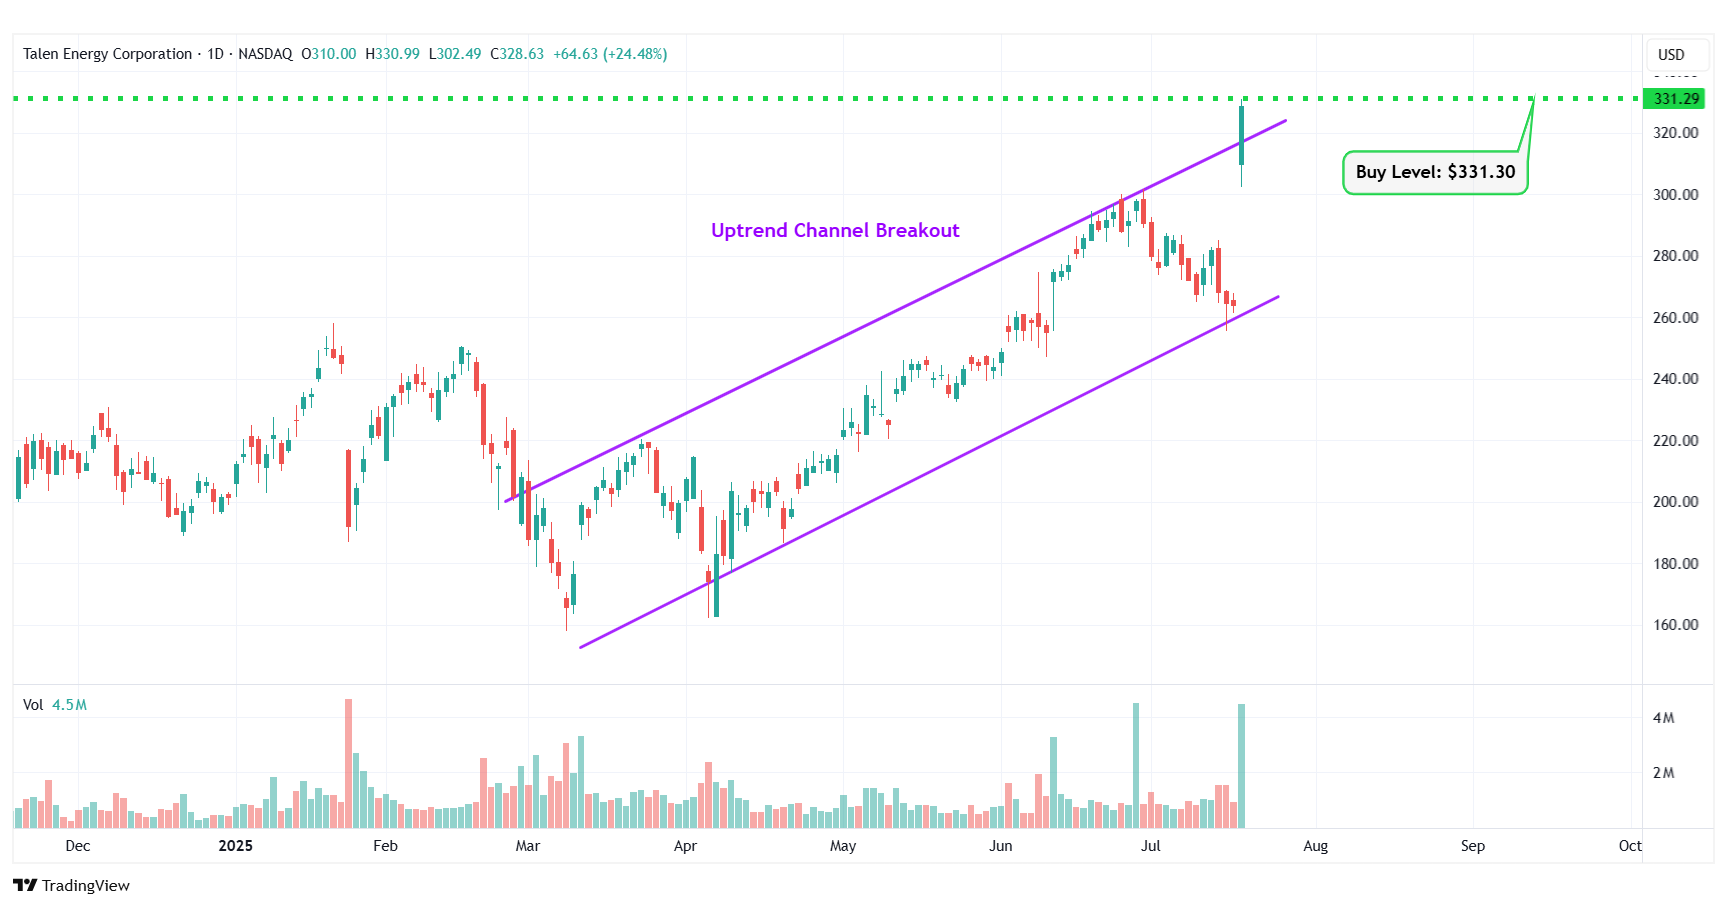
TLN – Uptrend Channel Breakout
#5 Riot Platforms Inc. (NASDAQ: RIOT)
Sector: Financial • Capital Markets
Reason: Symmetrical Triangle Pattern Breakout
A symmetrical triangle is a chart pattern formed by two converging trend lines connecting a series of sequential peaks and troughs. These two lines result in the formation of a triangle that appears to be symmetrical.
A symmetrical triangle pattern is usually formed when there is indecision in the price movements and there is uncertainty among the buyers and sellers. This chart pattern represents a period of consolidation before the price breaks out or breaks down. In case a breakout occurs from the upper trend line, it is a strong bullish indication as it signifies the start of a new bullish trend.
Buy Level(s): The stock has currently broken out of a symmetrical triangle pattern. However, the ideal buy level for RIOT is if the stock closes above the immediate resistance level of $14.10. This is marked in the chart below as a green color dotted line.
Daily chart – RIOT
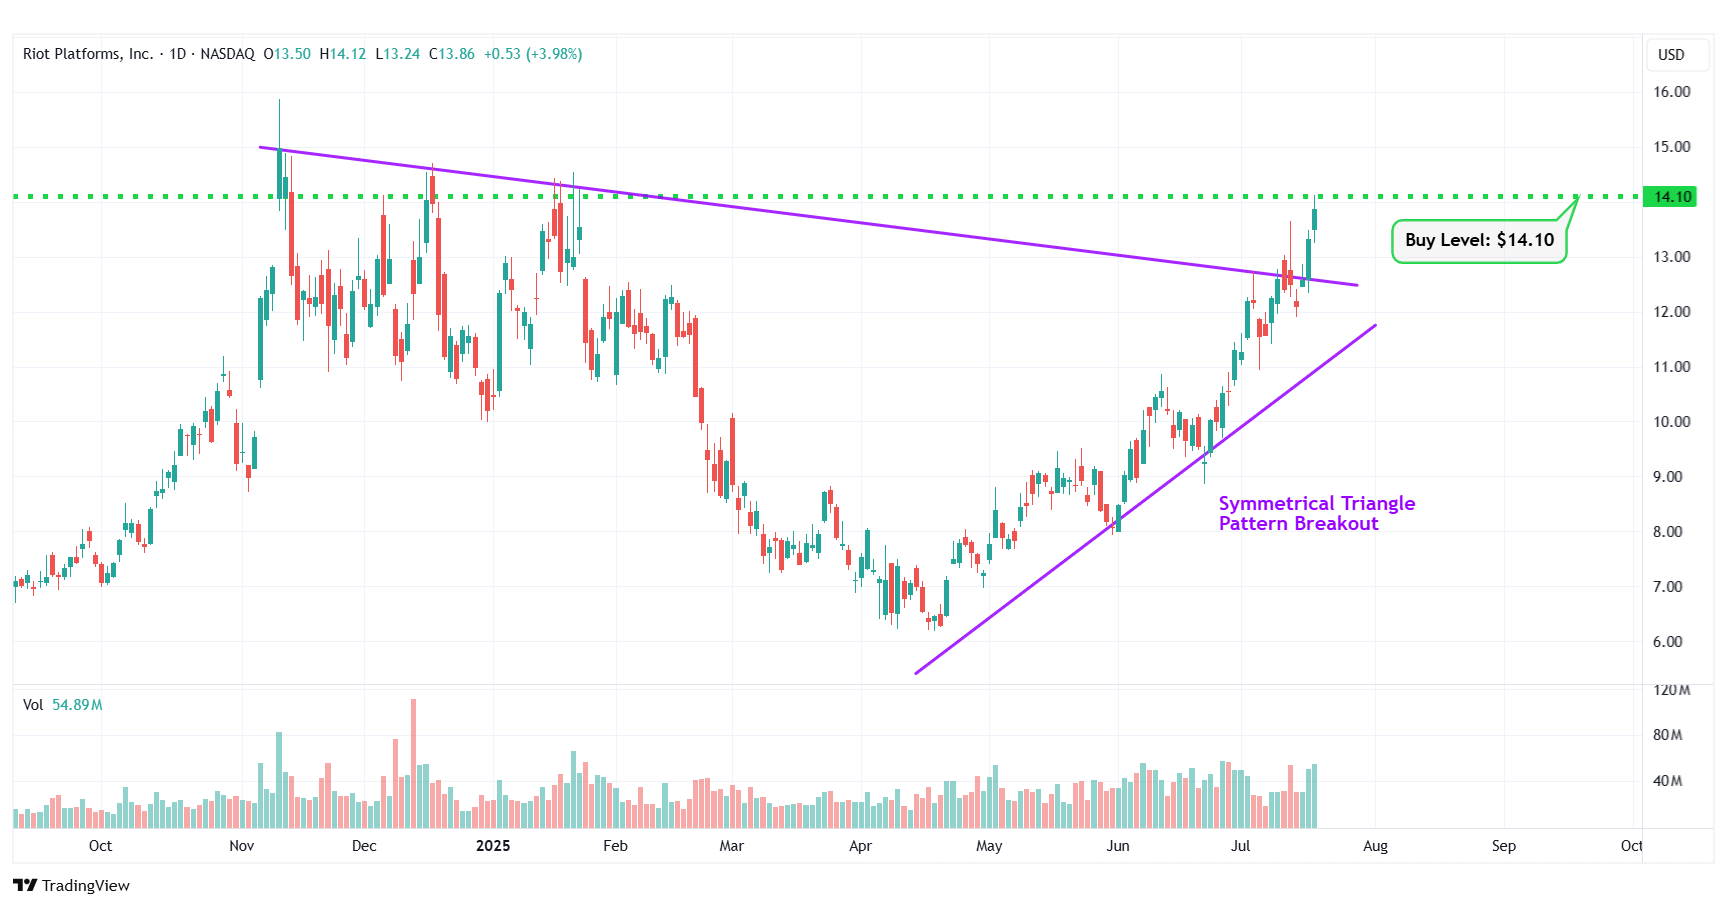
RIOT – Symmetrical Triangle Pattern Breakout
#6 Charles Schwab Corp (NYSE: SCHW)
Sector: Financial • Capital Markets
Reason: Rising Wedge Pattern Breakout
A rising wedge pattern is formed by joining two upward-sloping, converging trendlines having a contracting range. The pattern appears to be wide at the bottom and continues to contract as prices rise. A breakout from a rising wedge pattern is often associated with high momentum and can signal an extended move. However, buying on this breakout is considered a more speculative trade due to the potential for a reversal.
Buy Level(s): The stock has currently broken out of a rising wedge pattern. However, the ideal buy level for SCHW is above the nearest resistance level of $96.40. This is marked in the chart below as a green color dotted line.
Daily chart – SCHW
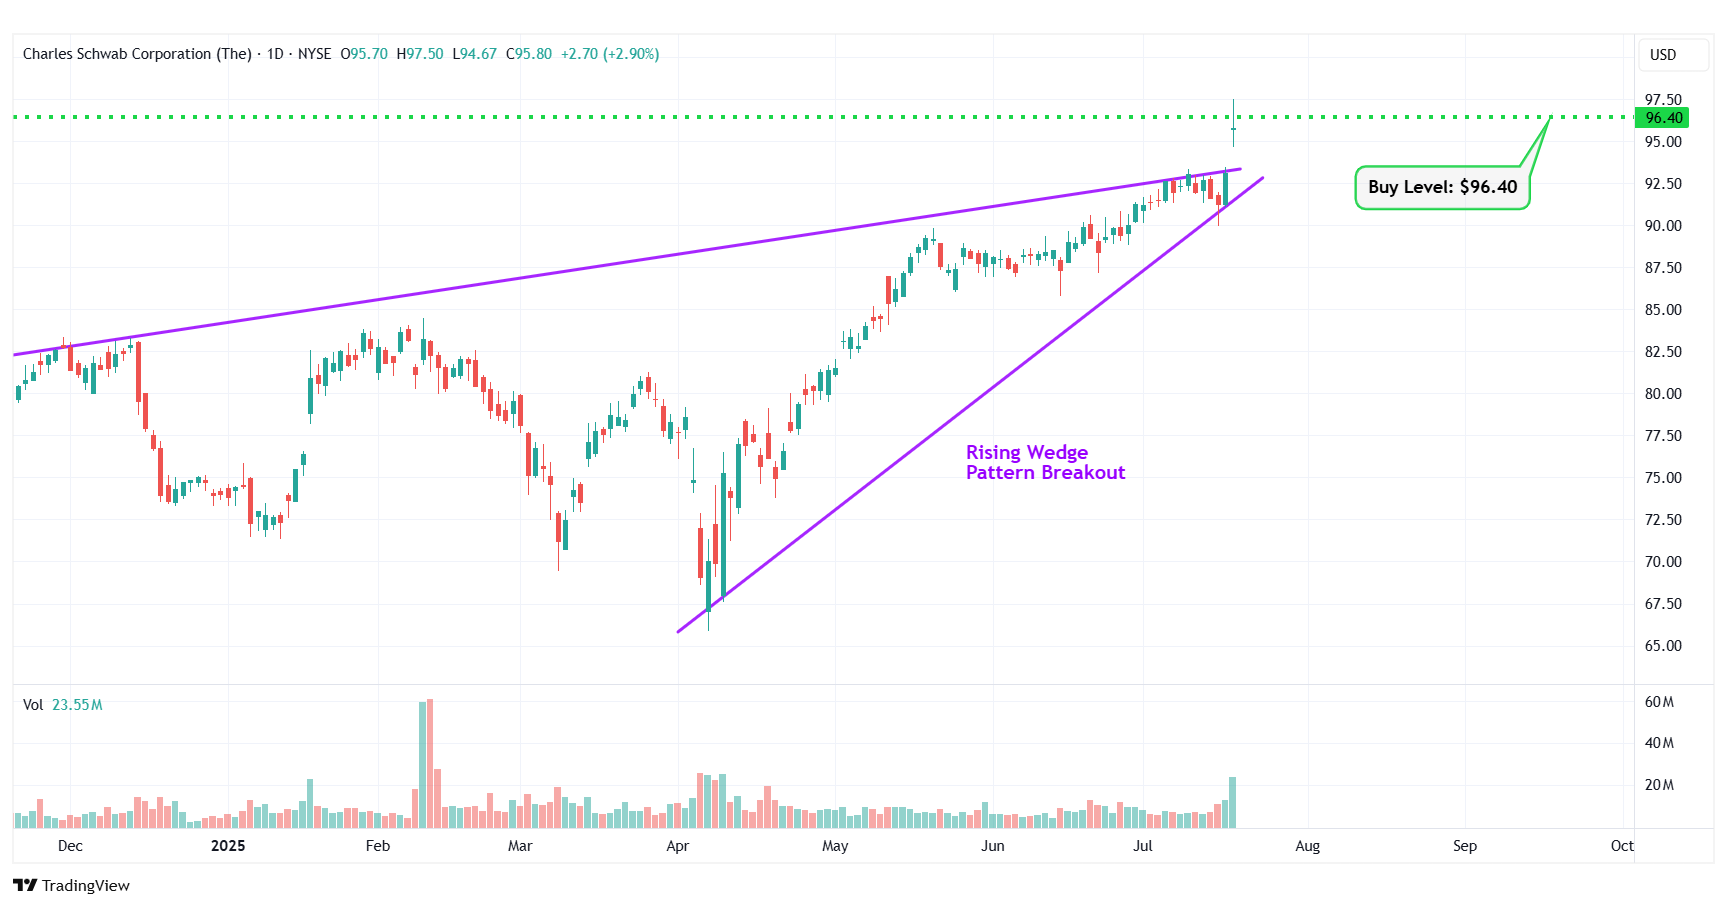
SCHW – Rising Wedge Pattern Breakout
#7 Applied Digital Corporation (NASDAQ: APLD)
Sector: Technology • Information Technology Services
Reason: Symmetrical Triangle Pattern Breakout
A symmetrical triangle is a chart pattern formed by two converging trend lines connecting a series of sequential peaks and troughs. These two lines result in the formation of a triangle that appears to be symmetrical.
A symmetrical triangle pattern is usually formed when there is indecision in the price movements and there is uncertainty among the buyers and sellers. This chart pattern represents a period of consolidation before the price breaks out or breaks down. In case a breakout occurs from the upper trend line, it is a strong bullish indication as it signifies the start of a new bullish trend.
Buy Level(s): The stock has currently broken out of a symmetrical triangle pattern. However, the ideal buy level for APLD is if the stock closes above the immediate resistance level of $12.10. This is marked in the chart below as a green color dotted line.
Daily chart – APLD
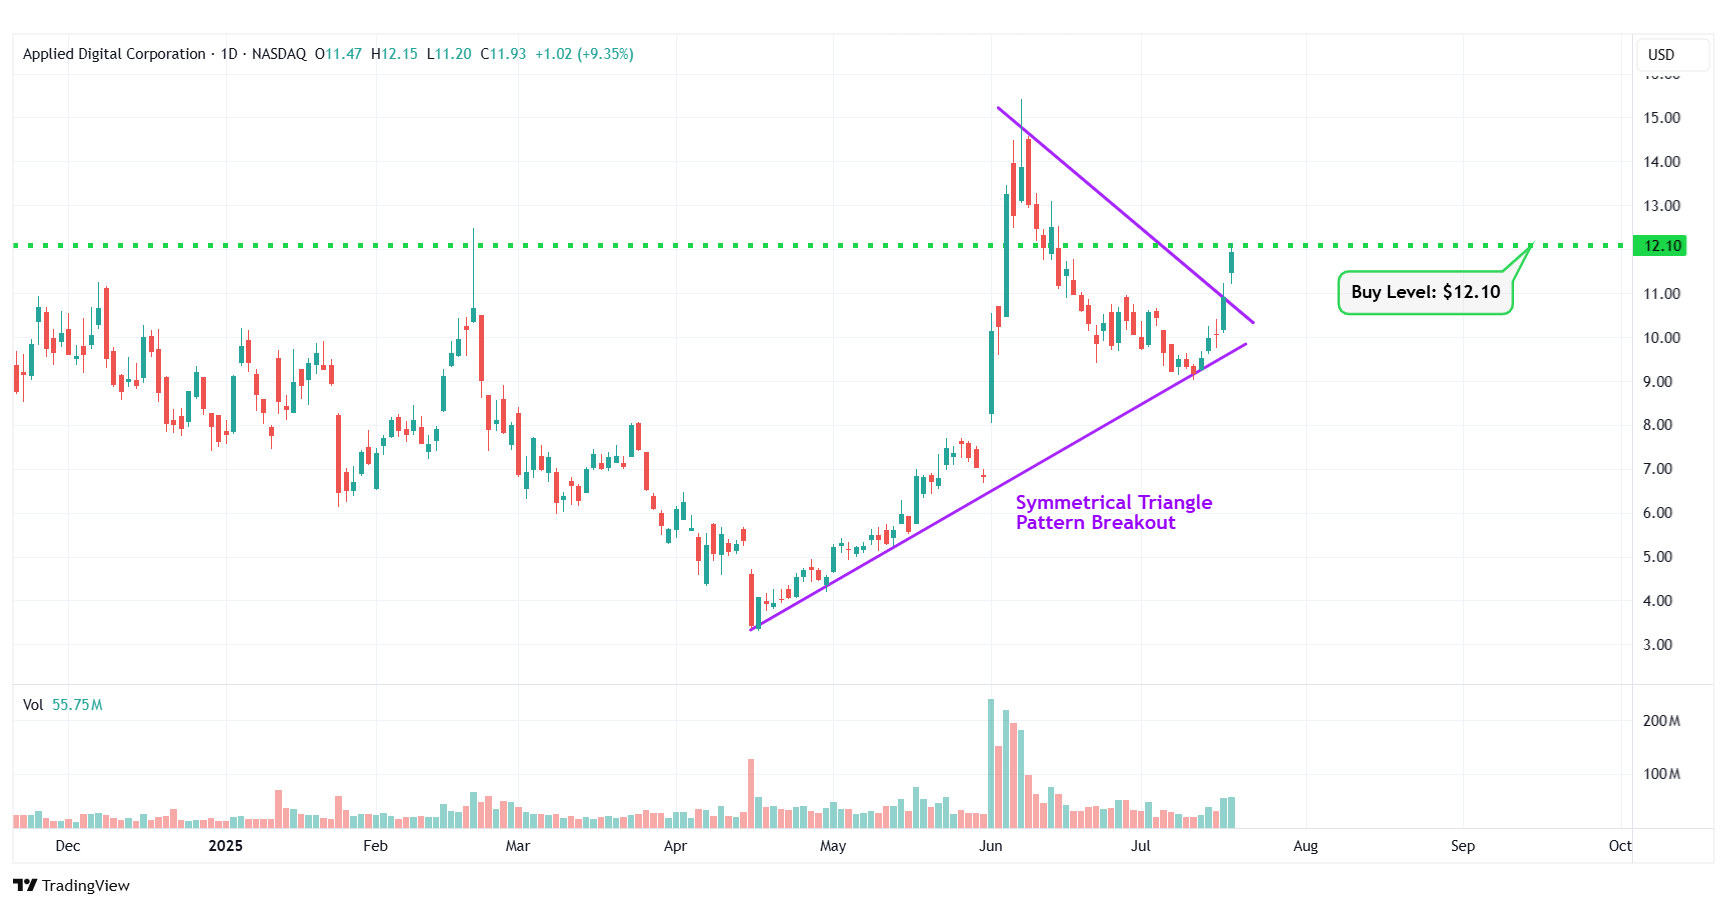
APLD – Symmetrical Triangle Pattern Breakout
#8 Cheniere Energy Inc. (NYSE: LNG)
Sector: Energy • Oil & Gas Midstream
Reason: Formation of a Symmetrical Triangle Pattern
A symmetrical triangle is a chart pattern formed by two converging trend lines connecting a series of sequential peaks and troughs. These two lines result in the formation of a triangle that appears to be symmetrical.
A symmetrical triangle pattern is usually formed when there is indecision in the price movements and there is uncertainty among the buyers and sellers. This chart pattern represents a period of consolidation before the price breaks out or breaks down. In case a breakout occurs from the upper trend line, it is a strong bullish indication as it signifies the start of a new bullish trend.
Buy Level(s): The ideal buy level for LNG is if the stock has a daily close above the breakout level of the symmetrical triangle pattern, at around $245.80. This is marked in the chart below as a green color dotted line.
Daily chart – LNG
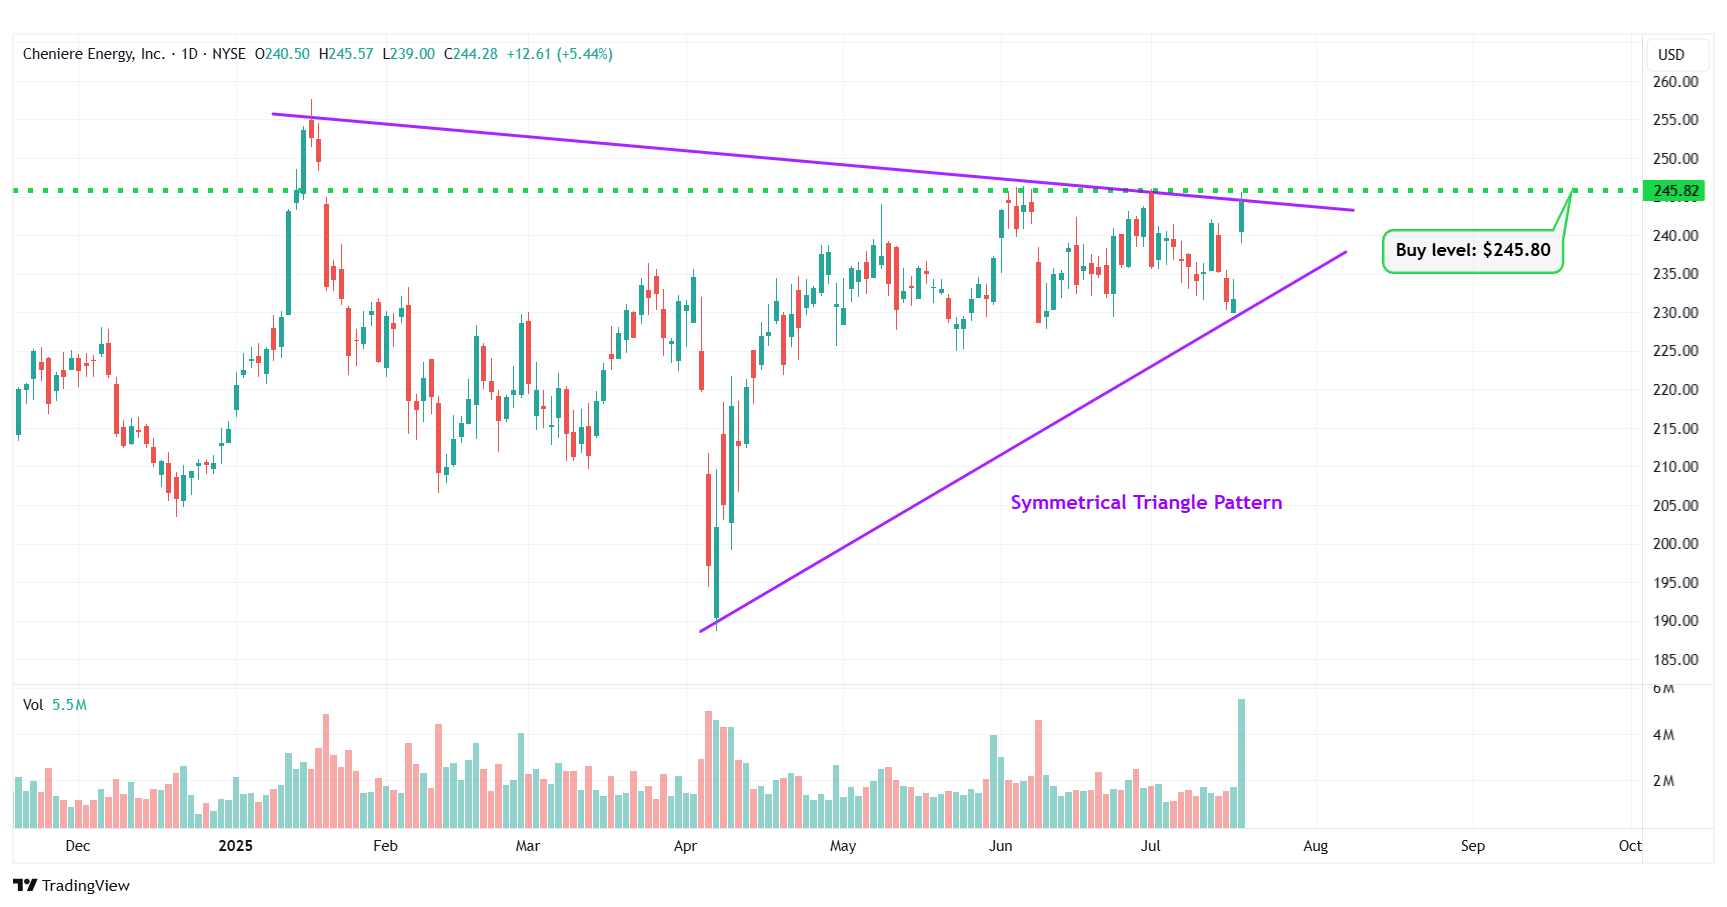
LNG – Symmetrical Triangle Pattern
#9 Regions Financial Corp (NYSE: RF)
Sector: Financial • Banks – Regional
Reason: Symmetrical Triangle Pattern Breakout
A symmetrical triangle is a chart pattern formed by two converging trend lines connecting a series of sequential peaks and troughs. These two lines result in the formation of a triangle that appears to be symmetrical.
A symmetrical triangle pattern is usually formed when there is indecision in the price movements and there is uncertainty among the buyers and sellers. This chart pattern represents a period of consolidation before the price breaks out or breaks down. In case a breakout occurs from the upper trend line, it is a strong bullish indication as it signifies the start of a new bullish trend.
Buy Level(s): The stock has currently broken out of a symmetrical triangle pattern. However, the ideal buy level for RF is if the stock closes above the immediate resistance level of $26.40. This is marked in the chart below as a green color dotted line.
Daily chart – RF
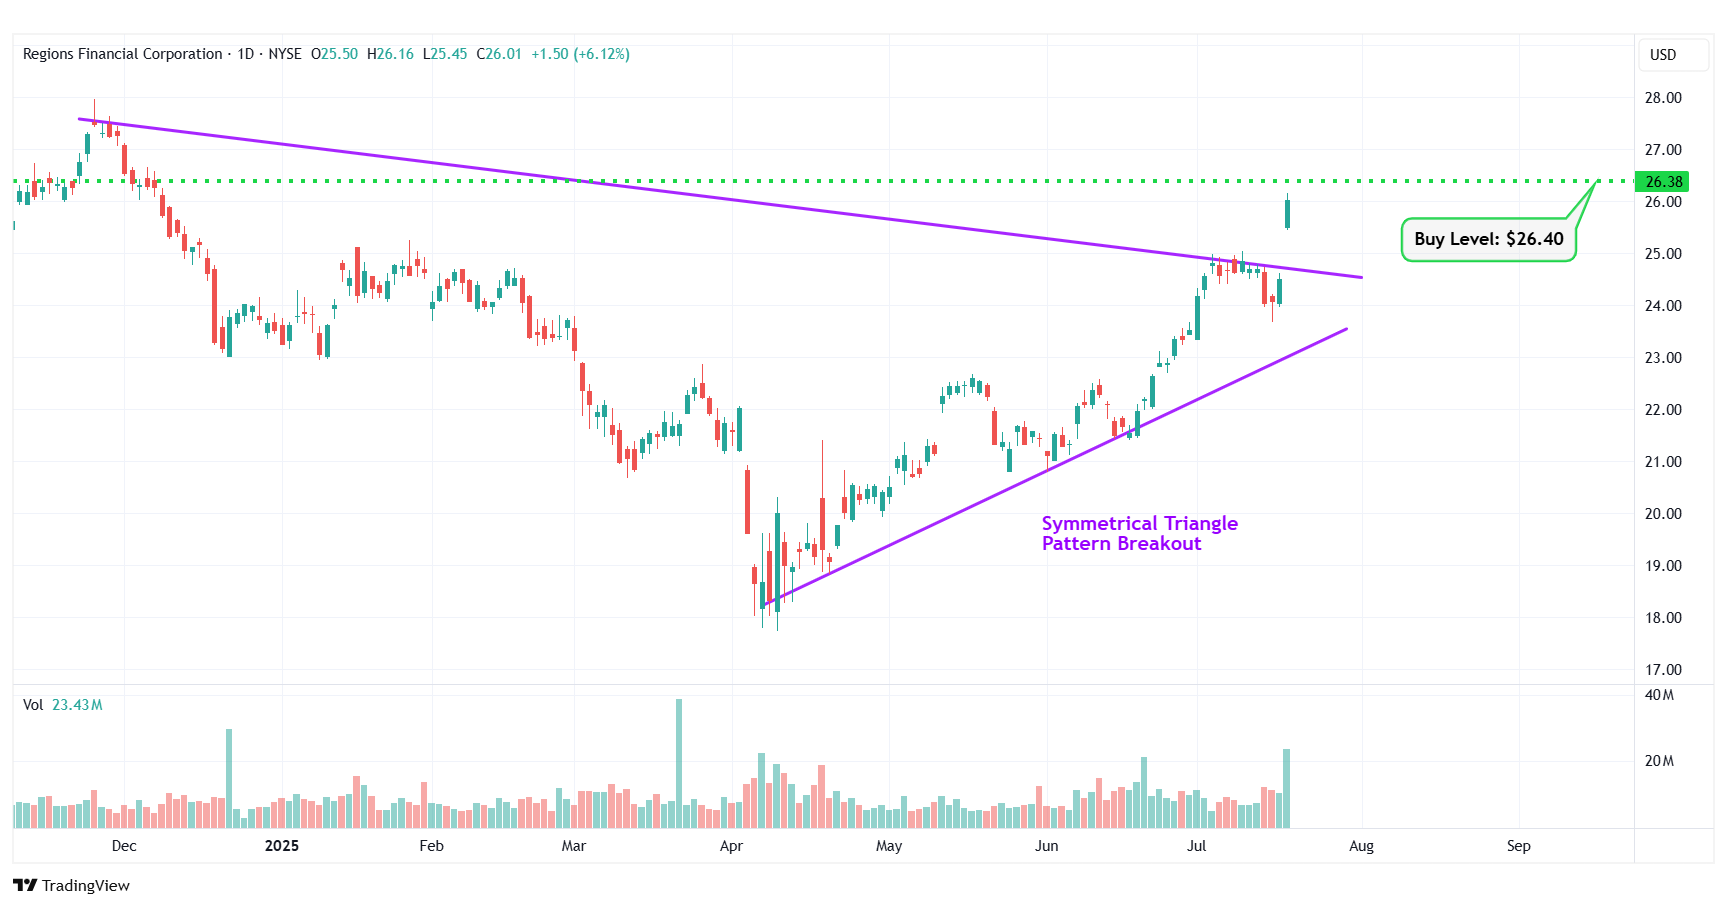
RF – Symmetrical Triangle Pattern Breakout
#10 IonQ Inc. (NYSE: IONQ)
Sector: Technology • Computer Hardware
Reason: Formation of a Symmetrical Triangle Pattern
A symmetrical triangle is a chart pattern formed by two converging trend lines connecting a series of sequential peaks and troughs. These two lines result in the formation of a triangle that appears to be symmetrical.
A symmetrical triangle pattern is usually formed when there is indecision in the price movements and there is uncertainty among the buyers and sellers. This chart pattern represents a period of consolidation before the price breaks out or breaks down. In case a breakout occurs from the upper trend line, it is a strong bullish indication as it signifies the start of a new bullish trend.
Buy Level(s): The ideal buy level for IONQ is if the stock has a daily close above the breakout level of the symmetrical triangle pattern, at around $48.20. This is marked in the chart below as a green color dotted line.
Daily chart – IONQ
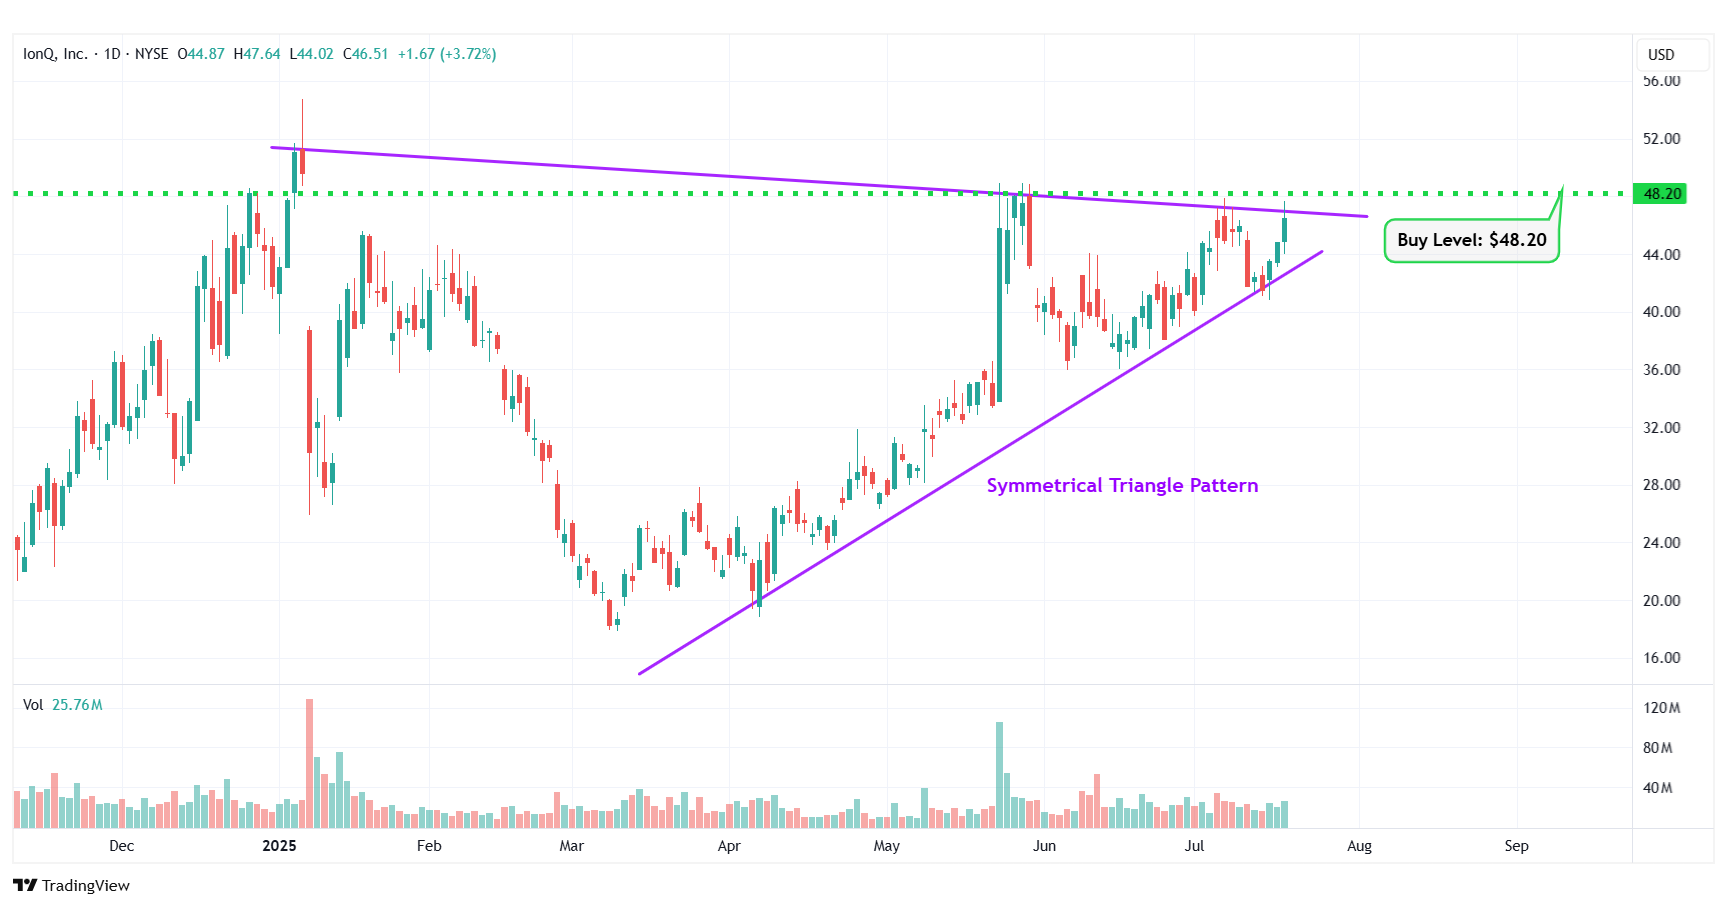
IONQ – Symmetrical Triangle Pattern
Happy Trading!
Trades of The Day Research Team
Top Stock Expert Who Called Nvidia at Less Than a Dollar Says... "$1,000 in Each of These Stocks Could Make You a Millionaire" By 2030.
Source: Trades of the Day
