We recently started a series called “Penny Stock of the Day”. These ideas are geared towards traders with an extremely high risk appetite.
Our Penny Stock of the Day is chosen by screening for stocks under $5 and then applying technical analysis on the shortlisted set of penny stocks showing unusual volume. When making these trades, please make sure to pay vigilant attention to pricing moves and have a strict stop loss in place to avoid significant losses.

Penny Stock of the Day: fuboTV Inc. (NYSE: FUBO)
Today’s penny stock pick is the operator of streaming platform, fuboTV Inc. (NYSE: FUBO).
fuboTV Inc. operates a live TV streaming platform for live sports, news, and entertainment content in the United States and internationally. Its fuboTV platform allows customers to access content through streaming devices, as well as on SmartTVs, computers, mobile phones, and tablets.
Website: https://www.fubo.tv
Latest 10-k report: https://d18rn0p25nwr6d.cloudfront.net/CIK-0001484769/2d574a19-e12f-4aa2-b8e1-93f83a4cc954.pdf
Analyst Consensus: As per TipRanks Analytics, based on 6 Wall Street analysts offering 12-month price targets for FUBO in the last 3 months, the stock has an average price target of $3.34.

Analysts | Source: TipRanks.com
Potential Catalysts / Reasons for the Hype:
- The company’s management is focusing on reducing content costs, which could improve margins if executed effectively.
- FUBO’s merger with parts of Hulu’s assets is seen as a potential catalyst. The Hulu merger’s six-month mark (July 6, 2025) is a key date to watch for regulatory updates or progress reports. Approval or positive developments could act as a catalyst.
- Rumors that fuboTV may be approaching cash flow positivity, which could stabilize its financial position.
On analyzing the company’s stock charts, there seem to be multiple bullish indications…
Bullish Indications
#1 Symmetrical Triangle Pattern Breakout: The daily chart shows that the stock has currently broken out a symmetrical triangle pattern, which is marked as purple lines. A symmetrical triangle pattern represents a period of consolidation before the price breaks out. This is typically formed when there is indecision in the price movements and uncertainty among the buyers and sellers. Once a breakout from the upper trend line occurs, it usually signifies the start of a new bullish trend.

FUBO – Daily Chart
#2 Bullish ADX and DI: The ADX indicator shows bullishness as the +DI line is above the -DI line, and the ADX line is currently moving higher from below the +DI and -DI lines.
#3 Price above MAs: The stock is currently above its 50-day as well as 200-day SMA, indicating that the bulls have currently gained control.
#4 MACD above Signal Line: In the daily chart, the MACD (light blue color) is currently above the MACD signal line (orange color). This indicates a possible bullish setup.
#5 Above Support Area: The weekly chart shows that the stock is currently trading above a support area, which is marked as a pink dotted line. This looks like a good area for the stock to move higher. The stock is also trading above its 50-week SMA, indicating that the bulls are gaining control.

FUBO – Weekly Chart
#6 Bullish Stoch: The %K line is above the %D line of the stochastic in the weekly chart, indicating possible bullishness.
Recommended Trade (based on the charts)
Buy Levels: If you want to get in on this trade, the ideal buy level for FUBO is above the price of $4.00.
Target Prices: Our first target is $4.70. If it closes above that level, the second target price is $5.30.
Stop Loss: To limit risk, place a stop loss at $3.60. Note that the stop loss is on a closing basis.
Our target potential upside is 18% to 33%.
For a risk of $0.40, our first target reward is $0.70, and the second target reward is $1.30. This is a nearly 1:2 and 1:3 risk-reward trade.
In other words, this trade offers 2x to 3x more potential upside than downside.
Potential Risks / Red Flags:
- The company has a history of net losses.
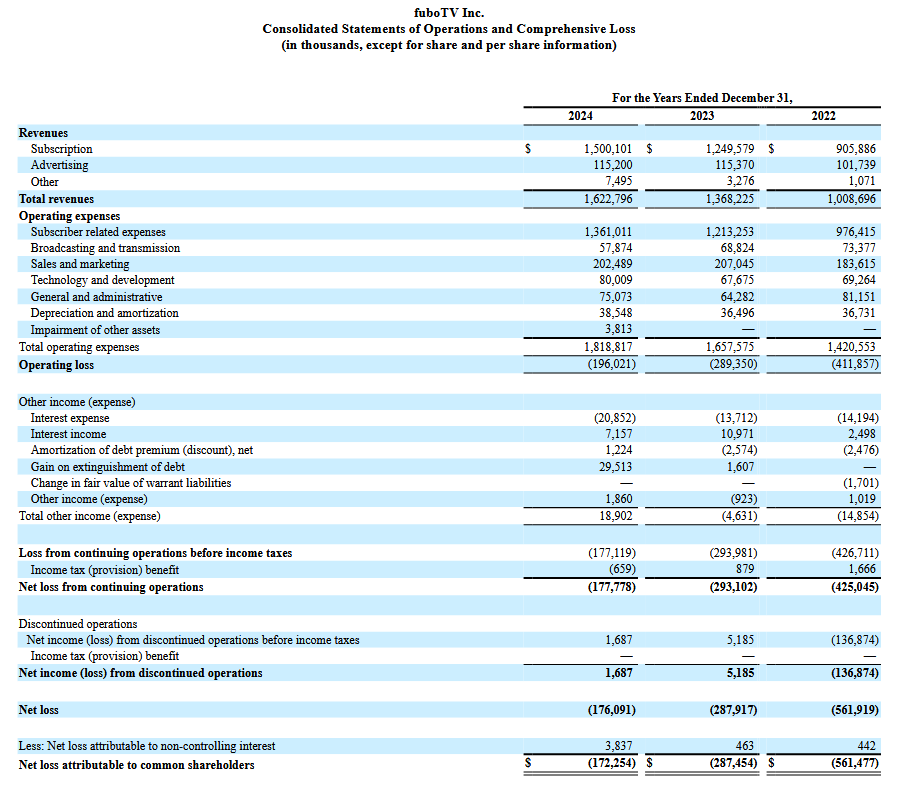
FUBO – Consolidated Statements of Operations
- FUBO’s significant headwinds include subscriber losses and declining ad revenue. The company’s core business model is under strain, with limited international presence and weak growth catalysts.
- The company has ongoing legal proceedings like DISH Technologies, LLC, et al. v. fuboTV Media Inc., No. 1:23-cv-00986 (D. Del.); FuboTV Inc. and FuboTV Media Inc. vs. The Walt Disney Company, ESPN, Inc., ESPN Enterprises, Inc., Hulu, LLC, Fox Corporation, and Warner Brothers Discovery, Inc; and Video Privacy Protection Act Matters.
- Hedge Funds Decreased Holdings by K Shares Last Quarter.

Hedge Funds | Source: TipRanks.com
- The streaming industry is highly competitive, with giants like Netflix, Hulu, and Disney+ dominating market share. fuboTV’s niche focus on sports streaming faces pressure from competitors with broader content offerings and deeper pockets.
- Despite being a loss-making company, the executives are being paid significant compensation.

FUBO – Executive Compensation
As you can see, today’s featured penny stock offers big upside potential… but it also comes with a number of risks and red flags. As always, when dealing with penny stocks, we advise caution before entering into such high-risk ventures. Remember to think before you trade… understand the risks… and if you decide to trade, stick to your stop-losses!
Happy Trading!
Trades of the Day Research Team
READ BEFORE TRADING PENNY STOCKS: The allure of penny stocks lies in their potential to deliver massive gains in a short period of time. However, in exchange for that opportunity, most penny stocks carry tremendous risk. They can be extremely volatile and are susceptible to “pump and dump” schemes and fraud.
Unlike regular stocks, the financial condition of most penny stock companies can be extremely difficult to analyze, as the majority of such stocks are traded on over-the-counter (OTC) exchanges, which are typically less transparent and less regulated than the major exchanges. In fact, in the penny stock space, it’s often easier to spot warning signs and red flags than it is to identify a sound investment. Nevertheless, we do our best to identify short-term trade opportunities in this exciting space because we know some of our readers are looking for high-risk, high-reward ideas. We just urge you to make sure you fully understand the risks before making any of these trades.
The Original Magnificent Seven Produced 16,894% Average Returns Over 20 Years. But the Man Who Called Nvidia at $1.10 Says "AI's Next Magnificent Seven Could Do It Even Faster." See His Breakdown of the Seven Stocks You Should Own Here.
Source: Trades of the Day
