
Picking a winning trade on a consistent basis is not simply a stroke of luck. It’s the result of calculated screening, planning, and deliberation.
With this in mind, we have started a new weekly series on our top 10 stocks to watch this week — stocks that look poised for a possible breakout in the coming days. Traders should add these stocks to their watchlist now.
The Top 10 Stocks to Watch This Week for Possible Breakouts
| Sl # | Name of the Stock | Stock Ticker | Last Close | Buy Level(s) | Reason |
| 1 | Tencent Music Entertainment Group | NYSE: TME | $14.38 | $14.70 | Symmetrical Triangle Pattern Breakout |
| 2 | Viking Therapeutics Inc. | NASDAQ: VKTX | $34.07 | $35.10 | Falling Wedge Pattern Breakout |
| 3 | Duke Energy Corp | NYSE: DUK | $115.55 | $116.80 | Symmetrical Triangle Pattern |
| 4 | Sixth Street Specialty Lending Inc. | NYSE: TSLX | $23.47 | $23.60 | Breakout From Consolidation Area |
| 5 | World Kinect Corp | NYSE: WKC | $30.73 | $31.10 | Symmetrical Triangle Pattern Breakout |
| 6 | Keurig Dr Pepper Inc. | NASDAQ: KDP | $34.04 | $34.30 | Falling Wedge Pattern Breakout |
| 7 | Mercer International Inc. | NASDAQ: MERC | $7.69 | $7.80 | Symmetrical Triangle Pattern Breakout |
| 8 | Herbalife Ltd | NYSE: HLF | $8.31 | $8.70 | Falling Wedge Pattern Breakout |
| 9 | Alliant Energy Corp. | NASDAQ: LNT | $62.18 | $64.00 | Symmetrical Triangle Pattern Breakout |
| 10 | Firstenergy Corp | NYSE: FE | $42.29 | $42.70 | Downtrend Channel Breakout |
Important: Typically, these trades offer a risk: reward ratio of 1:2 or 1:3 in the next 6 months, which implies 2x to 3x rewards when compared to risks. So, be sure to set your stop-loss levels and target prices accordingly to manage your risk. In addition, these trade ideas are triggered using daily closing prices, not intra-day pricing. So, if you participate in these trades, make sure that you only buy the stock once its daily close is above the recommended price level.
That said, here are the top 10 stocks to watch for a breakout, in no particular order.
#1 Tencent Music Entertainment Group ADR (NYSE: TME)
Sector: Communication Services • Internet Content & Information
Reason: Symmetrical Triangle Pattern Breakout
A symmetrical triangle is a chart pattern formed by two converging trend lines connecting a series of sequential peaks and troughs. These two lines result in the formation of a triangle that appears to be symmetrical.
A symmetrical triangle pattern is usually formed when there is indecision in the price movements and there is uncertainty among the buyers and sellers. This chart pattern represents a period of consolidation before the price breaks out or breaks down. In case a breakout occurs from the upper trend line, it is a strong bullish indication as it signifies the start of a new bullish trend.
Buy Level(s): The stock has currently broken out of a symmetrical triangle pattern. However, the ideal buy level for TME is if the stock closes above the immediate resistance level of $14.70. This is marked in the chart below as a green color dotted line.
Daily chart – TME
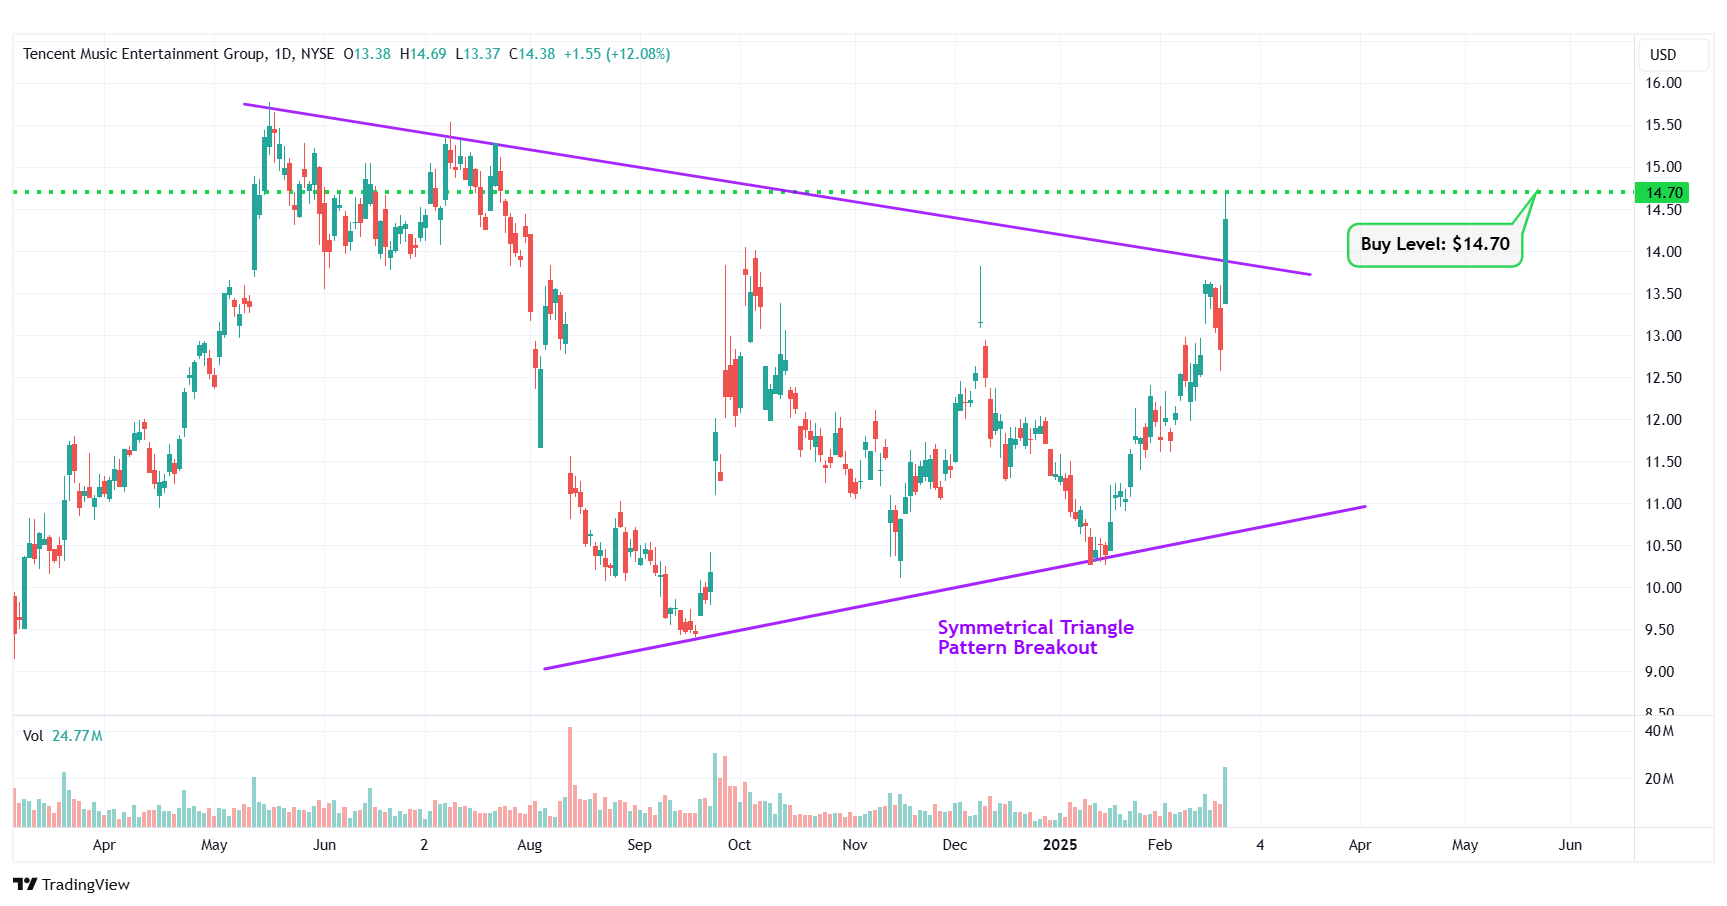
TME – Symmetrical Triangle Pattern Breakout
#2 Viking Therapeutics Inc. (NASDAQ: VKTX)
Sector: Healthcare • Biotechnology
Reason: Falling Wedge Pattern Breakout
A falling wedge pattern is formed by joining two downward-sloping, converging trendlines having a contracting range. The pattern appears to be wide at the top and continues to contract as prices fall. A breakout from a falling wedge pattern can indicate either reversal or continuation depending on where the pattern appeared in the trend.
A stock that has broken out of a falling wedge pattern would have gained momentum and would have the potential to move higher.
Buy Level(s): The stock has currently broken out of a falling wedge pattern. However, the ideal buy level for VKTX is above the nearest resistance level of $35.10. This is marked in the chart below as a green color dotted line.
Daily chart – VKTX
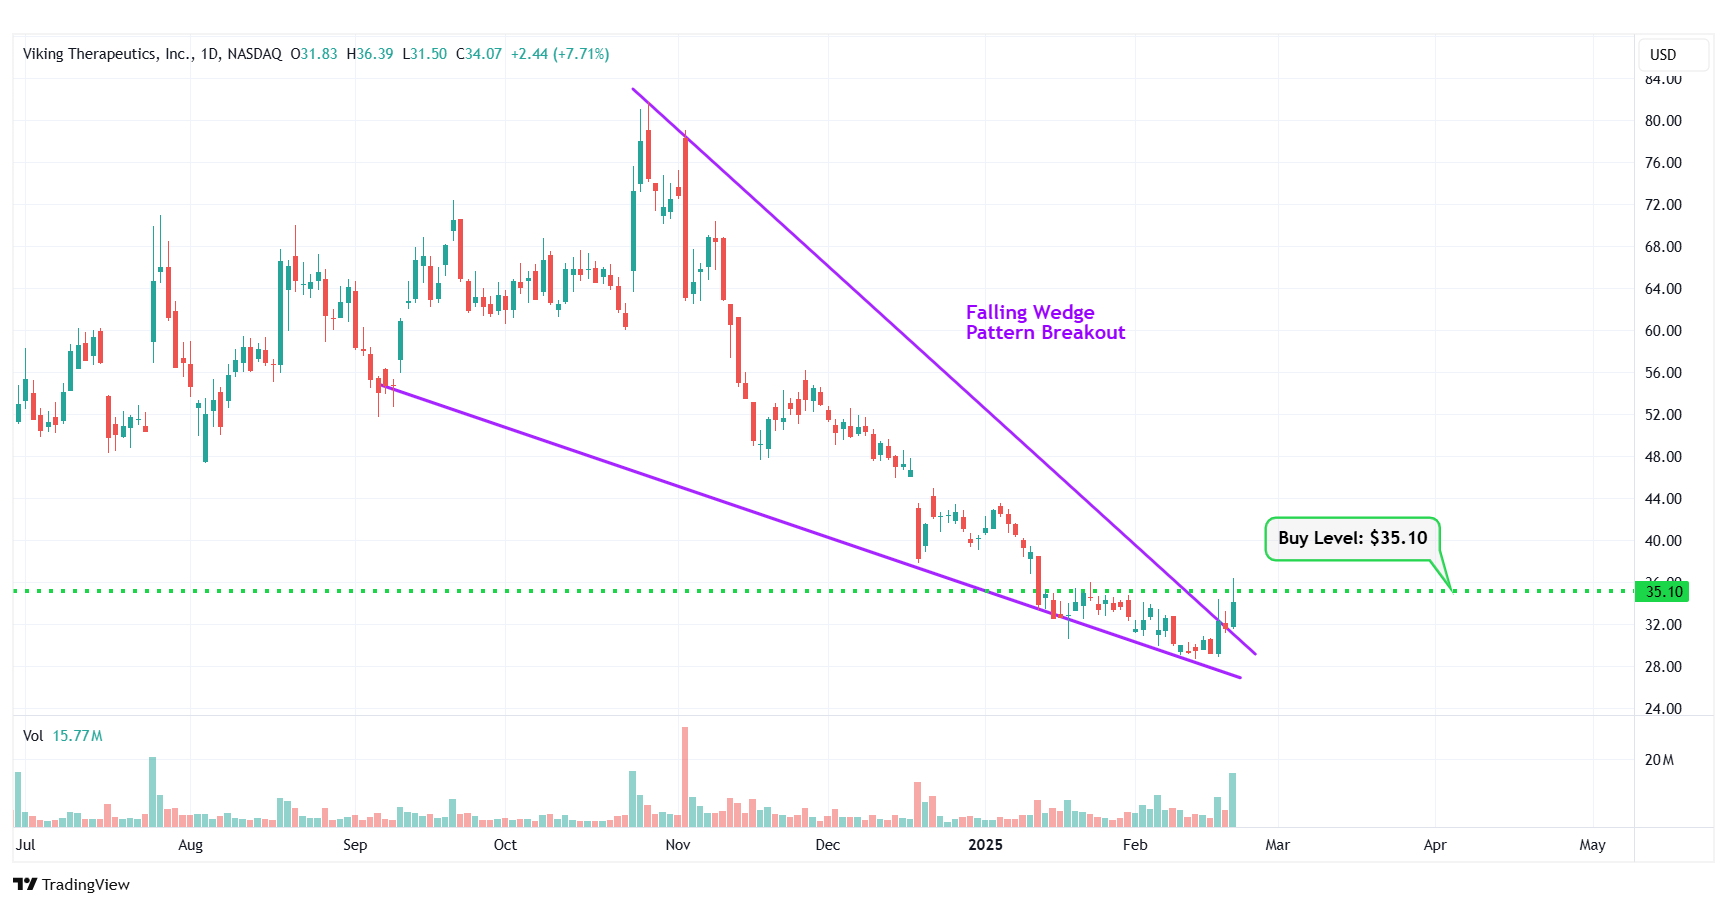
VKTX – Falling Wedge Pattern Breakout
#3 Duke Energy Corp (NYSE: DUK)
Sector: Utilities • Utilities – Regulated Electric
Reason: Formation of a Symmetrical Triangle Pattern
A symmetrical triangle is a chart pattern formed by two converging trend lines connecting a series of sequential peaks and troughs. These two lines result in the formation of a triangle that appears to be symmetrical.
A symmetrical triangle pattern is usually formed when there is indecision in the price movements and there is uncertainty among the buyers and sellers. This chart pattern represents a period of consolidation before the price breaks out or breaks down. In case a breakout occurs from the upper trend line, it is a strong bullish indication as it signifies the start of a new bullish trend.
Buy Level(s): The ideal buy level for DUK is if the stock has a daily close above the breakout level of the symmetrical triangle pattern, at around $116.80. This is marked in the chart below as a green color dotted line.
Daily chart – DUK
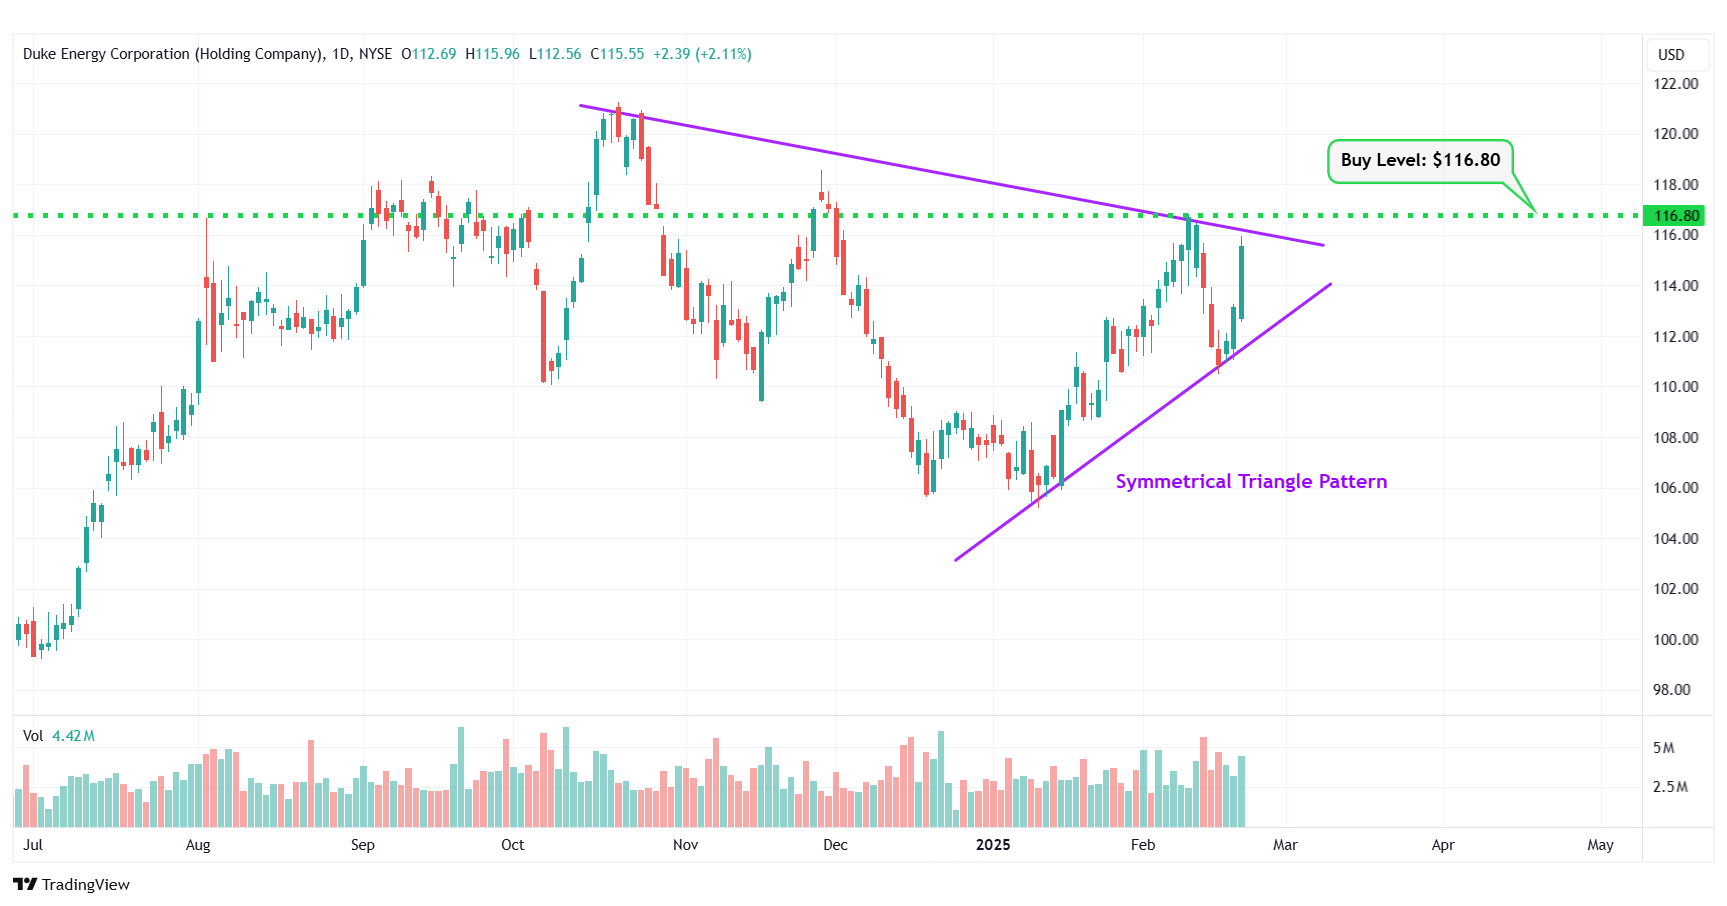
DUK – Symmetrical Triangle Pattern
#4 Sixth Street Specialty Lending Inc. (NYSE: TSLX)
Sector: Financial • Asset Management
Reason: Breakout From a Consolidation Area in the Daily Chart
A Consolidation Area is a price action contained between two parallel lines. It is formed by a lower line that connects the lows, and an upper line that joins the highs. A stock usually trades between the two lines of the consolidation area before finally breaking out from the upper rail.
Buy Level(s): Although the stock has currently broken out of a consolidation area, the ideal buy level for TSLX is above the near-term resistance area, which translates to a price of around $23.60. This is marked in the chart below as a green color dotted line.
Daily chart – TSLX
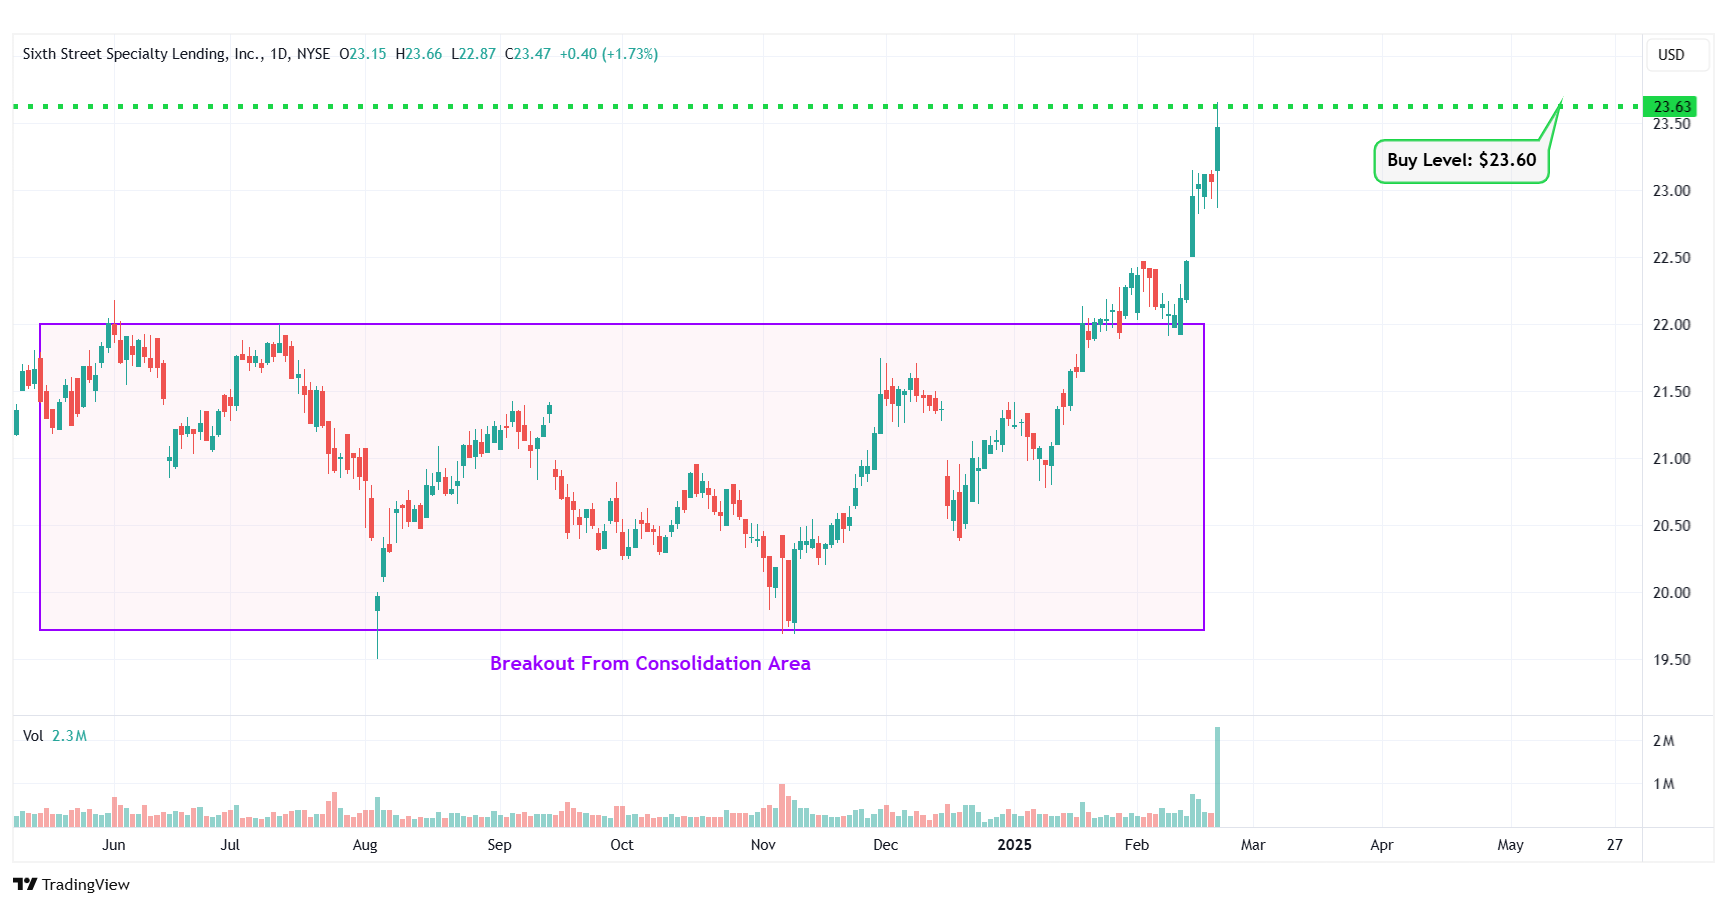
TSLX – Breakout From Consolidation Area
#5 World Kinect Corp (NYSE: WKC)
Sector: Energy • Oil & Gas Refining & Marketing
Reason: Symmetrical Triangle Pattern Breakout
A symmetrical triangle is a chart pattern formed by two converging trend lines connecting a series of sequential peaks and troughs. These two lines result in the formation of a triangle that appears to be symmetrical.
A symmetrical triangle pattern is usually formed when there is indecision in the price movements and there is uncertainty among the buyers and sellers. This chart pattern represents a period of consolidation before the price breaks out or breaks down. In case a breakout occurs from the upper trend line, it is a strong bullish indication as it signifies the start of a new bullish trend.
Buy Level(s): The stock has currently broken out of a symmetrical triangle pattern. However, the ideal buy level for WKC is if the stock closes above the immediate resistance level of $31.10. This is marked in the chart below as a green color dotted line.
Daily chart – WKC
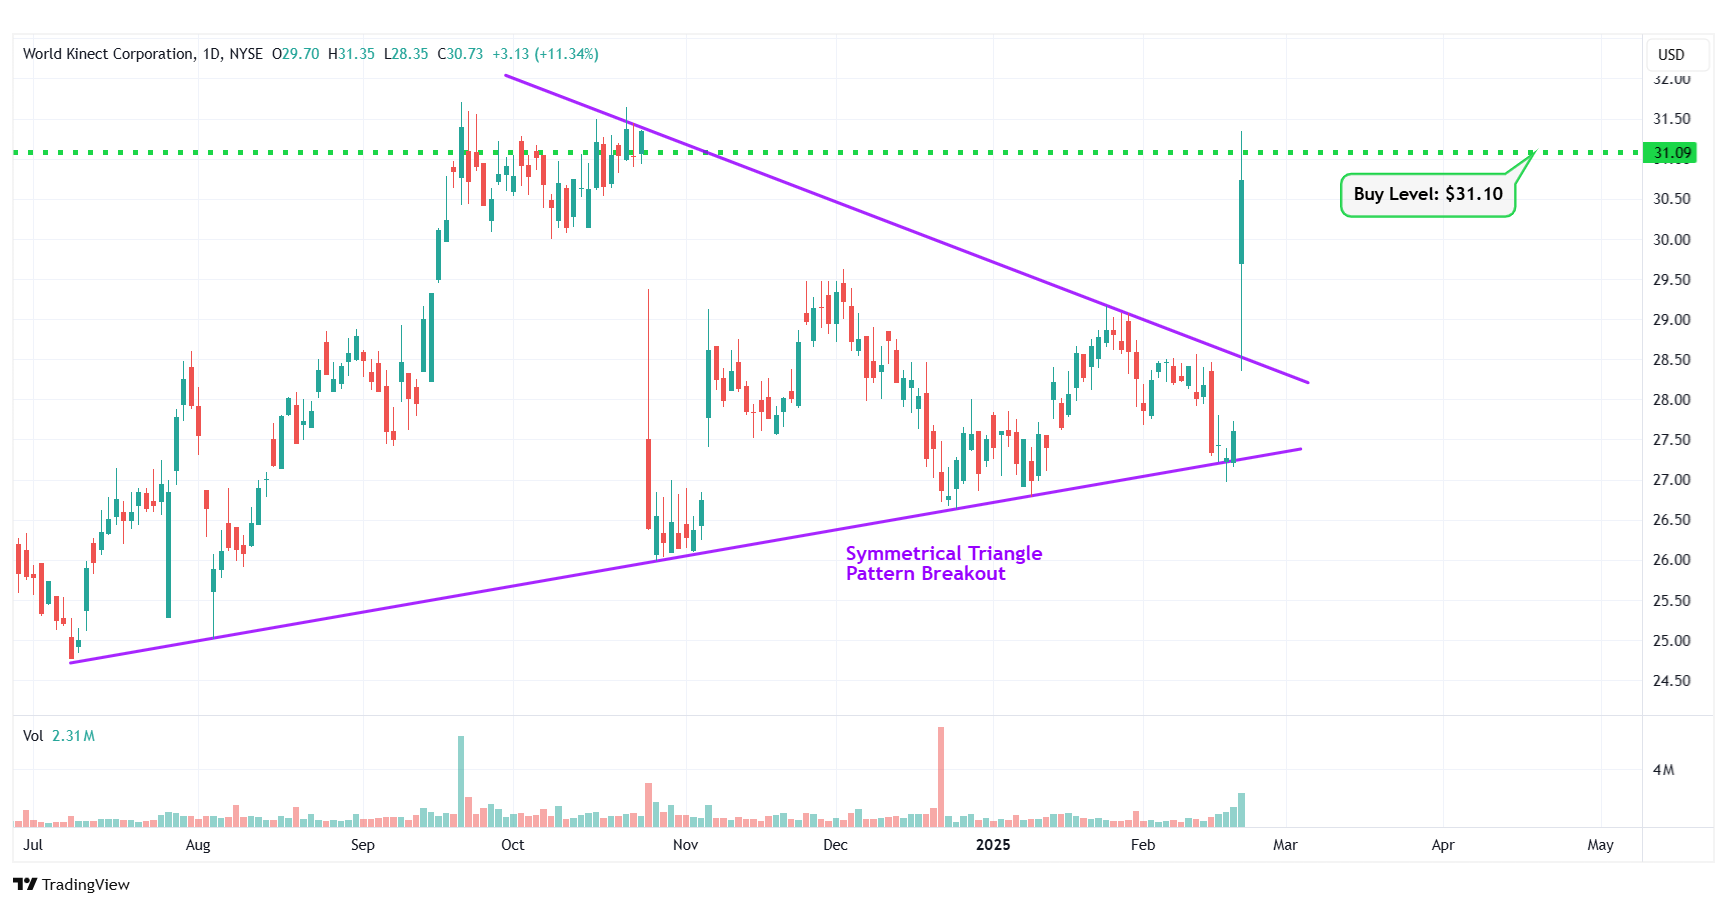
WKC – Symmetrical Triangle Pattern Breakout
#6 Keurig Dr Pepper Inc. (NASDAQ: KDP)
Sector: Consumer Defensive • Beverages – Non-Alcoholic
Reason: Falling Wedge Pattern Breakout
A falling wedge pattern is formed by joining two downward-sloping, converging trendlines having a contracting range. The pattern appears to be wide at the top and continues to contract as prices fall. A breakout from a falling wedge pattern can indicate either reversal or continuation depending on where the pattern appeared in the trend.
A stock that has broken out of a falling wedge pattern would have gained momentum and would have the potential to move higher.
Buy Level(s): The stock has currently broken out of a falling wedge pattern. However, the ideal buy level for KDP is above the nearest resistance level of $34.30. This is marked in the chart below as a green color dotted line.
Daily chart – KDP
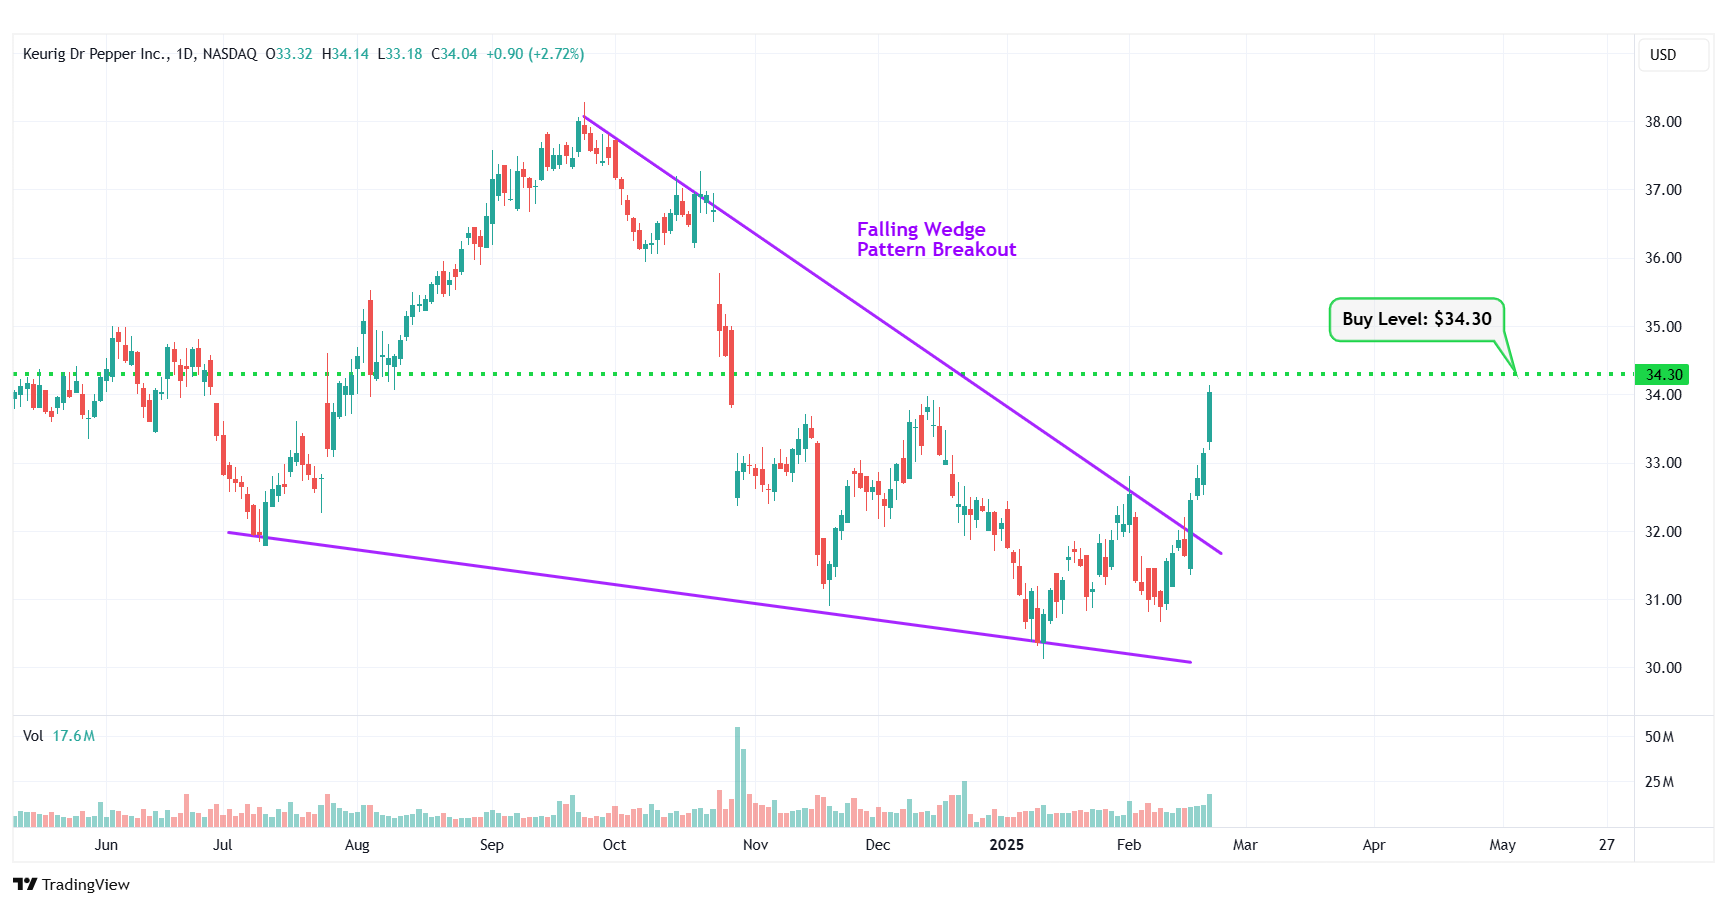
KDP – Falling Wedge Pattern Breakout
#7 Mercer International Inc. (NASDAQ: MERC)
Sector: Basic Materials • Paper & Paper Products
Reason: Symmetrical Triangle Pattern Breakout
A symmetrical triangle is a chart pattern formed by two converging trend lines connecting a series of sequential peaks and troughs. These two lines result in the formation of a triangle that appears to be symmetrical.
A symmetrical triangle pattern is usually formed when there is indecision in the price movements and there is uncertainty among the buyers and sellers. This chart pattern represents a period of consolidation before the price breaks out or breaks down. In case a breakout occurs from the upper trend line, it is a strong bullish indication as it signifies the start of a new bullish trend.
Buy Level(s): The stock has currently broken out of a symmetrical triangle pattern. However, the ideal buy level for MERC is if the stock closes above the immediate resistance level of $7.80. This is marked in the chart below as a green color dotted line.
Daily chart – MERC
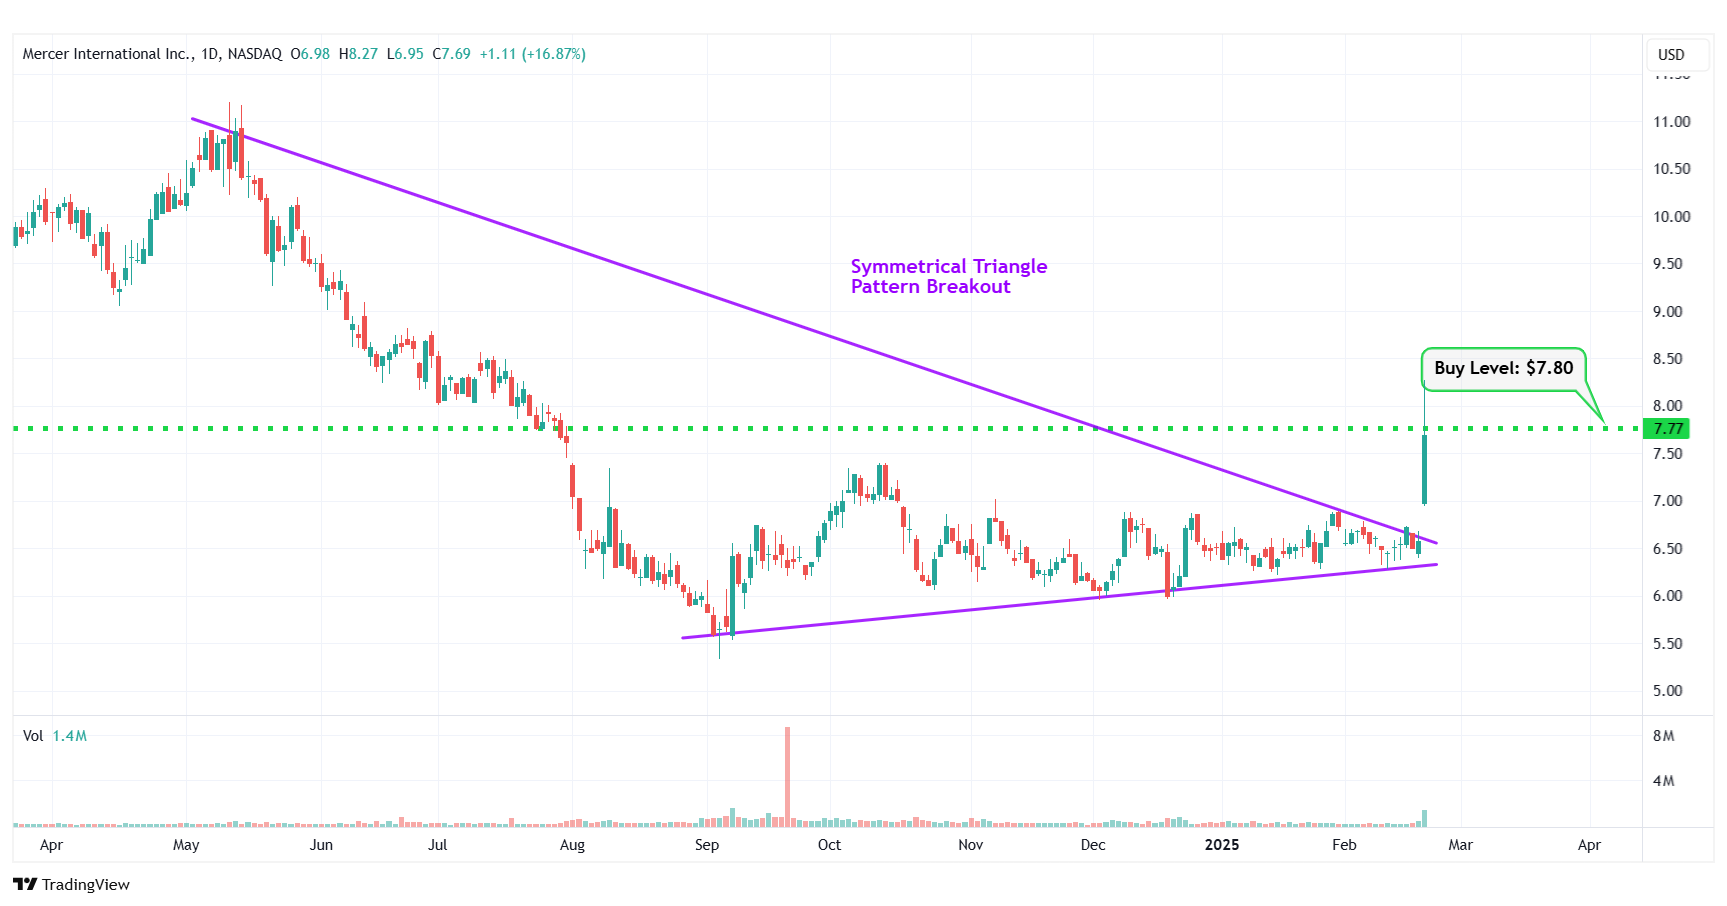
MERC – Symmetrical Triangle Pattern Breakout
#8 Herbalife Ltd (NYSE: HLF)
Sector: Consumer Defensive • Packaged Foods
Reason: Falling Wedge Pattern Breakout
A falling wedge pattern is formed by joining two downward-sloping, converging trendlines having a contracting range. The pattern appears to be wide at the top and continues to contract as prices fall. A breakout from a falling wedge pattern can indicate either reversal or continuation depending on where the pattern appeared in the trend.
A stock that has broken out of a falling wedge pattern would have gained momentum and would have the potential to move higher.
Buy Level(s): The stock has currently broken out of a falling wedge pattern. However, the ideal buy level for HLF is above the nearest resistance level of $8.70. This is marked in the chart below as a green color dotted line.
Daily chart – HLF
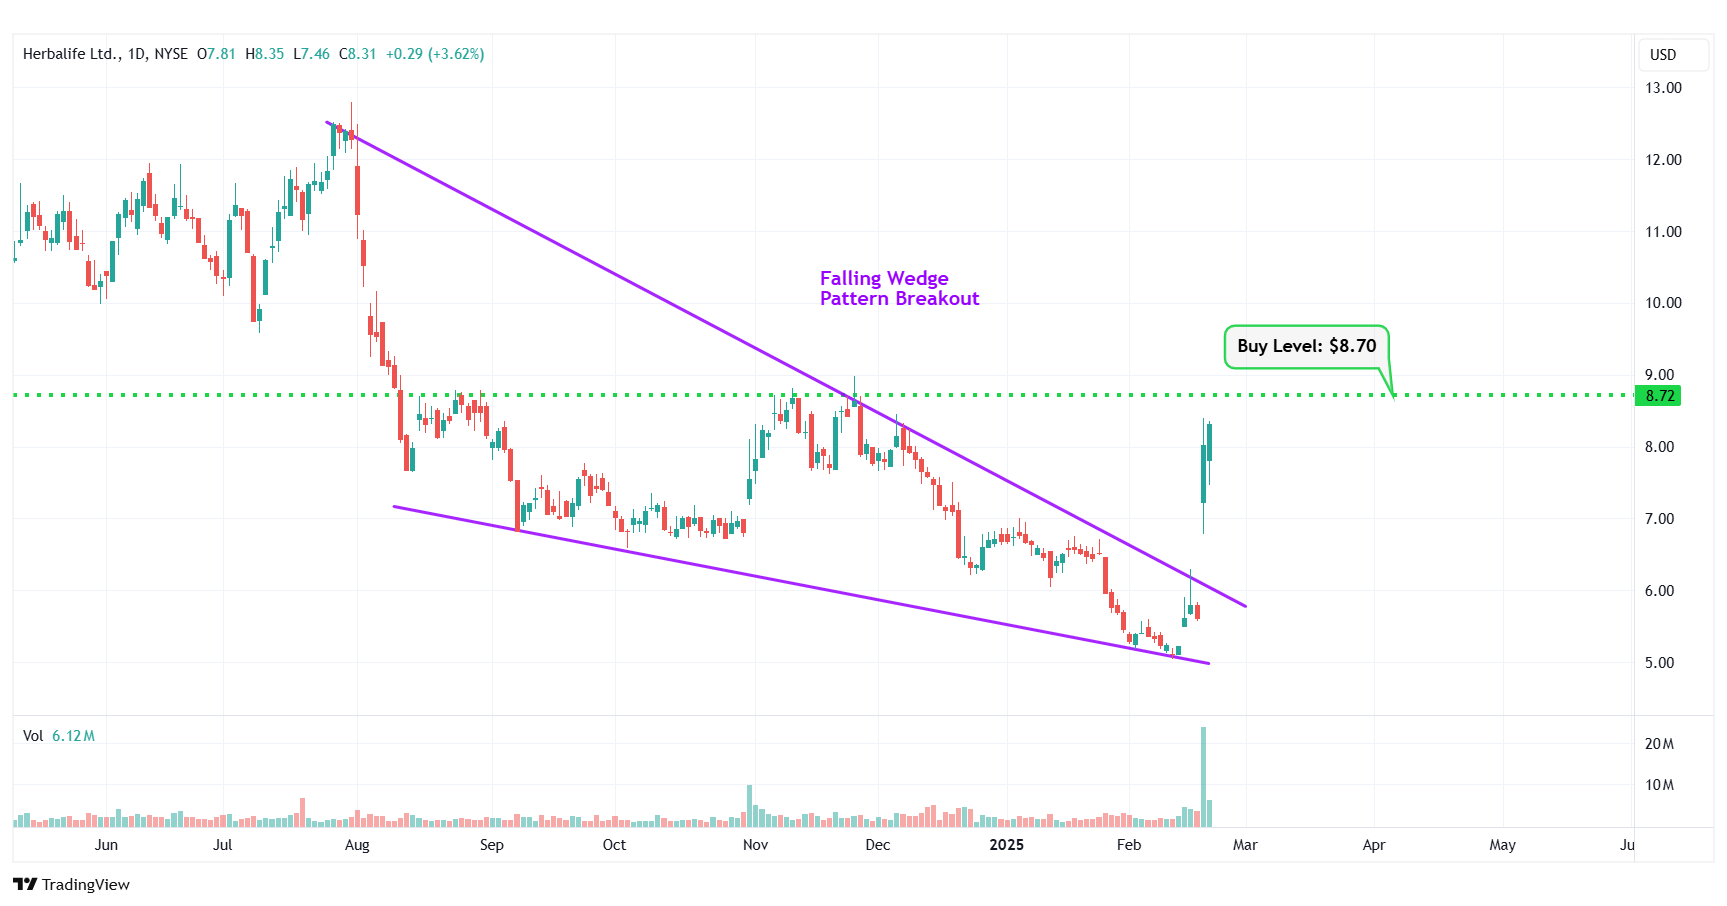
HLF – Falling Wedge Pattern Breakout
#9 Alliant Energy Corp. (NASDAQ: LNT)
Sector: Utilities • Utilities – Regulated Electric
Reason: Symmetrical Triangle Pattern Breakout
A symmetrical triangle is a chart pattern formed by two converging trend lines connecting a series of sequential peaks and troughs. These two lines result in the formation of a triangle that appears to be symmetrical.
A symmetrical triangle pattern is usually formed when there is indecision in the price movements and there is uncertainty among the buyers and sellers. This chart pattern represents a period of consolidation before the price breaks out or breaks down. In case a breakout occurs from the upper trend line, it is a strong bullish indication as it signifies the start of a new bullish trend.
Buy Level(s): The stock has currently broken out of a symmetrical triangle pattern. However, the ideal buy level for LNT is if the stock closes above the immediate resistance level of $64.00. This is marked in the chart below as a green color dotted line.
Daily chart – LNT
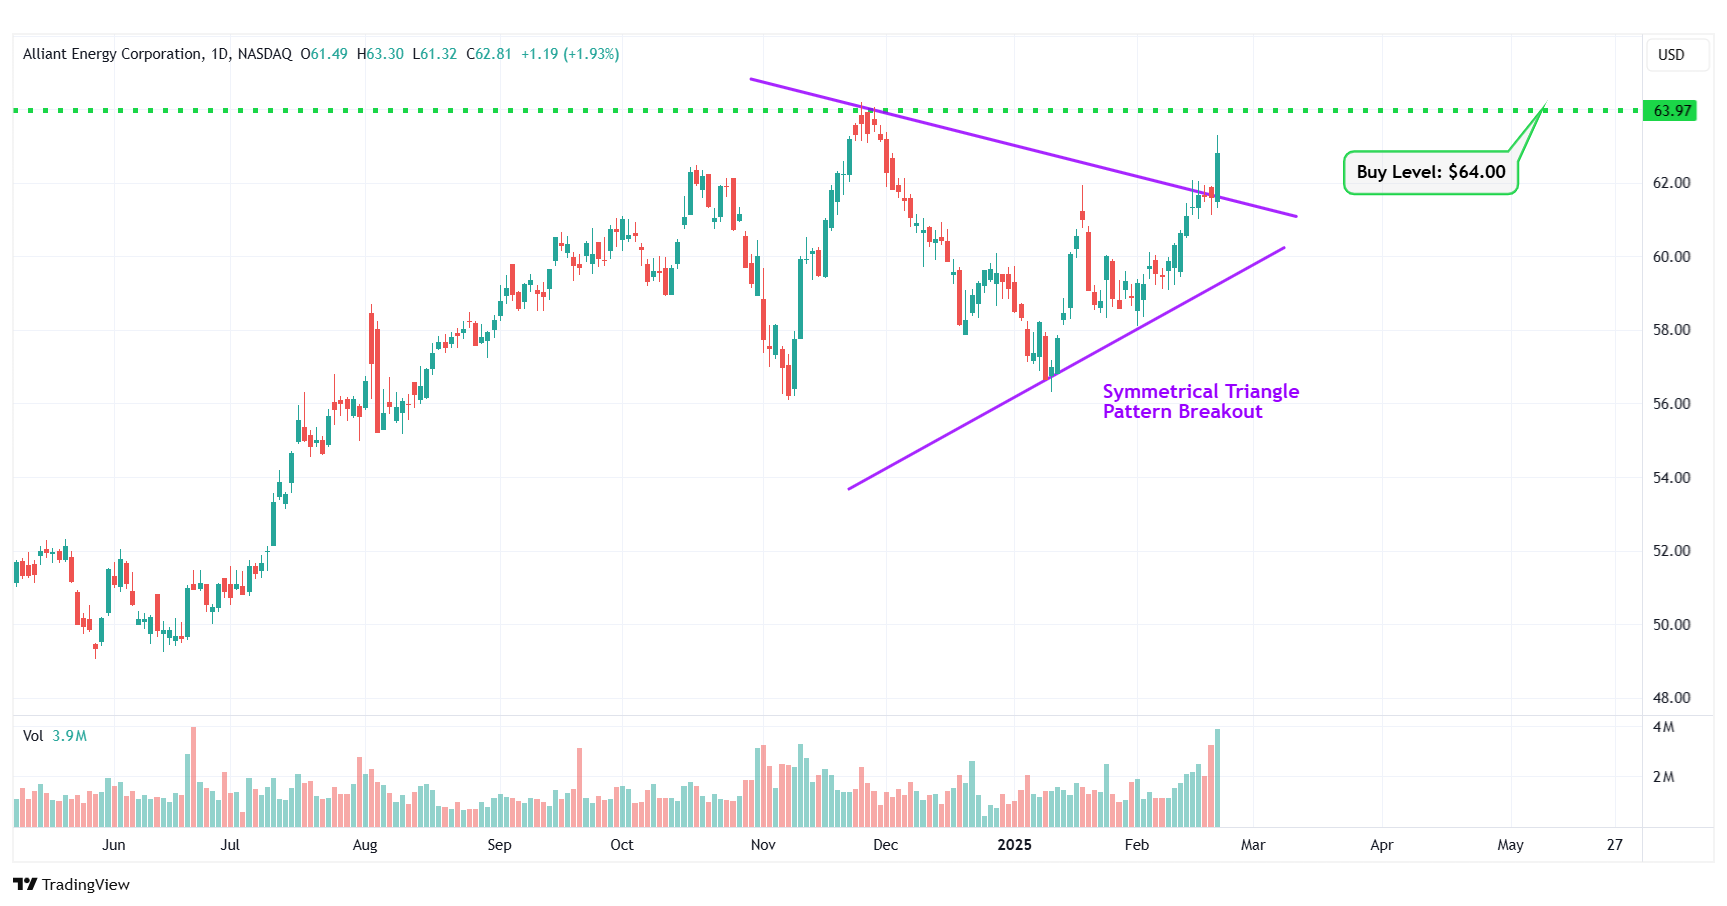
LNT – Symmetrical Triangle Pattern Breakout
#10 Firstenergy Corp (NYSE: FE)
Sector: Utilities • Utilities – Regulated Electric
Reason: Downtrend Channel Breakout
A downtrend or descending channel is the price action contained between downward sloping parallel lines. It is formed by two lines that are drawn by connecting the lower highs and lower lows of a stock’s price. Even though this is typically a bearish pattern, a breakout from the upper rail of this pattern is considered a good bullish indication.
Buy Level(s): The daily chart shows that the stock has currently broken out of a downtrend channel. However, there is a near-term resistance level for the stock. Hence, the ideal buy level for FE is if the stock has a daily close above $42.70. This is marked in the chart below as a green color dotted line.
Daily chart – FE
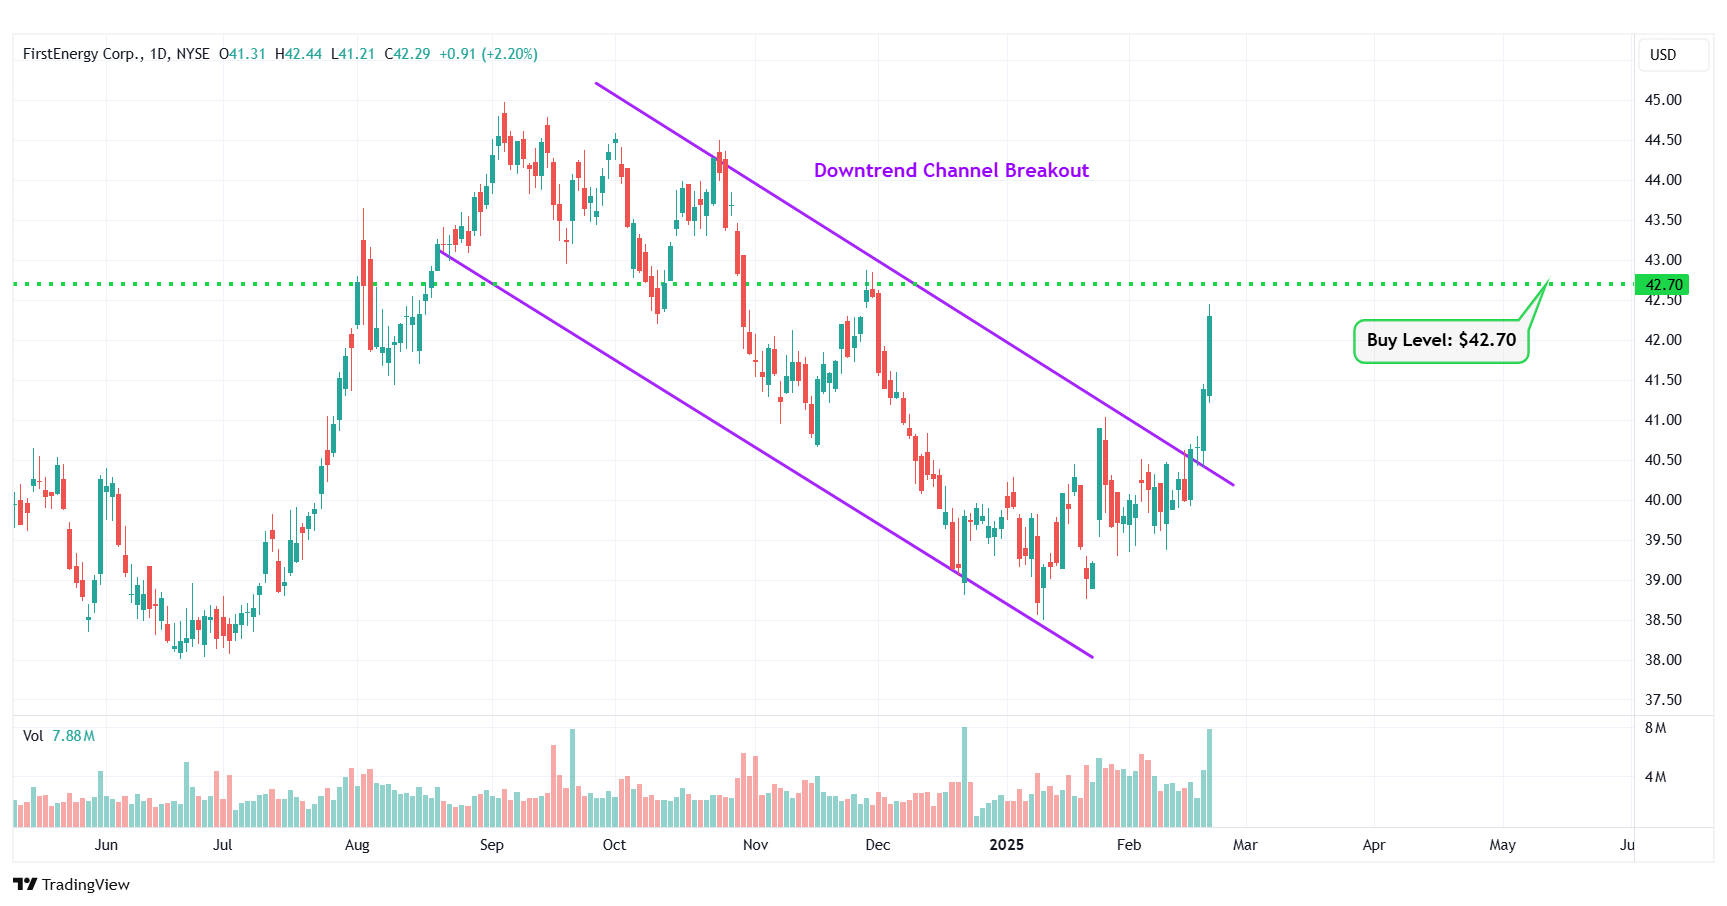
FE – Downtrend Channel Breakout
Happy Trading!
Trades of The Day Research Team
The company manufacturing Nvidia's AI servers trades under a secret name. AI revenue: $30B this year. Stock price: $8. Click for the hidden identity →
Source: Trades of the Day
