Picking a winning trade on a consistent basis is not simply a stroke of luck. It’s the result of calculated screening, planning, and deliberation.
With this in mind, we have started a new weekly series on our top 10 stocks to watch this week — stocks that look poised for a possible breakout in the coming days. Traders should add these stocks to their watchlist now.

The Top 10 Stocks to Watch This Week for Possible Breakouts
| Sl # | Name of the Stock | Stock Ticker | Last Close | Buy Level(s) | Reason |
| 1 | National Vision Holdings Inc. | NASDAQ: EYE | $12.43 | $12.80 | Symmetrical Triangle Pattern Breakout |
| 2 | Fortis Inc. | NYSE: FTS | $44.88 | $45.30 | Downtrend Channel Breakout |
| 3 | DraftKings Inc. | NASDAQ: DKNG | $53.49 | $54.00 | Uptrend Channel Breakout |
| 4 | Udemy Inc. | NASDAQ: UDMY | $10.01 | $10.20 | Symmetrical Triangle Pattern Breakout |
| 5 | Wynn Resorts Ltd | NASDAQ: WYNN | $88.82 | $90.00 | Falling Wedge Pattern Breakout |
| 6 | Procore Technologies Inc. | NYSE: PCOR | $87.50 | $88.80 | Flag Pattern Breakout |
| 7 | Kenvue Inc. | NYSE: KVUE | $21.93 | $22.20 | Falling Wedge Pattern Breakout |
| 8 | Applied Digital Corporation | NASDAQ: APLD | $9.11 | $9.40 | Symmetrical Triangle Pattern |
| 9 | CRISPR Therapeutics AG | NASDAQ: CRSP | $49.72 | $51.10 | Downtrend Channel |
| 10 | Recursion Pharmaceuticals Inc. | NASDAQ: RXRX | $10.53 | $10.80 | Symmetrical Triangle Pattern Breakout |
Important: Typically, these trades offer a risk: reward ratio of 1:2 or 1:3 in the next 6 months, which implies 2x to 3x rewards when compared to risks. So, be sure to set your stop-loss levels and target prices accordingly to manage your risk. In addition, these trade ideas are triggered using daily closing prices, not intra-day pricing. So, if you participate in these trades, make sure that you only buy the stock once its daily close is above the recommended price level.
That said, here are the top 10 stocks to watch for a breakout, in no particular order.
#1 National Vision Holdings Inc. (NASDAQ: EYE)
Sector: Consumer Cyclical • Specialty Retail
Reason: Symmetrical Triangle Pattern Breakout
A symmetrical triangle is a chart pattern formed by two converging trend lines connecting a series of sequential peaks and troughs. These two lines result in the formation of a triangle that appears to be symmetrical.
A symmetrical triangle pattern is usually formed when there is indecision in the price movements and there is uncertainty among the buyers and sellers. This chart pattern represents a period of consolidation before the price breaks out or breaks down. In case a breakout occurs from the upper trend line, it is a strong bullish indication as it signifies the start of a new bullish trend.
Buy Level(s): The stock has currently broken out of a symmetrical triangle pattern. However, the ideal buy level for EYE is if the stock closes above the immediate resistance level of $12.80. This is marked in the chart below as a green color dotted line.
Daily chart – EYE
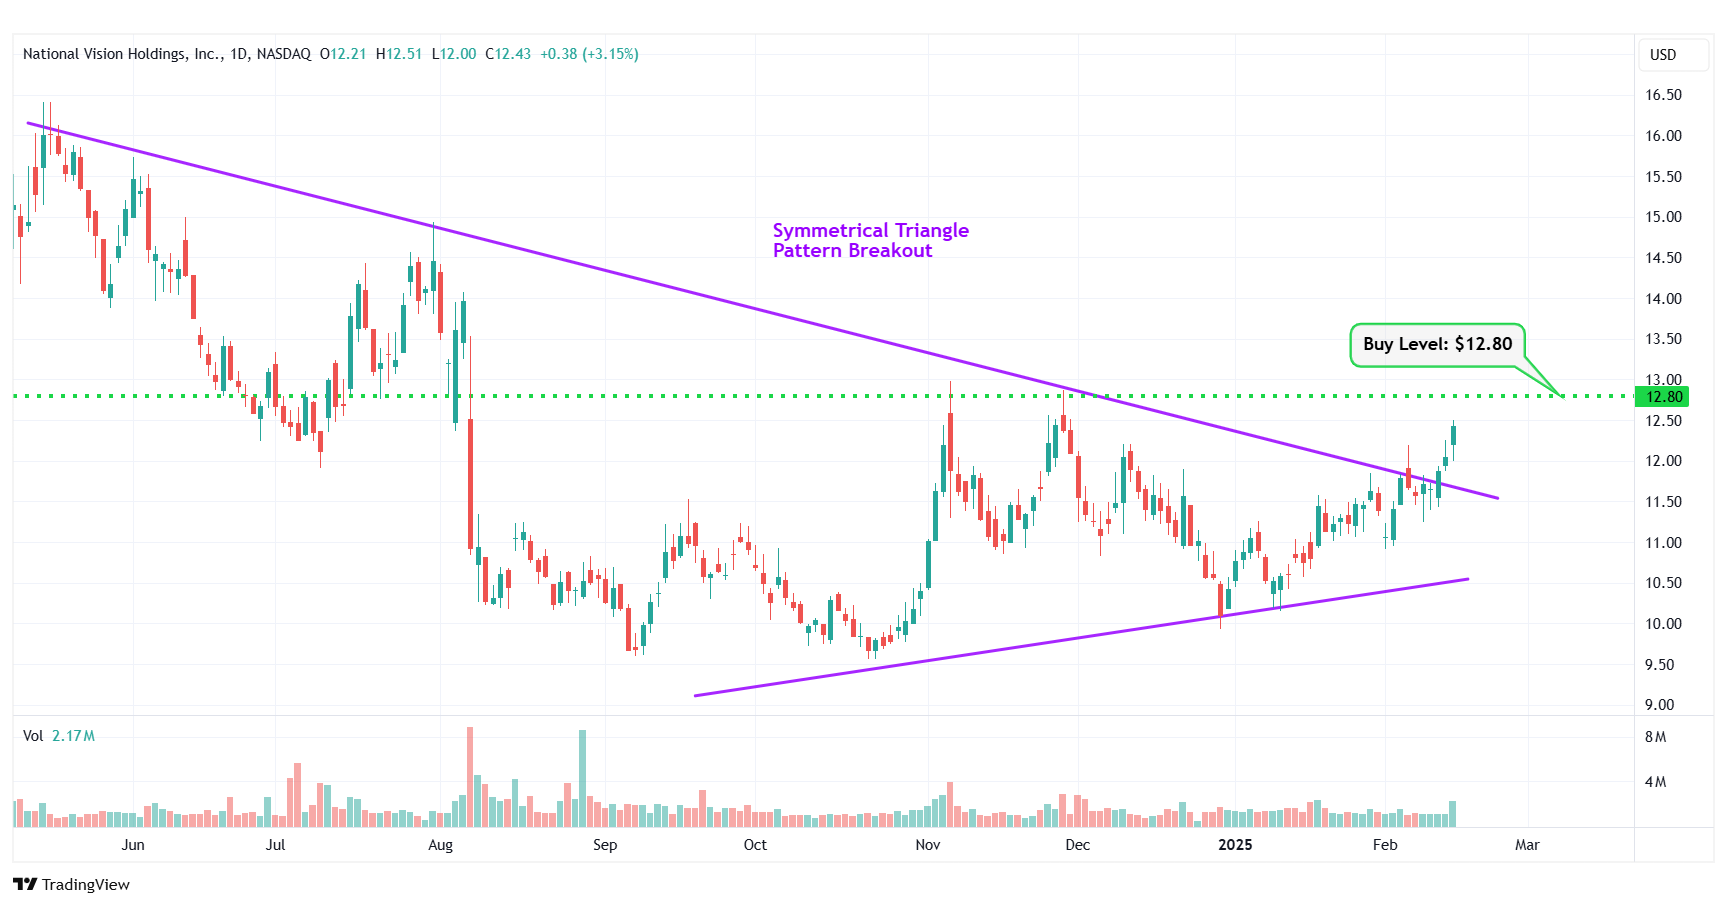
EYE – Symmetrical Triangle Pattern Breakout
#2 Fortis Inc. (NYSE: FTS)
Sector: Utilities • Utilities – Regulated Electric
Reason: Downtrend Channel Breakout
A downtrend or descending channel is the price action contained between downward sloping parallel lines. It is formed by two lines that are drawn by connecting the lower highs and lower lows of a stock’s price. Even though this is typically a bearish pattern, a breakout from the upper rail of this pattern is considered a good bullish indication.
Buy Level(s): The daily chart shows that the stock has currently broken out of a downtrend channel. However, there is a near-term resistance level for the stock. Hence, the ideal buy level for FTS is if the stock has a daily close above $45.30. This is marked in the chart below as a green color dotted line.
Daily chart – FTS
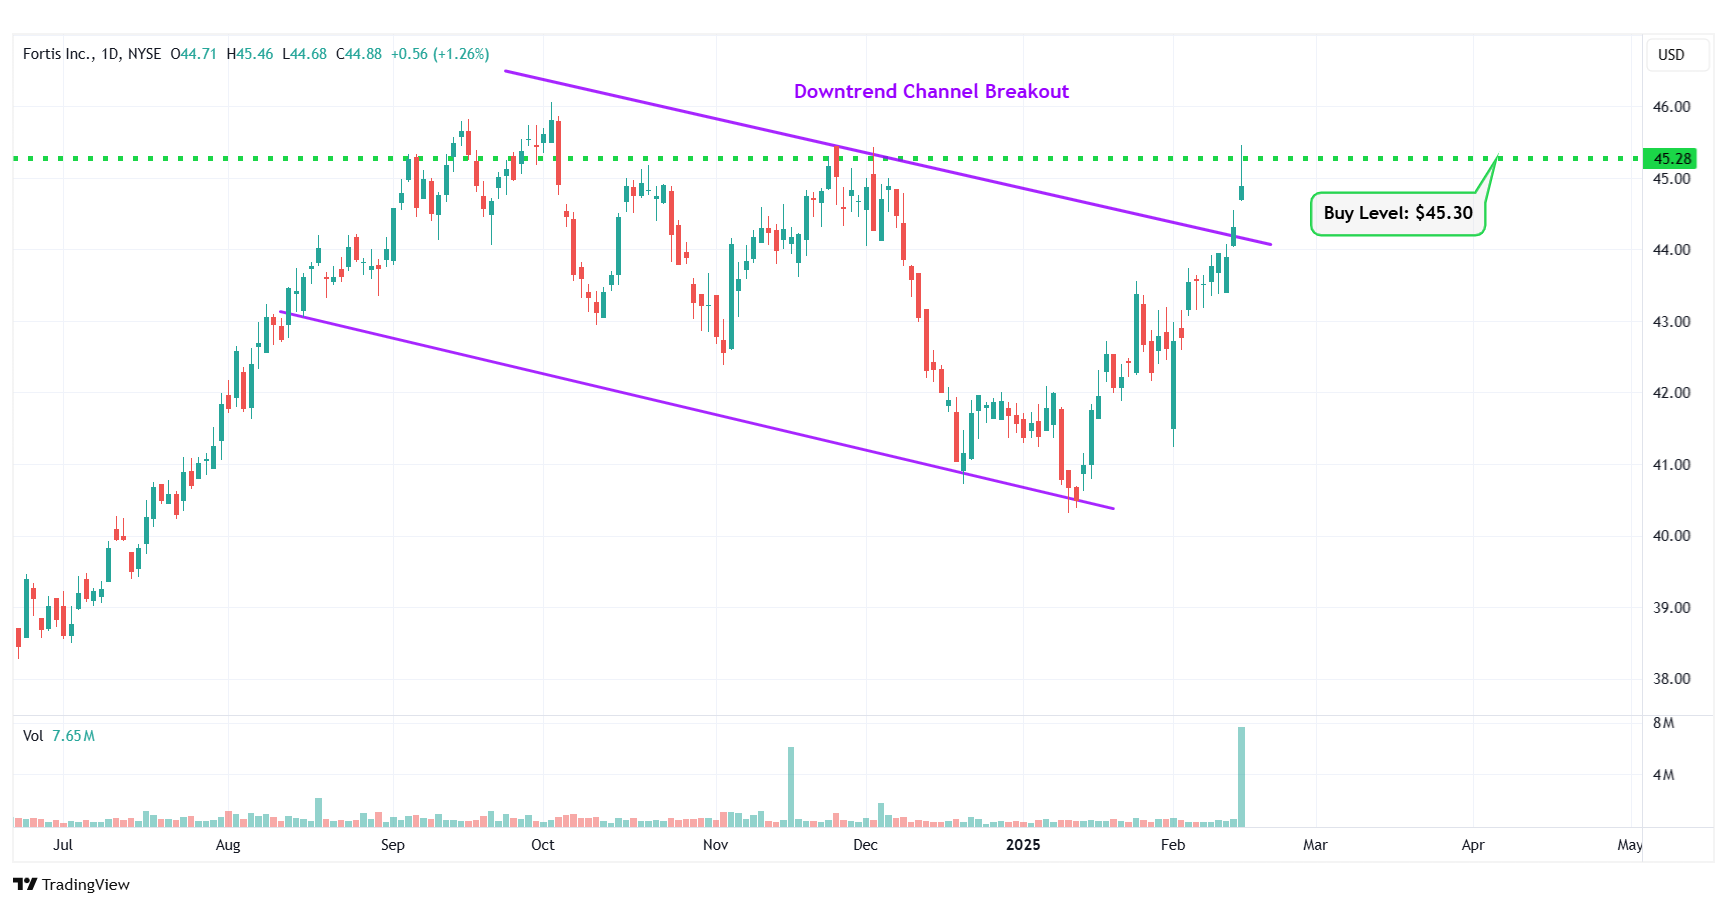
FTS – Downtrend Channel Breakout
#3 DraftKings Inc. (NASDAQ: DKNG)
Sector: Consumer Cyclical • Gambling
Reason: Breakout From an Uptrend Channel
An uptrend channel or an ascending channel is the price action contained between upward sloping parallel lines. It is formed by a lower trend line that connects the swing lows, and an upper channel line that joins the swing highs. A stock usually trades between the two rails of the uptrend channel before finally breaking out from the upper rail.
Buy Level(s): The stock has currently broken out of the uptrend channel. However, the ideal buy level for DKNG is if the stock has a daily close above the near-term resistance level of $54.00. This is marked in the chart below as a green color dotted line.
Daily chart – DKNG
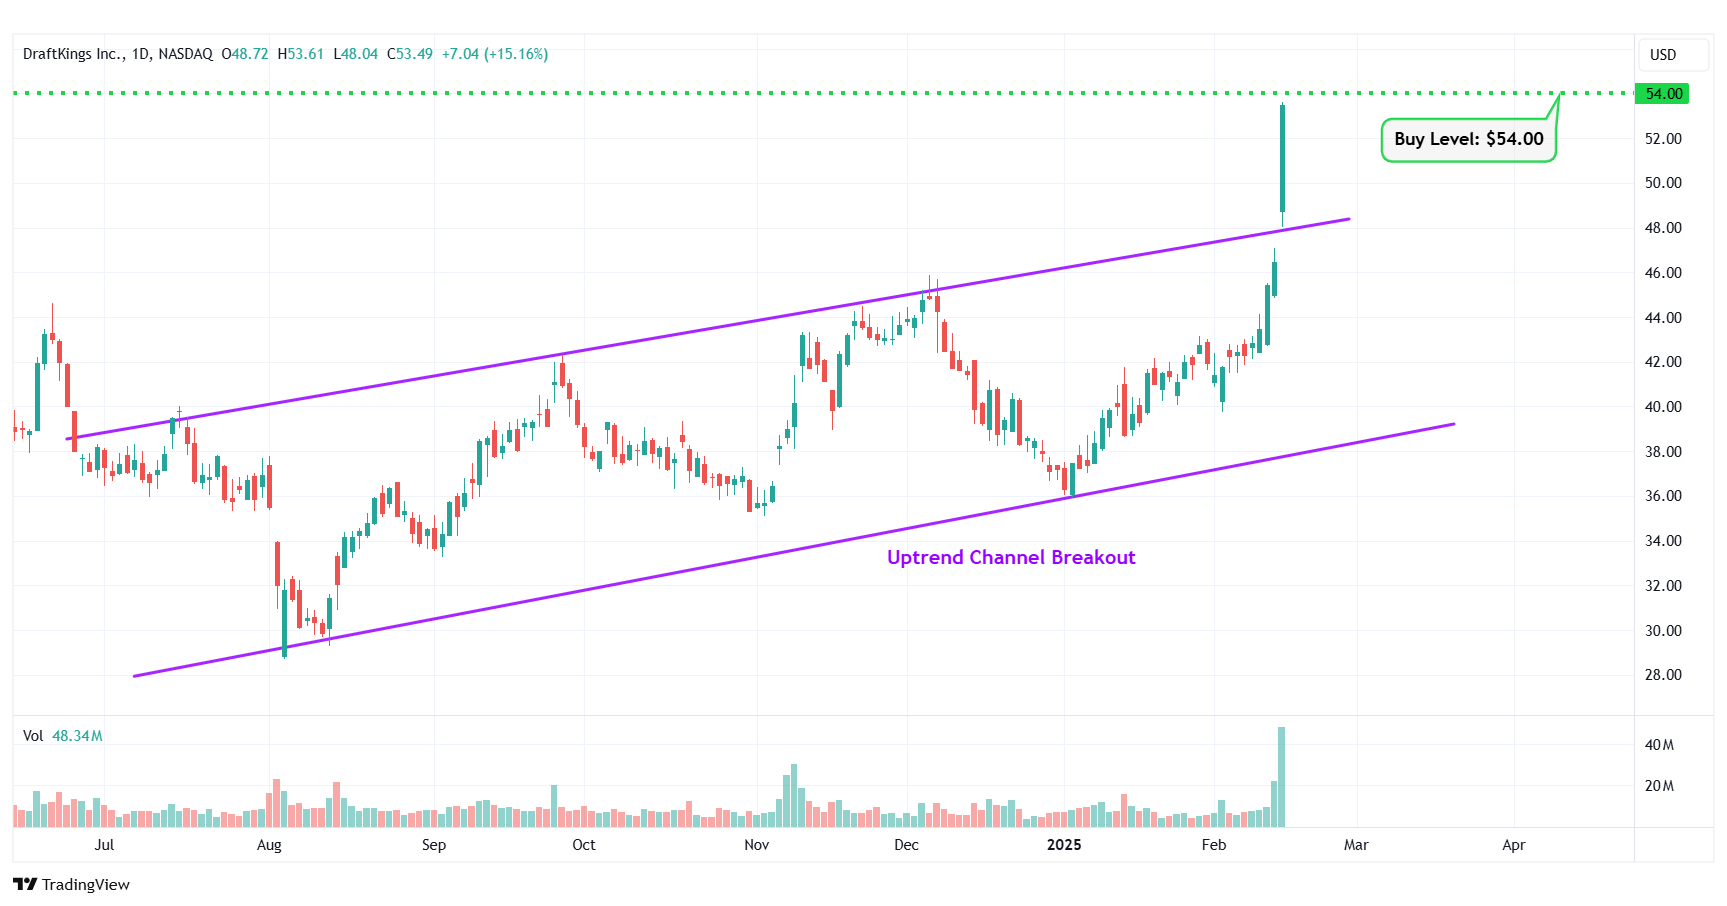
DKNG – Uptrend Channel Breakout
#4 Udemy Inc. (NASDAQ: UDMY)
Sector: Consumer Defensive • Education & Training Services
Reason: Symmetrical Triangle Pattern Breakout
A symmetrical triangle is a chart pattern formed by two converging trend lines connecting a series of sequential peaks and troughs. These two lines result in the formation of a triangle that appears to be symmetrical.
A symmetrical triangle pattern is usually formed when there is indecision in the price movements and there is uncertainty among the buyers and sellers. This chart pattern represents a period of consolidation before the price breaks out or breaks down. In case a breakout occurs from the upper trend line, it is a strong bullish indication as it signifies the start of a new bullish trend.
Buy Level(s): The stock has currently broken out of a symmetrical triangle pattern. However, the ideal buy level for UDMY is if the stock closes above the immediate resistance level of $10.20. This is marked in the chart below as a green color dotted line.
Daily chart – UDMY
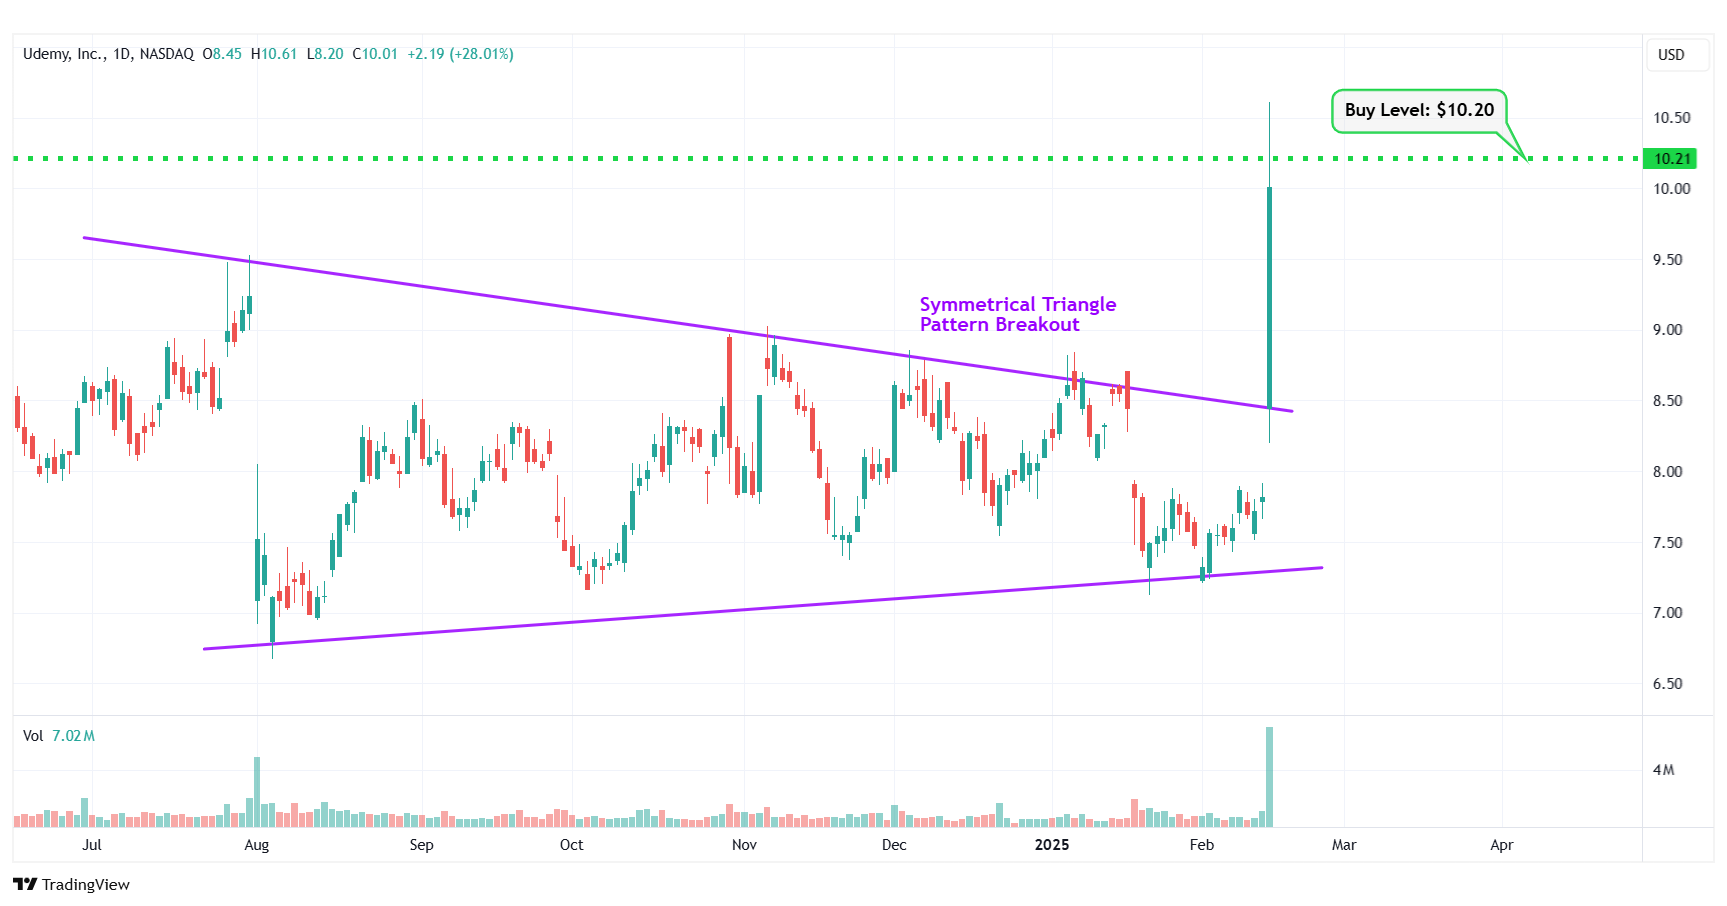
UDMY – Symmetrical Triangle Pattern Breakout
#5 Wynn Resorts Ltd (NASDAQ: WYNN)
Sector: Consumer Cyclical • Resorts & Casinos
Reason: Falling Wedge Pattern Breakout
A falling wedge pattern is formed by joining two downward-sloping, converging trendlines having a contracting range. The pattern appears to be wide at the top and continues to contract as prices fall. A breakout from a falling wedge pattern can indicate either reversal or continuation depending on where the pattern appeared in the trend.
A stock that has broken out of a falling wedge pattern would have gained momentum and would have the potential to move higher.
Buy Level(s): The stock has currently broken out of a falling wedge pattern. However, the ideal buy level for WYNN is above the nearest resistance level of $90.00. This is marked in the chart below as a green color dotted line.
Daily chart – WYNN
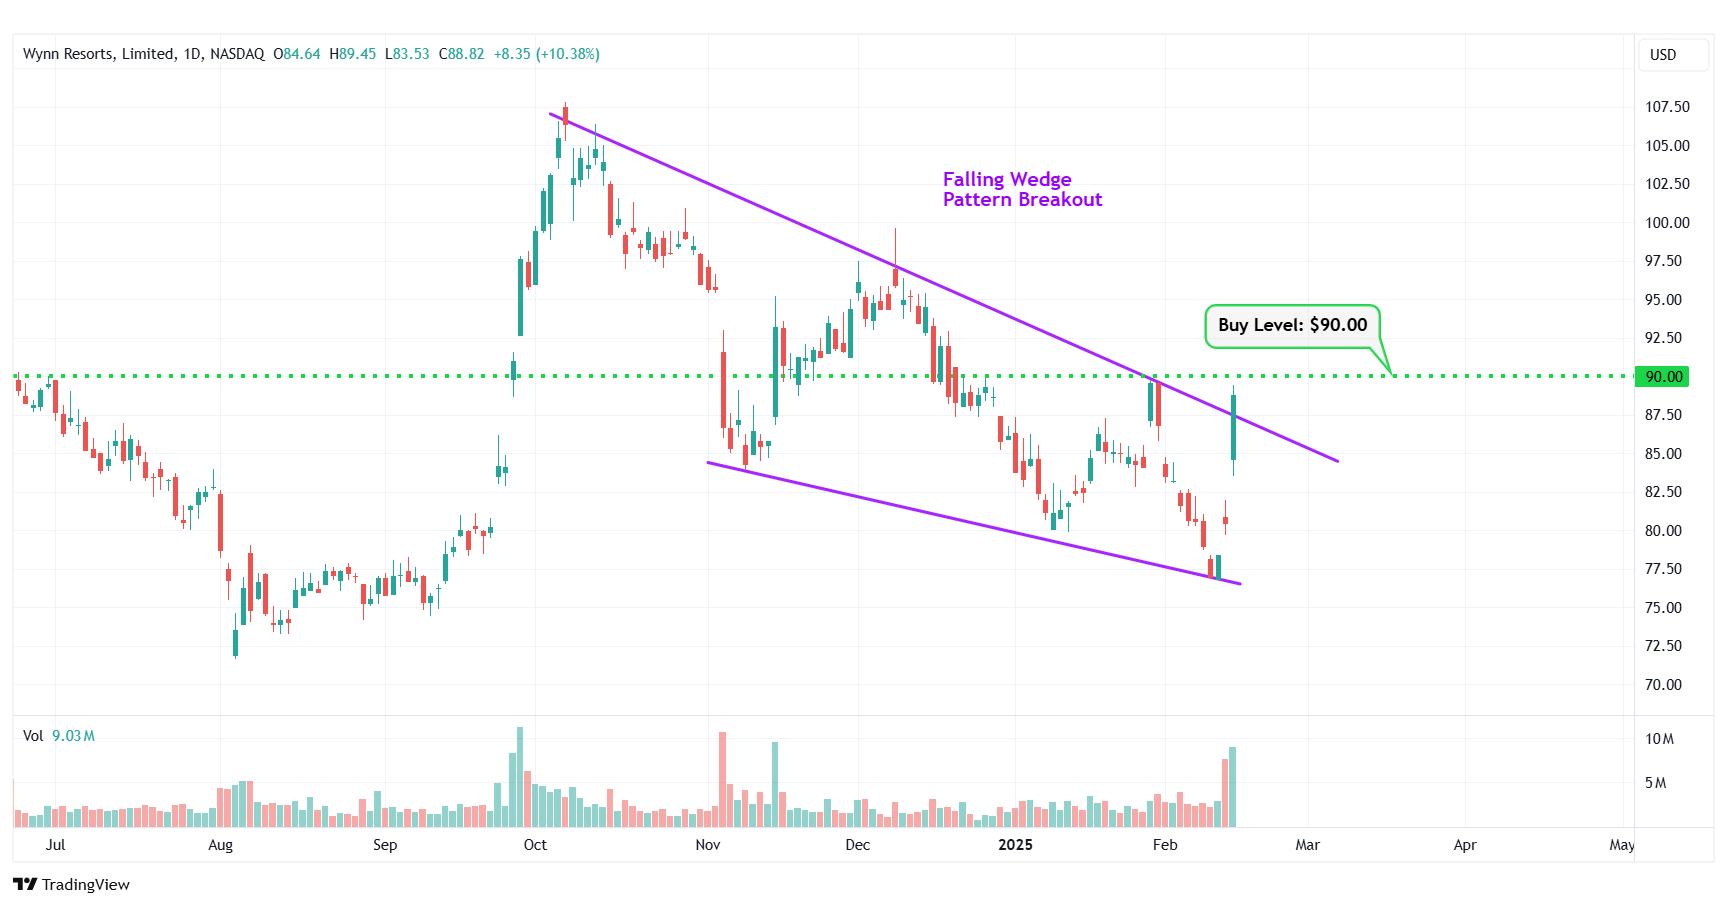
WYNN – Falling Wedge Pattern Breakout
#6 Procore Technologies Inc. (NYSE: PCOR)
Sector: Technology • Software – Application
Reason: Breakout From a Flag Pattern
A flag pattern is a short-term continuation pattern that marks a small consolidation before the previous move resumes. The pattern is formed when the market consolidates in a narrow range after a sharp move. For a stock in an uptrend, a breakout from this pattern is typically a strong bullish indication.
Buy Level(s): Although the stock has currently broken out of the flag pattern, the ideal buy level for PCOR is above the near-term resistance level of $88.80. This is marked in the chart below as a green color dotted line.
Daily chart – PCOR
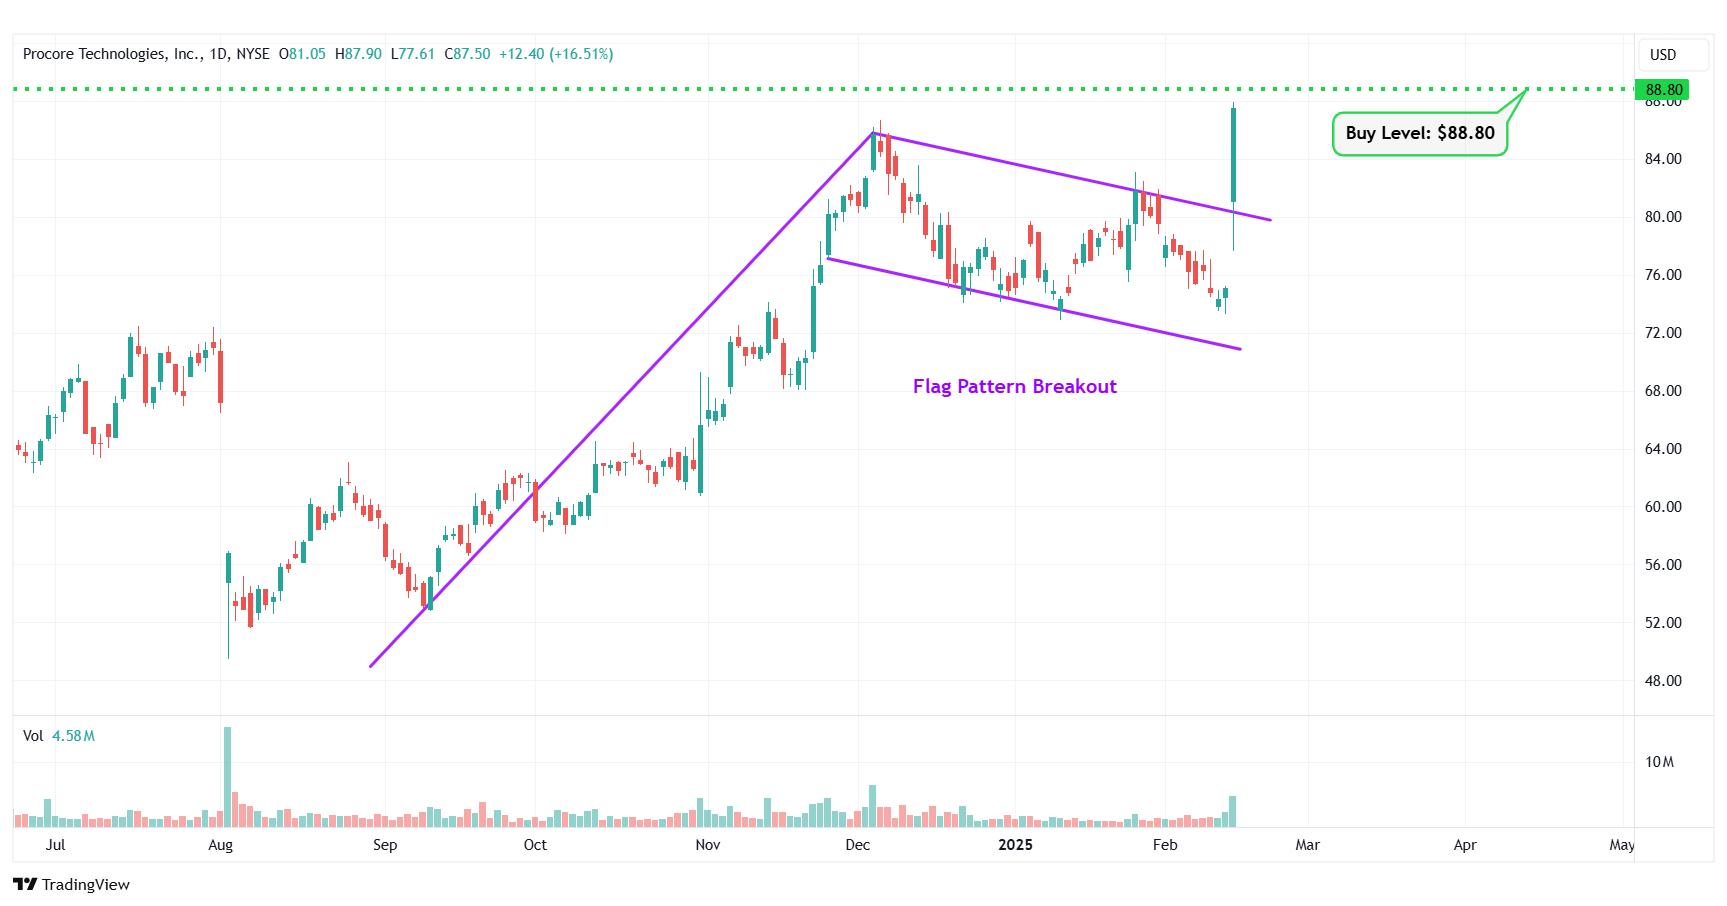
PCOR – Flag Pattern Breakout
#7 Kenvue Inc. (NYSE: KVUE)
Sector: Consumer Defensive • Household & Personal Products
Reason: Falling Wedge Pattern Breakout
A falling wedge pattern is formed by joining two downward-sloping, converging trendlines having a contracting range. The pattern appears to be wide at the top and continues to contract as prices fall. A breakout from a falling wedge pattern can indicate either reversal or continuation depending on where the pattern appeared in the trend.
A stock that has broken out of a falling wedge pattern would have gained momentum and would have the potential to move higher.
Buy Level(s): The stock has currently broken out of a falling wedge pattern. However, the ideal buy level for KVUE is above the nearest resistance level of $22.20. This is marked in the chart below as a green color dotted line.
Daily chart – KVUE
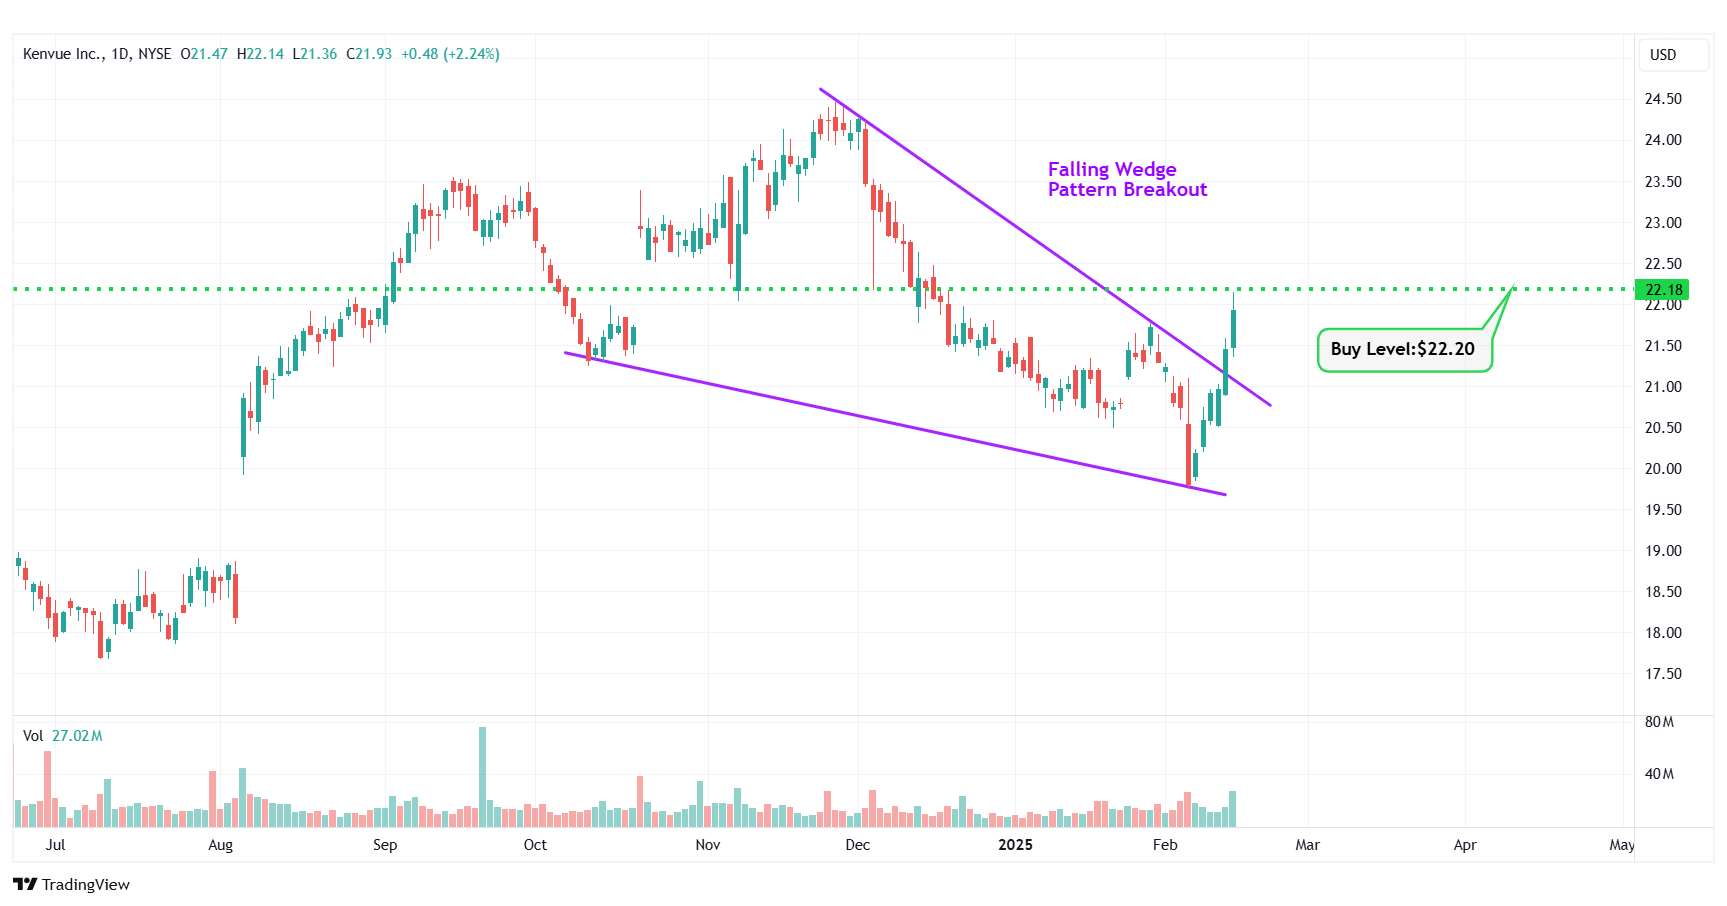
KVUE – Falling Wedge Pattern Breakout
#8 Applied Digital Corporation (NASDAQ: APLD)
Sector: Technology • Information Technology Services
Reason: Formation of a Symmetrical Triangle Pattern
A symmetrical triangle is a chart pattern formed by two converging trend lines connecting a series of sequential peaks and troughs. These two lines result in the formation of a triangle that appears to be symmetrical.
A symmetrical triangle pattern is usually formed when there is indecision in the price movements and there is uncertainty among the buyers and sellers. This chart pattern represents a period of consolidation before the price breaks out or breaks down. In case a breakout occurs from the upper trend line, it is a strong bullish indication as it signifies the start of a new bullish trend.
Buy Level(s): The ideal buy level for APLD is if the stock has a daily close above the breakout level of the symmetrical triangle pattern, at around $9.40. This is marked in the chart below as a green color dotted line.
Daily chart – APLD
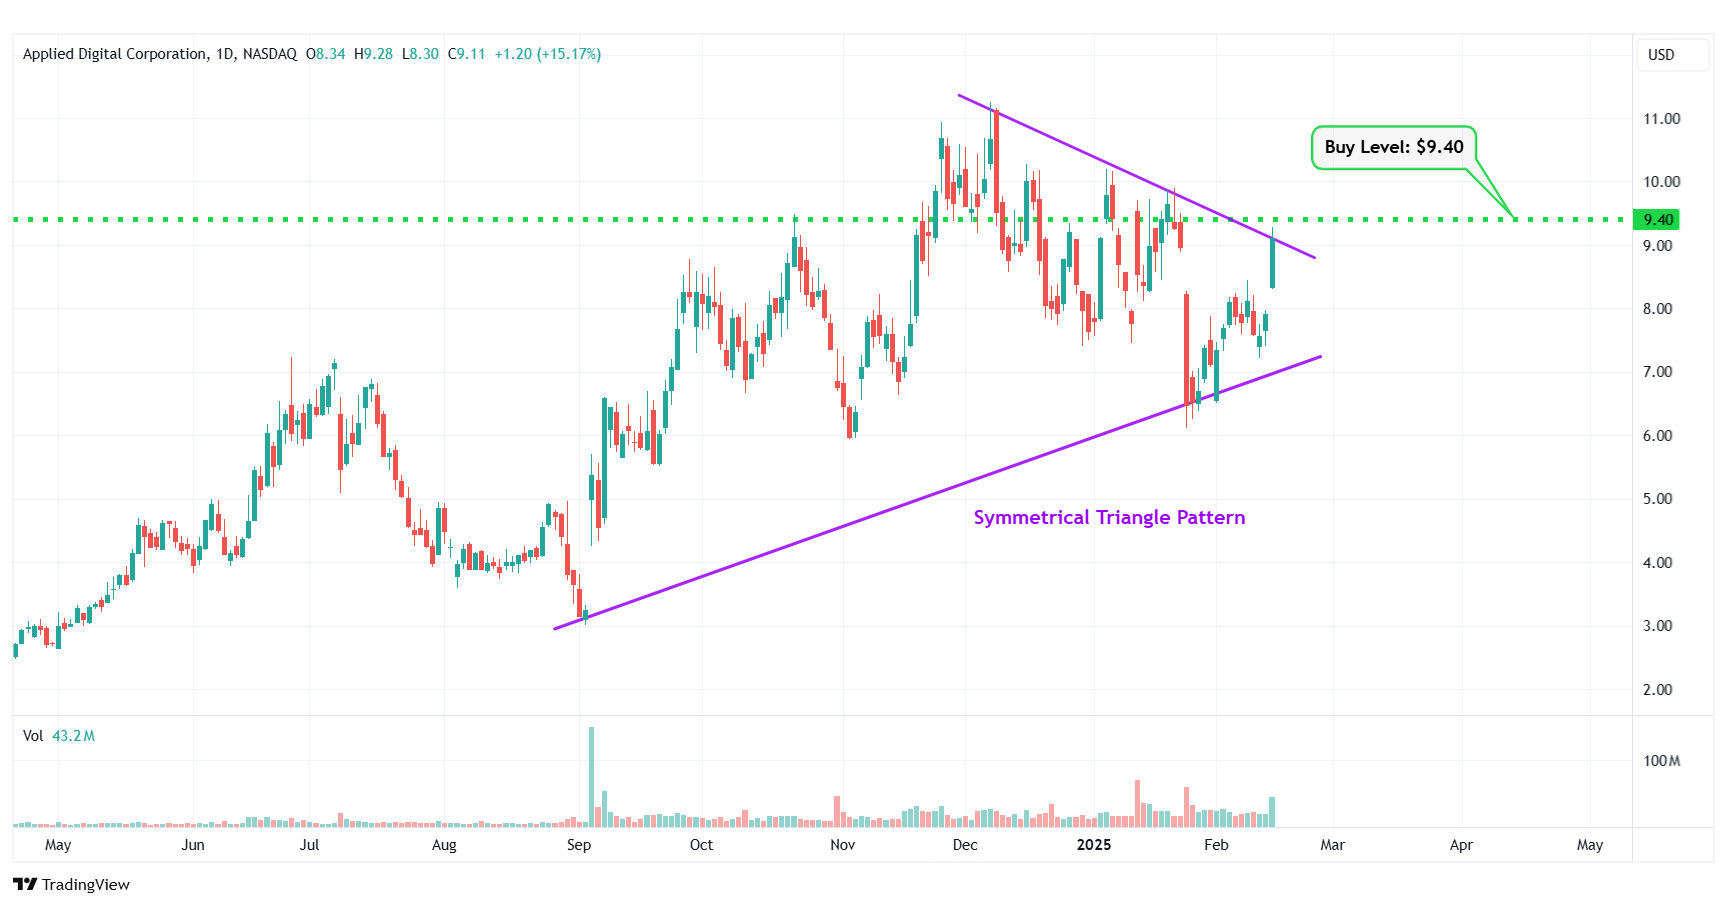
APLD – Symmetrical Triangle Pattern
#9 CRISPR Therapeutics AG (NASDAQ: CRSP)
Sector: Healthcare • Biotechnology
Reason: Formation of a Downtrend Channel
A downtrend or descending channel is the price action contained between downward sloping parallel lines. It is formed by two lines that are drawn by connecting the lower highs and lower lows of a stock’s price. Even though this is typically a bearish pattern, a breakout from the upper rail of this pattern is considered a good bullish indication.
Buy Level(s): The daily chart shows that the stock is currently forming a downtrend channel. The ideal buy level for CRSP is if the stock breaks out of the downtrend channel and has a daily close above $51.10. This is marked in the chart below as a green color dotted line.
Daily chart – CRSP
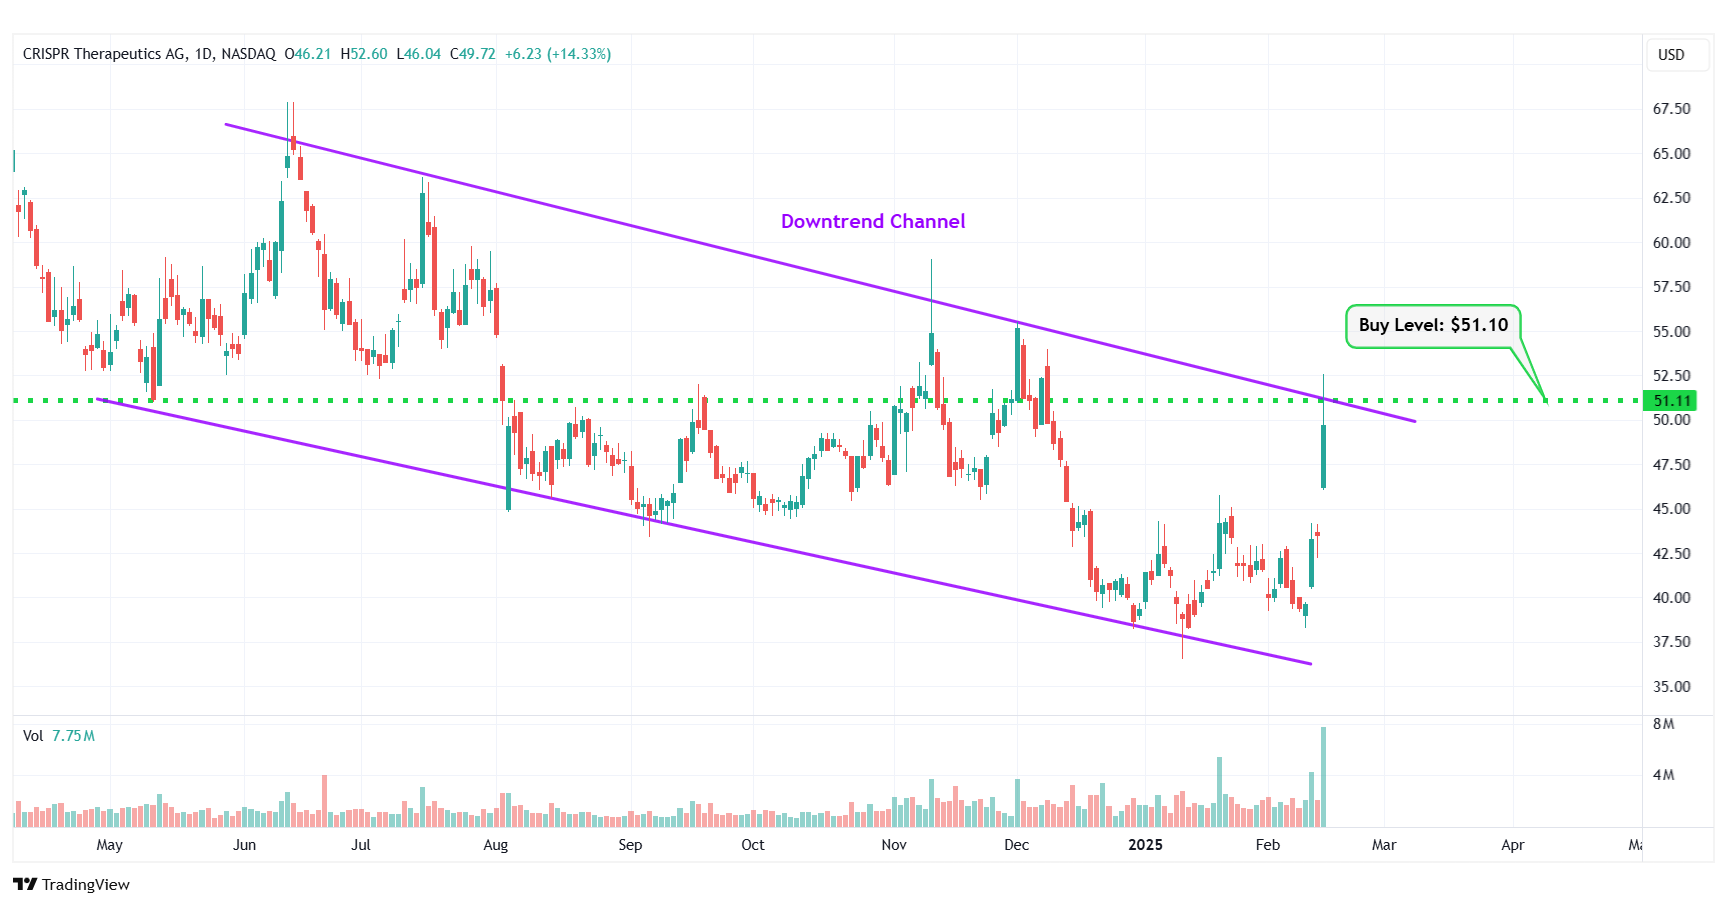
CRSP – Downtrend Channel
#10 Recursion Pharmaceuticals Inc. (NASDAQ: RXRX)
Sector: Healthcare • Biotechnology
Reason: Symmetrical Triangle Pattern Breakout
A symmetrical triangle is a chart pattern formed by two converging trend lines connecting a series of sequential peaks and troughs. These two lines result in the formation of a triangle that appears to be symmetrical.
A symmetrical triangle pattern is usually formed when there is indecision in the price movements and there is uncertainty among the buyers and sellers. This chart pattern represents a period of consolidation before the price breaks out or breaks down. In case a breakout occurs from the upper trend line, it is a strong bullish indication as it signifies the start of a new bullish trend.
Buy Level(s): The stock has currently broken out of a symmetrical triangle pattern. However, the ideal buy level for RXRX is if the stock closes above the immediate resistance level of $10.80. This is marked in the chart below as a green color dotted line.
Daily chart – RXRX
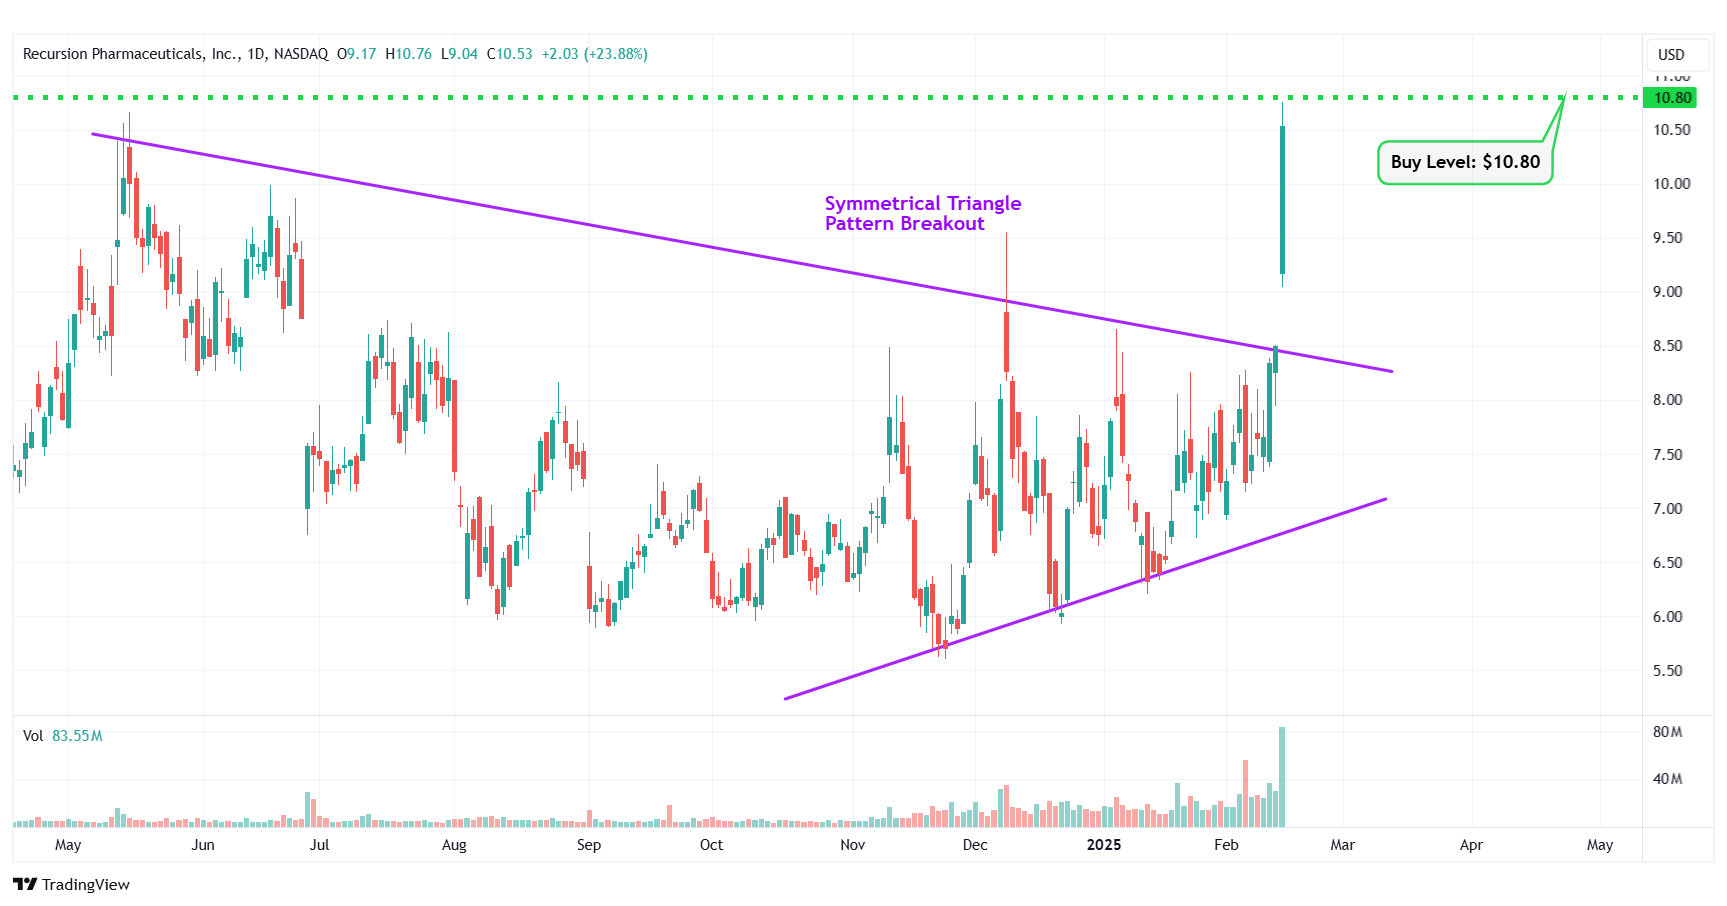
RXRX – Symmetrical Triangle Pattern Breakout
Happy Trading!
Trades of The Day Research Team
I recently visited Mar-a-Lago... And now I'm prepared to put my reputation on the line. Since 1998, my proprietary system would've returned 13,126% in backtests. (That's 13X the S&P and 106X the average investor, according to JP Morgan.) However, one investment I just uncovered could be my biggest winner of all... It involves President Trump, Elon Musk, trillions of dollars, China... And a MAJOR upgrade to the artificial intelligence revolution. See for yourself!
Source: Trades of the Day
