We recently started a series called “Penny Stock of the Day”. These ideas are geared toward traders with an extremely high risk appetite.
Our Penny Stock of the Day is chosen by screening for stocks under $5 and then applying technical analysis on the shortlisted set of penny stocks showing unusual volume. When making these trades, please make sure to pay vigilant attention to pricing moves and have a strict stop loss in place to avoid significant losses.
Penny Stock of the Day: WiMi Hologram Cloud Inc. (NASDAQ: WIMI)
Today’s penny stock pick is the WiMi Hologram Cloud Inc. (NASDAQ: WIMI).
WiMi Hologram Cloud Inc. provides augmented reality (AR) based holographic services and products in China. It operates in three segments: AR Advertising Services, AR Entertainment, and Semiconductor Related Products and Services. The company primarily offers holographic AR advertising services and holographic AR entertainment products. Its holographic AR advertising software enables users to insert into video footages real or animated three-dimensional objects; and online holographic AR advertising solution embeds holographic AR ads into films and shows.
The company’s holographic AR entertainment products consist primarily of payment middleware software, game distribution platform, and holographic mixed reality software. In addition, it engages in the provision of central processing algorithm services, and provides computer chip products to enterprise customers, as well as sells comprehensive solutions for central processing algorithms and related services with software and hardware integration.
Further, the company’s holographic AR technologies are used in software engineering, content production, cloud, big data, and artificial intelligence. Additionally, it provides hardware performance optimization and software algorithm optimization services to online game developers and game distributors. The company serves a range of industries, including manufacturing, real estate, entertainment, technology, media and telecommunications, travel, education, and retail.
Website: https://www.wimiar.com/
Latest 10-k report: https://www.sec.gov/ix?doc=/Archives/edgar/data/1770088/000121390024036124/ea0203457-20f_wimiho.htm
Analyst Consensus: Not covered by Wall Street analysts.
Potential Catalysts / Reasons for the Hype:
- The company announced that its R&D team developed a revolutionary technology — FPGA-based digital quantum computer verification technology. It is expected that this technology will play an important role in the future development of quantum computing, providing new solutions to complex scientific and engineering problems. The system features a 32-qubit digital quantum coprocessor implemented on FPGA hardware, allowing for customizable and efficient quantum computing operations.
On analyzing the company’s stock charts, there seem to be multiple bullish indications…
Bullish Indications
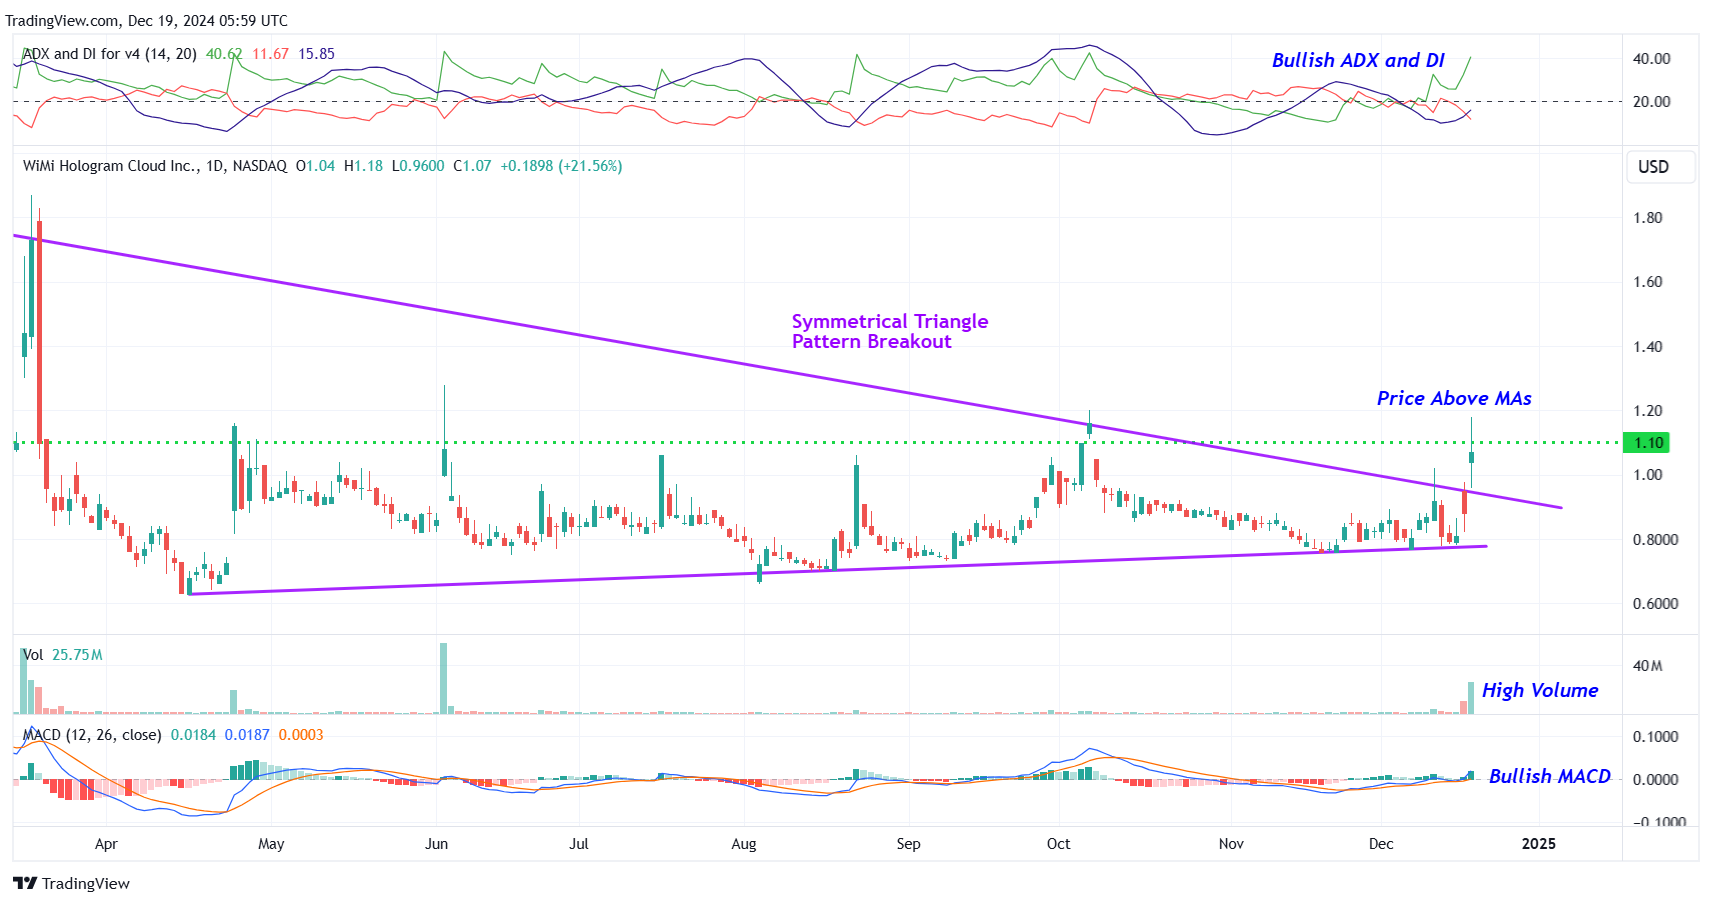
#1 Symmetrical Triangle Pattern Breakout: The daily chart shows that the stock has currently broken out a symmetrical triangle pattern with a high volume. This is marked as purple color lines. A symmetrical triangle pattern represents a period of consolidation before the price breaks out. This is typically formed when there is indecision in the price movements and uncertainty among the buyers and sellers. Once a breakout from the upper trend line occurs, it usually signifies the start of a new bullish trend.
#2 Bullish ADX and DI: The ADX indicator shows bullishness as the +DI line is above the -DI line, and the ADX line is currently moving higher from below the +DI and -DI lines.
#3 Price above MAs: The stock is currently above its 50-day as well as 200-day SMA, indicating that the bulls have currently gained control.
#4 MACD above Signal Line: In the daily chart, the MACD (light blue color) is currently above the MACD signal line (orange color). This indicates a possible bullish setup.
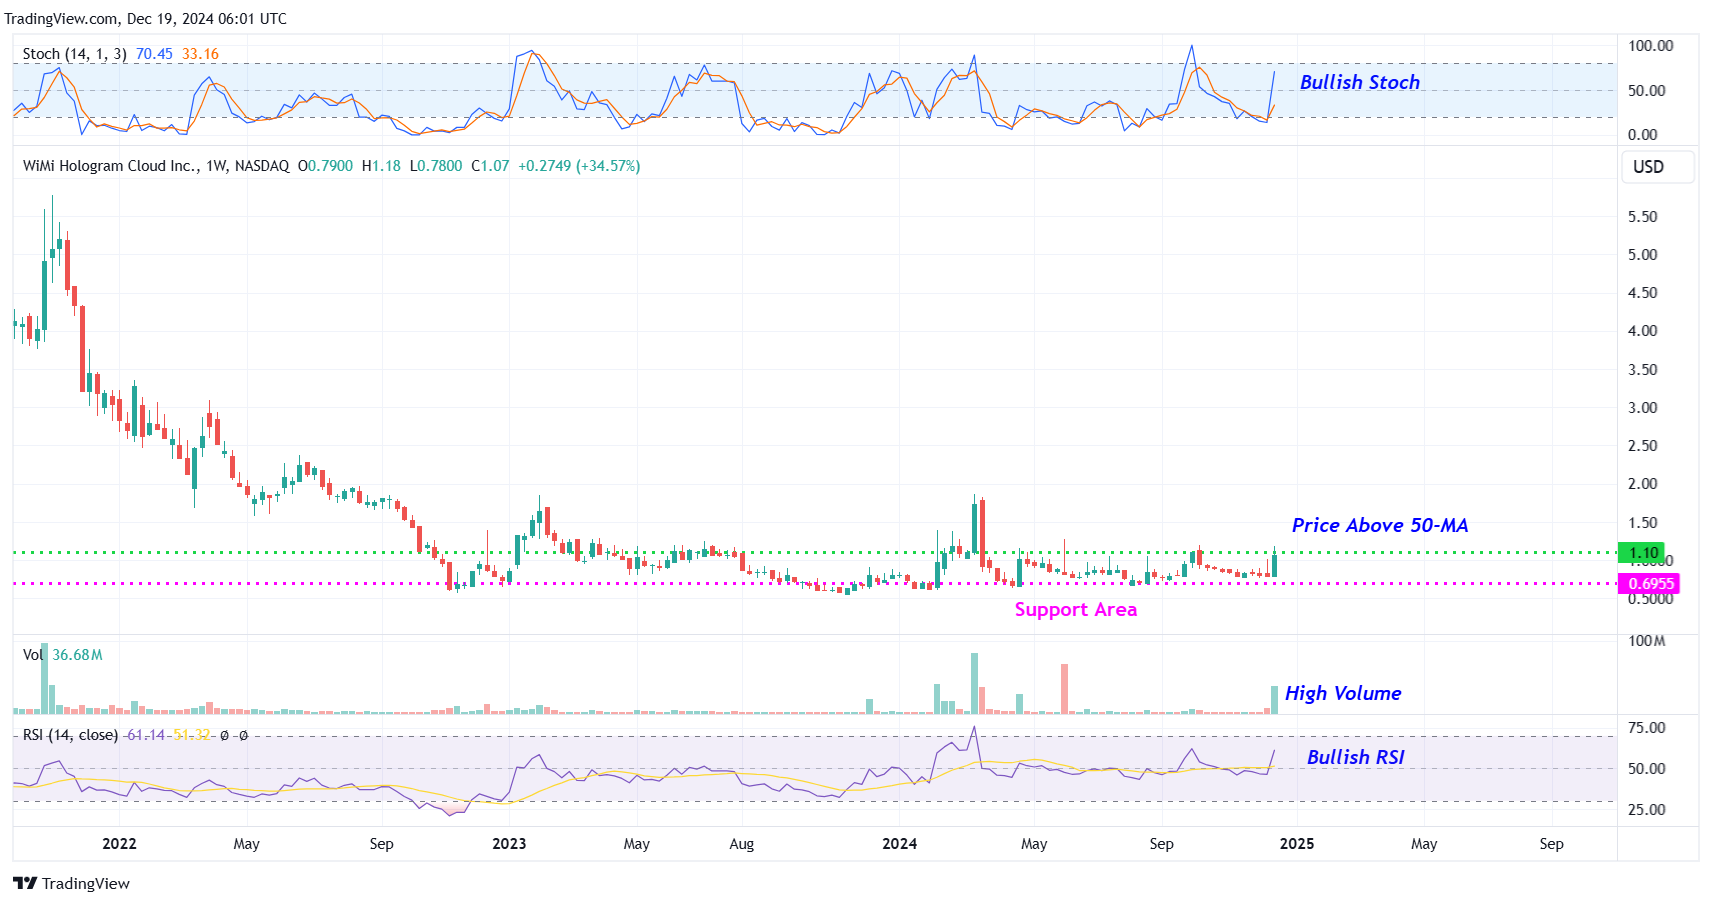
#5 Above Support Area: The weekly chart shows that the stock is currently trading above a support area, which is marked as a pink color dotted line. This is a possible bullish indication. The stock is also trading above its 50-week SMA, indicating that the bulls are gaining control.
#6 Bullish Stoch: The %K line is above the %D line of the stochastic in the weekly chart and is also moving higher from oversold levels, indicating possible bullishness.
Recommended Trade (based on the charts)
Buy Levels: If you want to get in on this trade, the ideal buy level for WIMI is above the price of $1.10.
Target Prices: Our first target is $1.90. If it closes above that level, the second target price is $2.50.
Stop Loss: To limit risk, place a stop loss at $0.65. Note that the stop loss is on a closing basis.
Our target potential upside is 73% to 127%.
For a risk of $0.45, our first target reward is $0.80, and the second target reward is $1.40. This is a nearly 1:2 and 1:3 risk-reward trade.
In other words, this trade offers 2x to 3x more potential upside than downside.
Potential Risks / Red Flags:
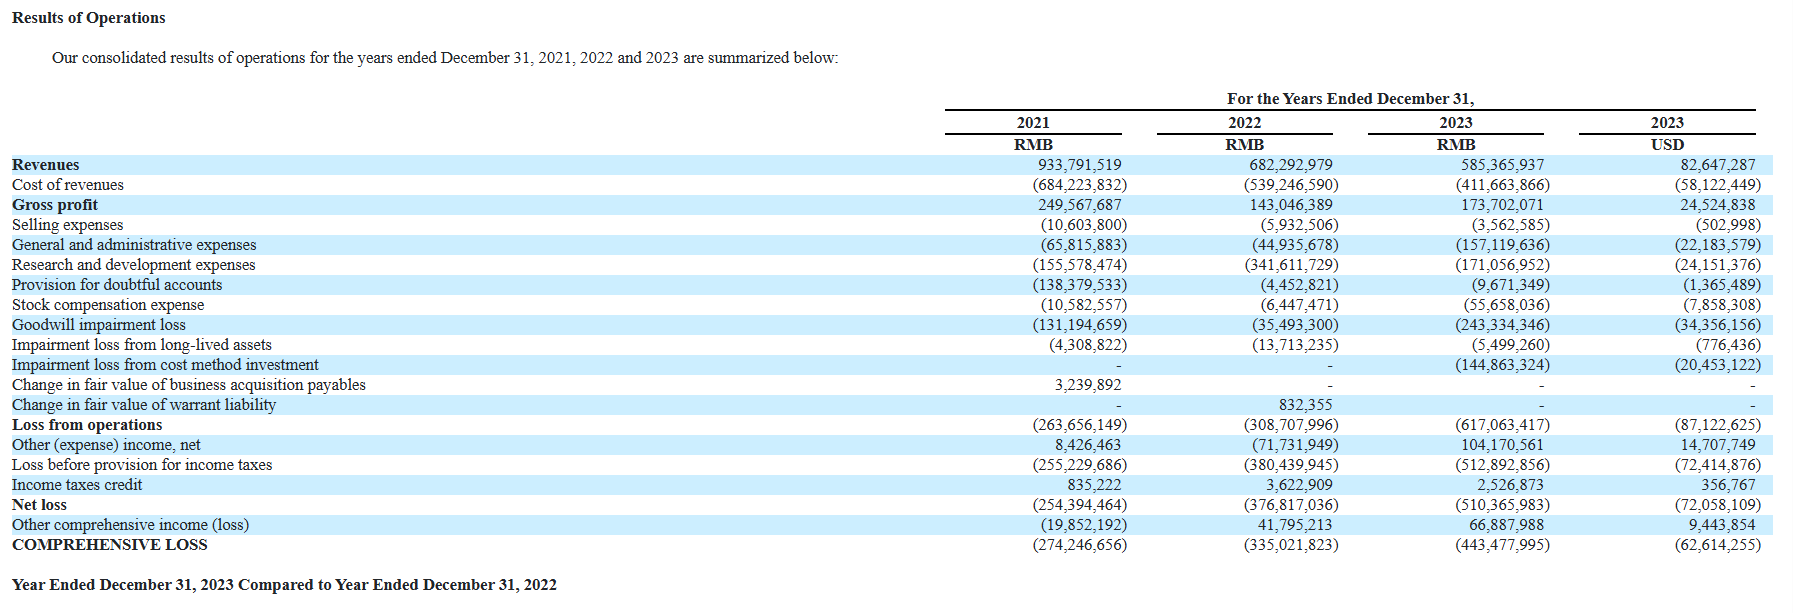
- The company has a history of net losses. WIMI reported net losses of RMB 254.4 million in 2021, RMB 376.8 million in 2022, and RMB 510.4 million (USD 72.1 million) in 2023.
- The company has a limited operating history, making it difficult to gauge future growth prospects. WIMI’s holographic AR business was launched in 2015, and semiconductor business was launched in July 2020.
- The majority of the company’s revenue is sourced from China. Adverse changes in China’s economic, political, or social conditions or government policies could have a material adverse effect on the company’s business, financial condition, and results of operations.
- Despite being a loss-making company, in 2023, WIMI paid an aggregate cash compensation of approximately RMB 907,695 (USD 128,157) to its directors and executive officers.
- As of December 31, 2023, WIMI has 20,115,570 Class A ordinary shares and 176,300,513 Class B ordinary shares outstanding. The sale or availability for sale of substantial amounts of ADSs could adversely affect their market price.
As you can see, today’s featured penny stock offers big upside potential… but it also comes with a number of risks and red flags. As always, when dealing with penny stocks, we advise caution before entering into such high-risk ventures. Remember to think before you trade… understand the risks… and if you decide to trade, stick to your stop-losses!
Happy Trading!
Trades of the Day Research Team
READ BEFORE TRADING PENNY STOCKS: The allure of penny stocks lies in their potential to deliver massive gains in a short period of time. However, in exchange for that opportunity, most penny stocks carry tremendous risk. They can be extremely volatile and are susceptible to “pump and dump” schemes and fraud.
Unlike regular stocks, the financial condition of most penny stock companies can be extremely difficult to analyze, as the majority of such stocks are traded on over-the-counter (OTC) exchanges, which are typically less transparent and less regulated than the major exchanges. In fact, in the penny stock space, it’s often easier to spot warning signs and red flags than it is to identify a sound investment. Nevertheless, we do our best to identify short-term trade opportunities in this exciting space because we know some of our readers are looking for high-risk, high-reward ideas. We just urge you to make sure you fully understand the risks before making any of these trades.
Imagine having 12 new monthly income checks, carrying the potential of up to 21% yields.This is possible because of a tested strategy to get paid out regularly, like a paycheck. For over a decade, I have helped more than 26,000 investors secure 12 new monthly payouts. Meaning, you know exactly how much you'll make every month... Because of some stocks that pay us 8%,13.4%, and even 21.6% yields. See it for yourself here.
Source: Trades of the Day


