Walgreens Boots Alliance, Inc. (NASDAQ: WBA) seems poised for a price surge based on its latest charts. The company operates as a healthcare, pharmacy, and retail company in the United States, the United Kingdom, Germany, and internationally. It operates through three segments: U.S. Retail Pharmacy, International, and U.S. Healthcare. WBA owns the retail pharmacy chains Walgreens in the US, Boots in the UK, Benavides brand in Mexico, and Ahumada brand in Chile.
Bullish Indications
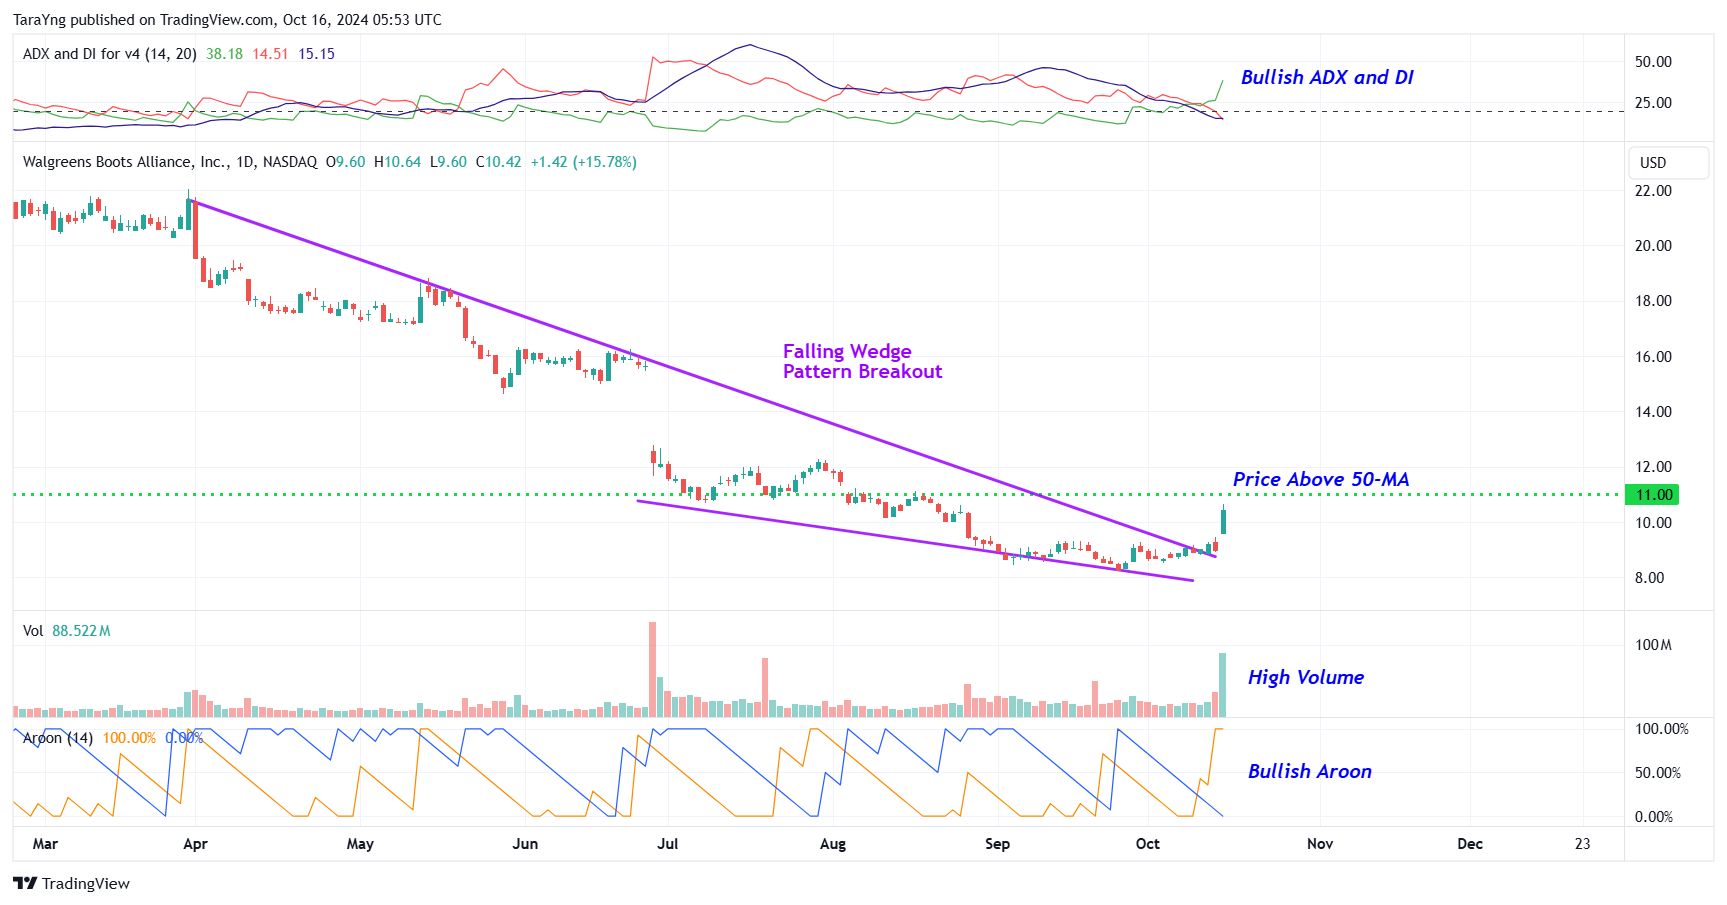
#1 Falling Wedge Pattern Breakout: As you can see from the daily chart, the stock had been forming a falling wedge pattern for the past few weeks. These are marked as purple color lines. The stock has currently broken out of the falling wedge pattern with a high volume and looks poised for an upmove. A falling wedge is a bullish pattern and a breakout from it implies that the stock may move higher in the short term.

WBA – Daily Chart
#2 Price above MA: The price is currently above the short-term moving average of 50-day SMA, indicating that the bulls are gaining control. This is a positive indication.
#3 Bullish ADX: The ADX indicator shows that the +DI line is currently above the –DI line and the ADX line has started to move up from below the –DI and +DI lines. This indicates possible bullishness.
#4 Bullish Aroon: The value of Aroon Up (orange line) is above 70 while Aroon Down (blue line) is below 30 in the daily chart. This indicates possible bullishness.
#5 Above Support Area: As you can see from the weekly chart, the stock has currently moved up from a support level. This level is marked as a pink color dotted line. This looks like a good area for the stock to move higher.

WBA – Weekly Chart
#6 %K above %D: The %K (blue) line of stochastic has currently crossed above the %D (Orange) line in the weekly chart and is also moving higher from oversold levels. This is a possible bullish indication.
#7 Bullish MACD: The MACD line is above the MACD signal line in the weekly chart, indicating bullishness.
Recommended Trade (based on the charts)
Buy Levels: If you want to get in on this trade, you can purchase shares of WBA above the price of around $11.00.
TP: Our target prices are $14.50 and $17.00 in the next 3-6 months.
SL: To limit risk, place stop-loss at $9.00. Note that the stop-loss is on a closing basis.
Our target potential upside is 32% to 55% in the next 3 to 6 months.
For a risk of $2.00, our target rewards are $3.50 and $6.00. This is a nearly 1:2 and 1:3 risk-reward trade.
In other words, this trade offers nearly 2x to 3x more potential upside than downside.
Risks to Consider
The stock may reverse its overall trend if it breaks down from the falling wedge pattern with a high volume. The sell-off of the stock could also be triggered in case of any negative news, overall weakness in the market, or any regulatory changes in the sector.
Happy Trading!
Tara
Legendary fund manager Louis Navellier – a man Forbes calls "the king of quants" – is going "ALL-IN" on this game-changing AI technology. He says, "This is the culmination of everything you've been reading about AI for the last 60 years."Get the details...
Source: Trades of the Day
