

🚨 Trade Update: ABBV — First Price Target Hit ✅
We recommended AbbVie Inc. (NYSE: ABBV) on June 23, 2026, at a buy level of $233.60, with price targets of $260.00 (PT1) and $275.00 (PT2) and a stop-loss at $220.00 on a closing basis.
PT1 has been achieved — the stock closed at $261.07, comfortably above our $260.00 target, after hitting an intraday high of $261.64 — delivering a gain of approximately 12% from the entry level in under two weeks. PT2 at $275.00 remains in play.
How to manage the position from here: Traders looking to de-risk may consider booking partial profits at current levels. Those with a higher risk appetite can continue holding with a trailing stop at $233.60 (our entry level), making the trade effectively risk-free while leaving room for the move toward PT2.
🚨 Trade Update: GLW — Stopped Out at $199.00 🛑
We recommended Corning Incorporated (NYSE: GLW) on June 26, 2026, at a buy level of $230.20, with price targets of $285.00 (PT1) and $325.00 (PT2) and a stop-loss at $199.00 on a closing basis.
The stock triggered our entry but was unable to sustain momentum above the breakout level. Price reversed and closed below $199.00, triggering our stop-loss. The stock is currently trading around $196.79.
Even with this loss, the math behind the system works — controlled losses on the downside, with outsized gains when setups follow through. Discipline on stop-losses is what keeps the edge intact over a full portfolio of trades.
🚨 Watchlist Update: Multiple Buy Levels Triggered
Two stocks from our Top 10 Breakout Watchlist this week have already cleared their recommended buy levels. Here’s a quick rundown:
Global-E Online Ltd. (NASDAQ: GLBE) has broken out of a downtrend channel and cleared our buy level of $36.70. The stock closed at $36.85, with an intraday high of $37.68.
Merck & Co., Inc. (NYSE: MRK) broke out of a consolidation area and pushed through our buy level of $129.50, closing at $129.56, with an intraday high of $129.61.
Bottom line: ABBV hit PT1 for a ~12% gain — book partial profits or trail your stop to breakeven at $233.60 and aim for PT2 at $275.00. GLW stopped out for a controlled ~14% loss — disciplined stops keep the edge intact. GLBE and MRK from this week’s Top 10 are already above their buy levels — use trailing stops to lock in early gains. And now, on to today’s featured setup…
PTC Therapeutics, Inc. (NASDAQ: PTCT) just broke out of a nine-month symmetrical triangle to a fresh 52-week high — and looks headed even higher.
As we’ll get to just ahead, the combination of a fast-growing new flagship drug, a major balance-sheet cleanup that removed a long-standing overhang, and a fresh technical breakout makes PTCT one of the more interesting setups on the board. Here’s what’s going on…
The Themes Behind the Move
PTC Therapeutics is a U.S.-based biopharmaceutical company that discovers, develops, and commercializes medicines for children and adults living with rare disorders — genetic and metabolic conditions that affect small patient populations but often carry high unmet need and strong pricing power. Its commercial portfolio spans neuromuscular and central-nervous-system diseases, and its pipeline reaches into Huntington’s disease and other rare neurological conditions.
In plain English, when a patient is diagnosed with a rare inherited disorder that has few or no treatment options, PTC is one of the companies working to bring a therapy to market — and increasingly to sell it. Its trajectory hinges on how fast its newest drugs ramp commercially, how cleanly it clears regulatory hurdles for its pipeline, and how well it manages its balance sheet along the way.
PTCT’s latest move reflects a powerful confluence of developments — commercial, financial, and clinical — that have come together in rapid succession to fundamentally reframe the company’s near-term growth trajectory.
| Theme / Catalyst | What Happened | Why Traders Care |
|---|---|---|
| Sephience launch ramping fast | Following its U.S. launch, PTC’s lead drug Sephience (sepiapterin) — a treatment for the rare metabolic disorder phenylketonuria (PKU) — generated $125 million in net revenue in Q1 2026, an impressive 36% quarter-over-quarter growth from Q4 2025, with international expansion into Japan and Brazil slated for later this year. | A brand-new drug compounding at ~36% quarter-over-quarter is the kind of commercial validation that lets a company outpace its own guidance. It’s the clearest evidence that PTC’s growth engine has shifted from pipeline promise to real, high-margin revenue. |
| Regulatory path cleared for next drug | After a prior FDA Complete Response Letter (CRL), PTC locked in a regulatory pathway for vatiquinone in Friedreich’s ataxia. Following Type C talks, the FDA agreed to an open-label study using a natural-history control group rather than a costly placebo-controlled trial. | A prior rejection is now a defined, FDA-blessed road back to market — on a shorter, cheaper, lower-risk timeline. That turns a past setback into a live catalyst and adds a second potential growth driver behind Sephience. |
| $500M note offering de-risks the balance sheet | In mid-June 2026, PTC priced $500 million (plus up to $50M greenshoe) in 0% Convertible Senior Notes due 2031 at a conversion price of $107.48 (a 40% premium). Proceeds refinance the maturing 1.5% notes due 2026, with ~$50 million allocated to concurrent share repurchases. | This pushes the debt maturity wall back five years, strips out interest expense, and layers in a buyback — removing the debt overhang that has weighed on the valuation. A 0% coupon plus a buyback is a clear signal of balance-sheet confidence. |
| Pipeline momentum | PTC reported positive 24-month PIVOT-HD long-term extension data for votoplam (Huntington’s disease, partnered with Novartis), with the first patient dosed in the Phase 3 INVEST-HD study triggering a milestone. The vatiquinone open-label registration study is expected to initiate in Q3 2026. | Additional “shots on goal” beyond the Sephience ramp. Novartis milestone payments add non-dilutive value, and each pipeline readout is a potential catalyst that the market isn’t fully pricing in. |
| Sector tailwinds | The rare-disease biopharma space is in a renaissance: regulators are showing greater flexibility toward Accelerated Approval pathways for unmet rare conditions, while institutional capital is rotating out of overextended mega-cap tech and into high-margin, sticky healthcare compounders. | Orphan-drug pricing power, expedited regulatory pathways, and growing reimbursement are structural tailwinds. PTC’s oral small-molecule focus differentiates it from the gene-therapy names that have drawn recent regulatory noise. |
| Fundamentals & balance sheet | Q1 revenue handily beat estimates at $273 million (+43.5% YoY) versus the $218.8 million expected. Management raised full-year 2026 guidance to $1.08B–$1.18B, and the company sits on a cash cushion of roughly $1.9 billion after its recent capital actions. | A 43.5% top-line beat combined with raised guidance signals accelerating — not slowing — growth. The ~$1.9B cash position steers the company toward cash-flow breakeven and removes financing risk from the thesis. |
| Analyst coverage | Among the 14 analysts issuing twelve-month price targets, the average sits at $91.36, with a high of $120.00 and a low of $50.00. Recent actions are constructive: Citigroup upgraded PTCT to Buy from Neutral and raised its target to $108 (from $76), and Jefferies moved to Buy from Hold, lifting its target to $85 from $76. | The high-end $120 target and a cluster of fresh upgrades point to a coverage universe still catching up to the improving fundamentals. Citigroup’s jump to $108 in particular reflects a re-rating narrative gaining traction. |
| Upcoming triggers | Traders are watching Q3 2026 for the initiation of patient enrollment in the vatiquinone Phase 3 study, and the estimated August 6, 2026 Q2 earnings release — crucial for confirming whether Sephience’s steep quarter-over-quarter trajectory is holding. | A staggered set of catalysts through H2 2026, each capable of independently moving the stock. August earnings is the nearest high-conviction event — another beat-and-raise could drive a re-rating toward the $90–$100+ zone. |
If needed, swipe or scroll sideways to view the full table.
Put it all together, and PTCT is looking less like a volatile, cash-burning biotech leaning on pipeline hope and more like a commercially executing rare-disease franchise with a fast-ramping flagship drug, a cleaned-up balance sheet, a clear regulatory road for its next asset, and roughly $1.9 billion in cash behind it.
The story is getting stronger, but the chart is what could determine whether this move has more room to run in the near term. Here are the bullish technical signals traders should be watching now.
Bullish Technical Signals
#1 Symmetrical Triangle Pattern Breakout: PTCT has broken out of a symmetrical triangle that took roughly nine months to form — a coil of progressively lower highs and higher lows compressing price into an ever-narrower range. Symmetrical triangles are neutral by construction (buyers and sellers in equilibrium), but they carry a directional tell: they typically resolve in the direction of the trend that preceded them. That trend here was up. The breakout through the upper trendline came on a clear volume expansion — the signature that distinguishes a genuine breakout from a false probe — confirming that accumulated supply at the ceiling has been absorbed and a fresh leg higher is underway.
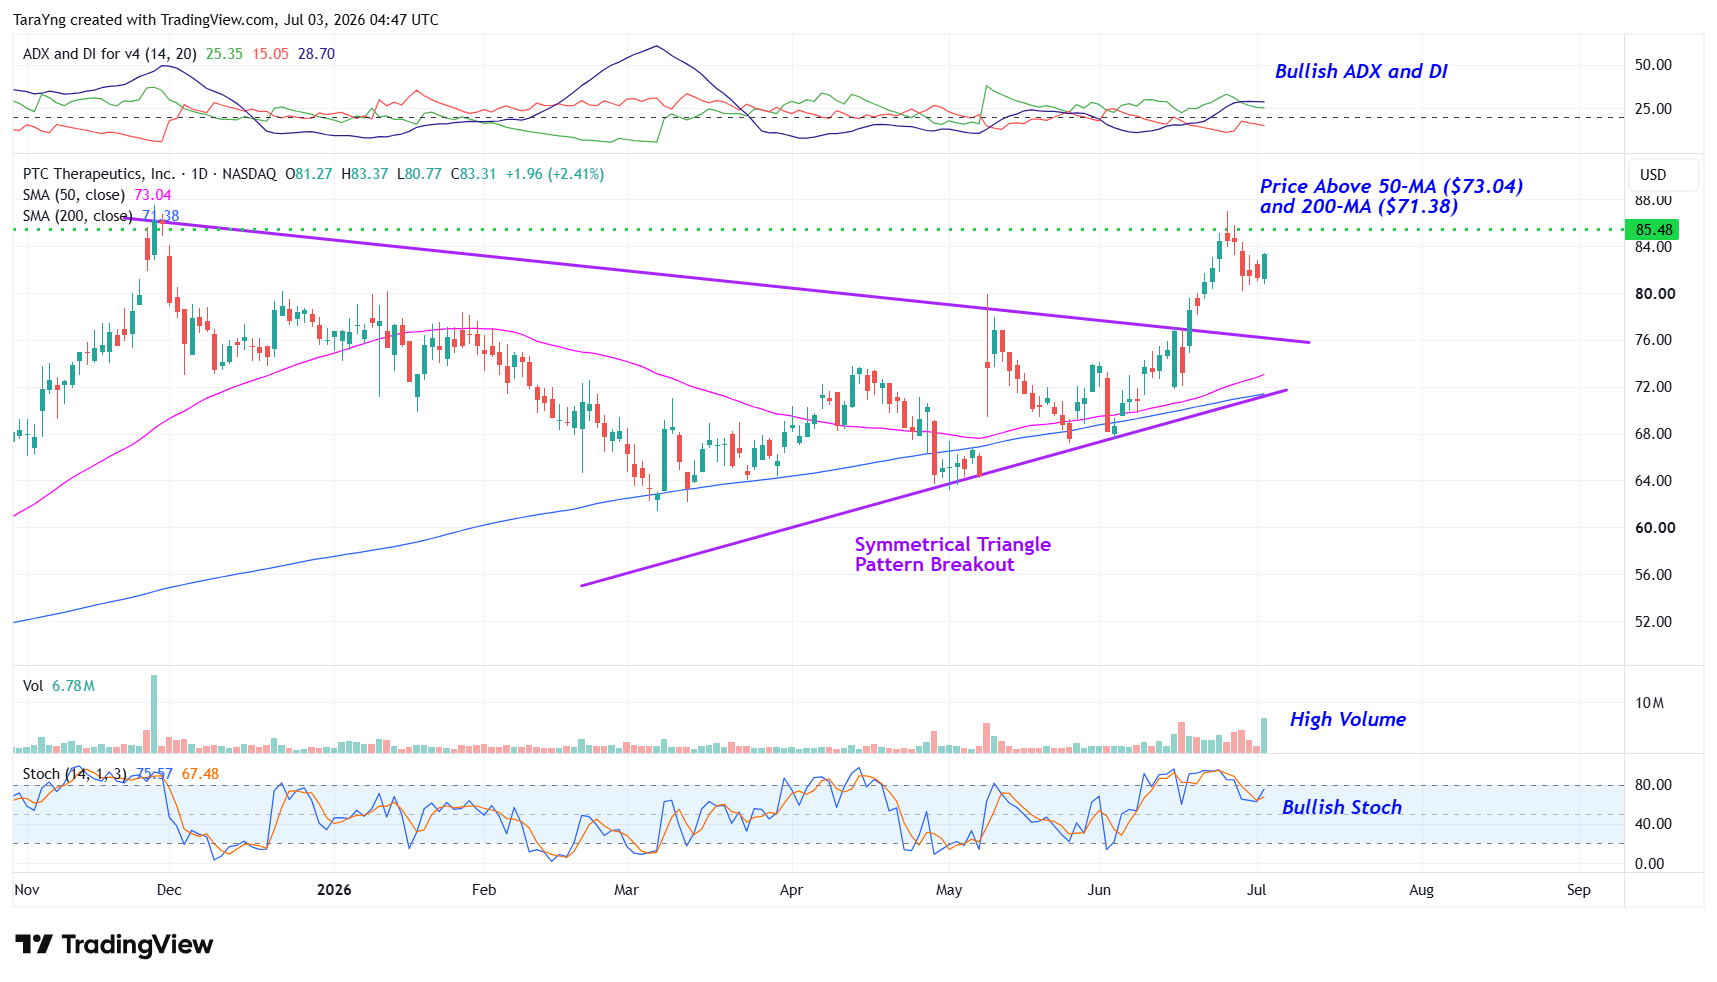
PTCT – Daily Chart
#2 Price above MAs: Price is trading above both the 50-day SMA ($73.04) and 200-day SMA ($71.38), with the 50-day sitting above the 200-day — the classic bullish stack. What makes the current configuration more interesting than a routine “price above MAs” read is how tightly the two averages are clustered. Compression between the 50 and 200 typically follows an extended digestion phase and often precedes expansion. With price now breaking upward from that compression, the two MAs convert from overhead resistance into layered dynamic support, giving buyers a defined shelf to defend on any pullback.
#3 ADX Confirming a New Trend: The ADX read here is textbook early-trend. Two things stand out. First, +DI has crossed decisively above –DI, placing directional pressure squarely on the buy side. Second — and the more consequential signal — ADX itself is turning up from a compressed base beneath both DI lines. Because ADX is direction-agnostic and measures only trend strength, a rise off a low reading is the indicator’s way of saying a new trend isn’t just forming, it’s gaining traction. The fact that ADX is still climbing rather than rolling over means the move has runway; a curl-over here would read as exhaustion instead. Alongside the triangle breakout, that’s two independent momentum reads pointing the same direction.
#4 Bullish Stoch: %K has crossed above %D, a bullish crossover that indicates short-term buying pressure is now overpowering short-term selling. The crossover is more meaningful in context: it’s occurring in the mid-range rather than deep in overbought territory, meaning momentum has room to run before the oscillator flags exhaustion. Read alongside the triangle breakout, it suggests the move higher has fresh momentum behind it, not late-cycle chasing.
#5 Flag Pattern Breakout: Zooming out to the weekly, PTCT has carved a textbook bull flag — a sharp rally (the pole) followed by an orderly, downward-sloping consolidation within a tight channel (the flag). Price has now cleared the upper boundary of that flag. Flags are continuation patterns by definition: the consolidation is the market catching its breath, not reversing, and breakouts typically resume the prior trend with conviction. Compounding the signal, the stock is trading above both its 50-week SMA ($68.50) and 200-week SMA ($46.76), meaning the higher-timeframe structure now agrees with the daily setup. When daily and weekly agree, the signal carries more weight than either would alone.
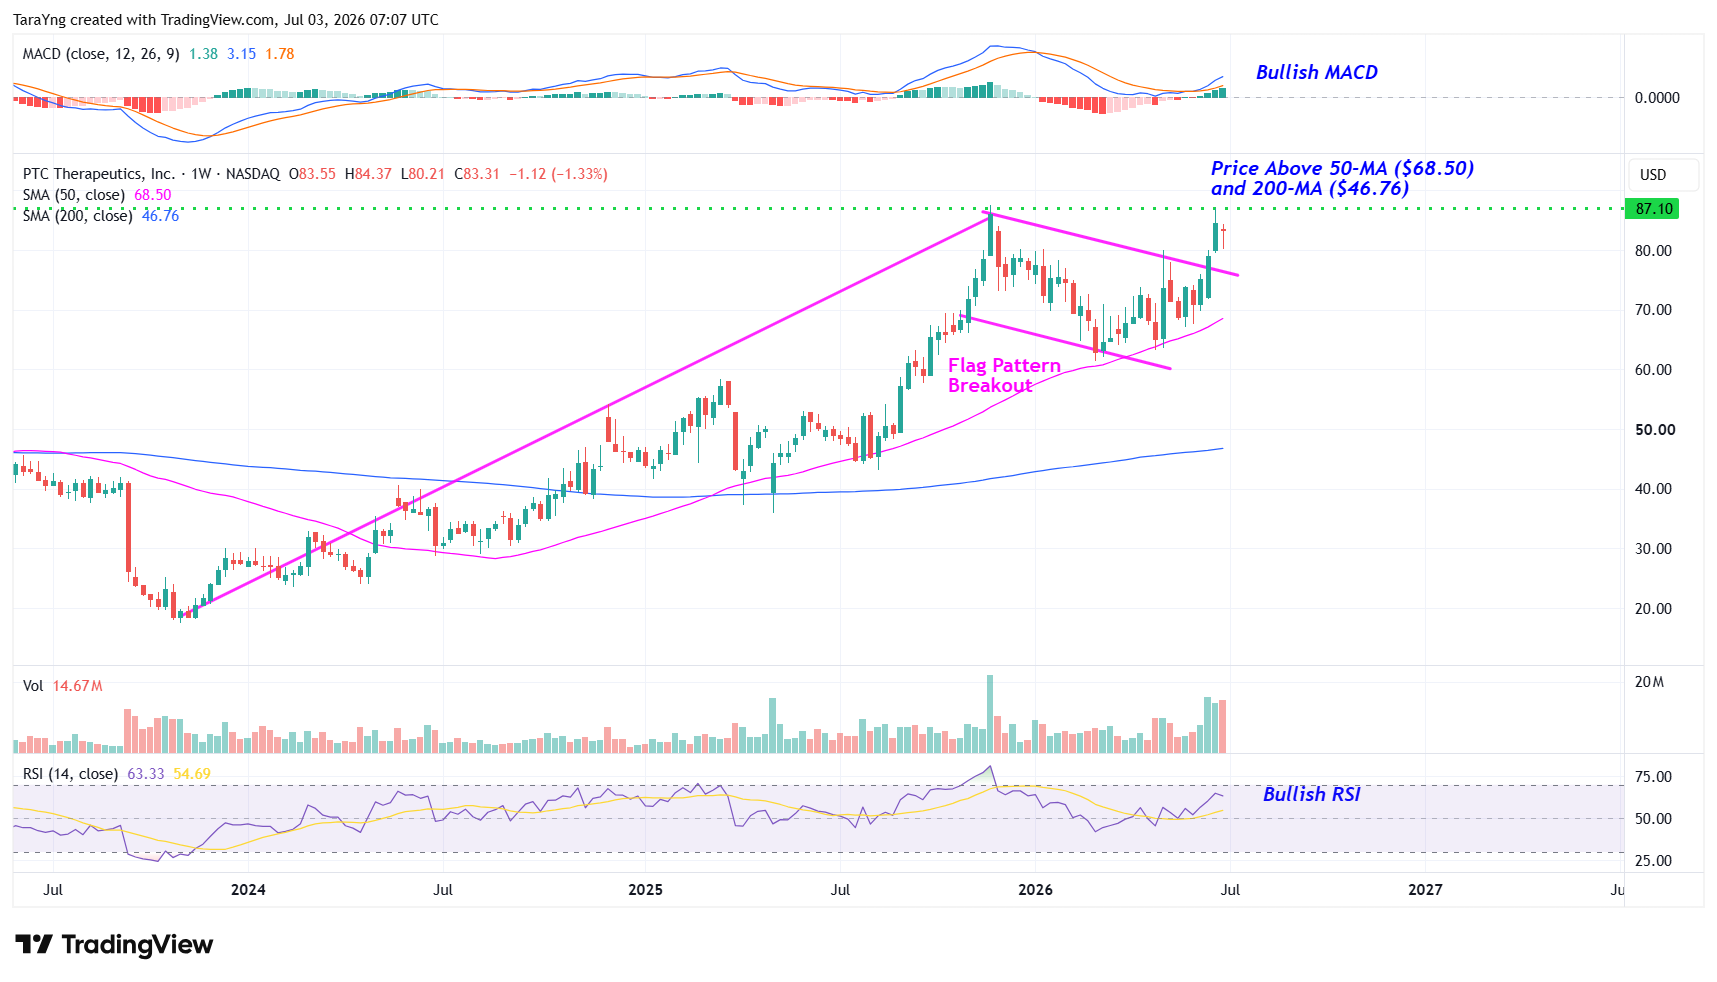
PTCT – Weekly Chart
#6 Bullish MACD: On the weekly, the MACD line has crossed above the signal line — short-term momentum accelerating past longer-term momentum. What matters here is the location of the crossover: it’s happening near the zero line after the histogram flipped from negative to positive, which is the higher-quality version of this signal. Crossovers that occur deep in negative territory are early but noisy; crossovers near zero, with the histogram already turning, tend to mark the start of sustained trend legs. On a weekly chart, that carries real weight.
#7 Bullish RSI: Weekly RSI has cleared the 50 level and is trending higher — a two-part confirmation worth separating. The cross through 50 signals that buyers have taken the momentum baton from sellers; the continued upward slope tells us that momentum is strengthening, not stalling at the midpoint. That distinction matters. An RSI parked at 50 is ambiguous; an RSI moving through 50 with slope is directional. And on a weekly timeframe, momentum shifts of this kind tend to persist for weeks to months, not days — which aligns neatly with the 3-to-6-month horizon of the trade.
Risks to Consider
Even strong setups can fail, especially in a volatile rare-disease biopharma name like PTC Therapeutics. A few things could knock the stock off course:
- A breakdown back below the symmetrical triangle support level on heavy volume would invalidate the breakout thesis
- Negative company-specific news or broader market weakness — any sector rotation out of biotech would pressure the entire group
- Convertible arbitrage selling and dilution — the recent $500 million note issuance set a conversion price of $107.48, and while fundamentally sound, it triggered temporary short-selling pressure from hedge funds running classic convertible-arbitrage strategies
- Insider selling — the Chief Business Officer and Chief Technical Operations Officer executed routine automated sales totaling roughly $3.4 million over the past quarter; these were pre-planned 10b5-1 sales, but the activity is a sentiment overhang
- Pipeline and regulatory risk — the Huntington’s and Friedreich’s ataxia programs carry binary clinical and regulatory outcomes that could disappoint
- Legacy franchise erosion — the older Duchenne muscular dystrophy (DMD) franchise faces erosion, and PTC carries a history of cash burn and dilution
- Valuation and biotech volatility — after a strong run, the stock leaves limited margin of safety if growth slows or a single quarter disappoints
- Macro risk — shifts in interest rates or broader biotech sentiment could pressure the group regardless of company-specific execution
The Bottom Line
PTCT is breaking out of a nine-month symmetrical triangle on the daily chart while also clearing a multi-month bull flag on the weekly — a dual-timeframe technical setup that historically signals the start of a sustained move higher.
The fundamental story underneath the chart is just as strong: a fast-ramping Sephience launch growing 36% quarter-over-quarter, a $500 million balance-sheet cleanup that removed the near-term debt overhang, and record Q1 revenue of $273 million (+43.5% YoY) with raised full-year guidance to $1.08B–$1.18B.
Combine that with multiple commercial and clinical catalysts staggered through the back half of 2026 — the August 6 Q2 earnings release, the Q3 initiation of the vatiquinone study, and ongoing Huntington’s pipeline milestones with Novartis — and PTCT looks like one of the more compelling risk-reward setups on the board right now.
If this is a trade you want to get in on, here’s how we’d play it. Below you’ll find our exact entry level, both price targets that imply 23%–38% potential upside, and the stop-loss we’re using to manage the downside.
Recommended Trade Setup
| Item | Detail |
|---|---|
| Buy Level | Above approximately $87.00 |
| Price Target 1 | $107.00 — Potential upside: 23% |
| Price Target 2 | $120.00 — Potential upside: 38% |
| Timeframe | Next 3–6 months |
| Stop-Loss | $76.00 on a closing basis |
| Trade Invalidation | Void if price hits stop-loss before entry triggers |
If needed, swipe or scroll sideways to view the full table.
For a risk of approximately $11.00 per share, the target rewards are about $20.00 and $33.00 per share. That makes this roughly a 1:2 and 1:3 risk-reward trade. In other words, the setup offers nearly 2x to 3x more potential upside than downside.
Note on Trade Invalidation: This recommendation stays active as long as the technical structure holds. If PTCT drops to or below the $76.00 stop-loss before the $87.00 entry triggers, the trade is automatically void — the support underpinning the thesis would have broken, and the risk-reward setup would no longer justify entry.
Happy Trading!
Tara and Greg
🥈 Almost Made the Cut
Today’s featured trade, PTC Therapeutics (NASDAQ: PTCT), was our top pick of several breakout candidates we evaluated. The following two stocks were strong candidates that made it to the final round — they came up just short of the top spot, but remain on our watchlist and could be featured soon:
dLocal Limited (NASDAQ: DLO) — The emerging-markets payments specialist keeps strengthening its case after a strong first quarter, robust 2026 guidance, and inclusion in the Russell 2000 and 3000 indices, which adds passive institutional demand. Management has paired accelerating payment-volume growth with a $300 million buyback and a new dividend, and the stock recently completed a bullish breakout from a multi-month consolidation on rising volume — with August 13 earnings as the next potential catalyst.
CrowdStrike Holdings (NASDAQ: CRWD) — One of the highest-quality growth franchises in cybersecurity, CrowdStrike continues to benefit from enterprise spending on AI-powered security and zero-trust architecture, with its recent 4-for-1 split broadening the investor base and its AI Detection and Response platform gaining traction. The trend remains firmly intact heading into late-August earnings, though the technical position is somewhat more extended than our top pick.
