
We flagged Rocket Lab Corporation (NASDAQ: RKLB) in our breakout watchlist a few weeks back. The stock has since broken out of a multi-month symmetrical triangle on massive volume, is up 20.3% from our initial recommended buy price, and looks headed even higher from here.
As we’ll get to just ahead, the combination of a record-breaking Q1 earnings beat and largest-ever launch contract, accelerating Neutron rocket program milestones, and a fresh technical breakout makes RKLB one of the more interesting setups on the board. Here’s what’s going on…
The Themes Behind the Move
Rocket Lab is a vertically integrated space company that designs and launches rockets — most notably its workhorse Electron small-lift rocket and the upcoming Neutron medium-lift rocket — while also building satellites, spacecraft components, optical systems, and on-orbit management solutions for commercial, civil, and defense customers in the U.S., Canada, Japan, and internationally.
In plain English, when a company, government, or defense agency needs to put a satellite in space — for telecom, Earth observation, or national security — Rocket Lab is one of the very few firms in the world that can deliver that capability end-to-end. Its business hinges on launch cadence, the on-time arrival of Neutron, and its ability to keep winning high-value defense and commercial contracts in an increasingly crowded launch market.
RKLB’s latest move reflects a powerful confluence of developments — commercial, operational, and strategic — that have come together in rapid succession to fundamentally reframe the company’s near-term growth trajectory.
| Theme / Catalyst | What Happened | Why Traders Care |
|---|---|---|
| Largest-ever launch contract + record Q1 | On May 7, Rocket Lab announced its largest-ever launch contract — a confidential customer booked 5 dedicated Neutron and 3 Electron missions baselined 2026–2029 — alongside record Q1 2026 results: revenue of $200.3 million (+63.5% YoY, beating estimates) and backlog surging to a record $2.2 billion (+20.2% QoQ and more than doubled YoY). | This validates RKLB’s vertical integration strategy and proves there’s real, contracted demand for both small-lift (Electron/HASTE) and medium-lift (Neutron) capabilities — not just hype. |
| Neutron “Path to Flight” | Rocket Lab’s medium-lift Neutron rocket is racing toward a maiden flight targeted for Q4 2026. Hitting that window is essential for the company to remain eligible for Year 1 NSSL Phase 3 contracts — the U.S. Space Force’s National Security Space Launch program. | Qualifying for NSSL Phase 3 would unlock a steady stream of high-margin government launches, putting RKLB in a tier of reliability currently dominated by SpaceX. |
| Sector tailwinds | BryceTech and Novaspace forecast an annual average of 3,100 spacecraft deployments through 2028, driven by LEO mega-constellation buildouts (Amazon’s Kuiper, China’s Honghu, the EU’s IRIS², and sovereign defense networks). U.S. defense and Space Force spending on hypersonics and resilient satellite architectures is also accelerating. | Demand for orbital launch services is structurally rising regardless of macro volatility. RKLB’s vertically integrated model — Electron + Neutron + space systems — positions it as a “one-stop” alternative to pure-play launchers and oversubscribed foreign providers. |
| Strengthened balance sheet | RKLB ended Q1 2026 with roughly $1.38 billion in cash, low debt of ~$139 million, and a current ratio of 4.47. TTM revenue stands at $679.58 million, with Q2 2026 guidance of $225–240 million — above prior street expectations. | Ample runway to fund the Neutron capex cycle without an immediate need to dilute. Revenue is growing 60%+ YoY and management is raising guidance, not cutting it. |
| Analyst coverage | Among the 17 analysts covering RKLB, the average 12-month price target sits at $90.00, with a high of $120.00 and a low of $50.00. Recent moves include TD Cowen raising its target from $90 to $120 (May 8), Citizens maintaining Market Outperform, and Stifel/Roth reiterating Buy with $100–105 targets. | The high end of the target range is right at the breakout level, and the steady drumbeat of fresh upgrades around the breakout suggests Wall Street is racing to catch up to the new fundamentals. |
| Market conviction signal | The breakout move came on ~79.93 million shares — multiples of average daily volume — and pushed RKLB up +34% in a single session, well past the consensus analyst price target. TD Cowen, Citizens, Stifel, and Roth all reiterated or raised ratings around the move. | When a stock breaks out on enormous volume, trades through Wall Street’s consensus target, and pulls fresh upgrades in the same week, that’s a rare tape signal that institutional money is buying conviction — not waiting for permission. |
| Upcoming triggers | Traders are watching Q2 2026 earnings (late July/early August), the Neutron maiden flight targeted for Q4 2026, a record cadence of 20+ Electron/HASTE missions through year-end, possible Victus Haze (TacRS) defense mission activity in the June/July window, and integration of the recently closed Mynaric (laser optical comms) and pending Motiv Space Systems (robotics) acquisitions. | A staggered set of high-conviction catalysts — earnings, launches, defense missions, and M&A integration — each of which can independently move the stock through year-end. |
If needed, swipe or scroll sideways to view the full table.
Put it all together, and RKLB is looking less like a speculative pre-revenue space stock and more like a commercially executing space infrastructure franchise with record contracted backlog, accelerating launch cadence, and a fortified balance sheet underwriting the next leg of growth.
The story is getting stronger by the week, but the chart is what could determine whether this move has more room to run in the near term. Here are the bullish technical signals traders should be watching now.
Bullish Technical Signals
#1 Symmetrical Triangle Pattern Breakout: RKLB has broken out of a symmetrical triangle on the daily chart, a pattern defined by converging trendlines connecting a series of lower highs and higher lows, reflecting a classic compression of supply and demand. The breakout arrived on notably elevated volume (~79.93M), confirming genuine institutional participation rather than a low-conviction drift.
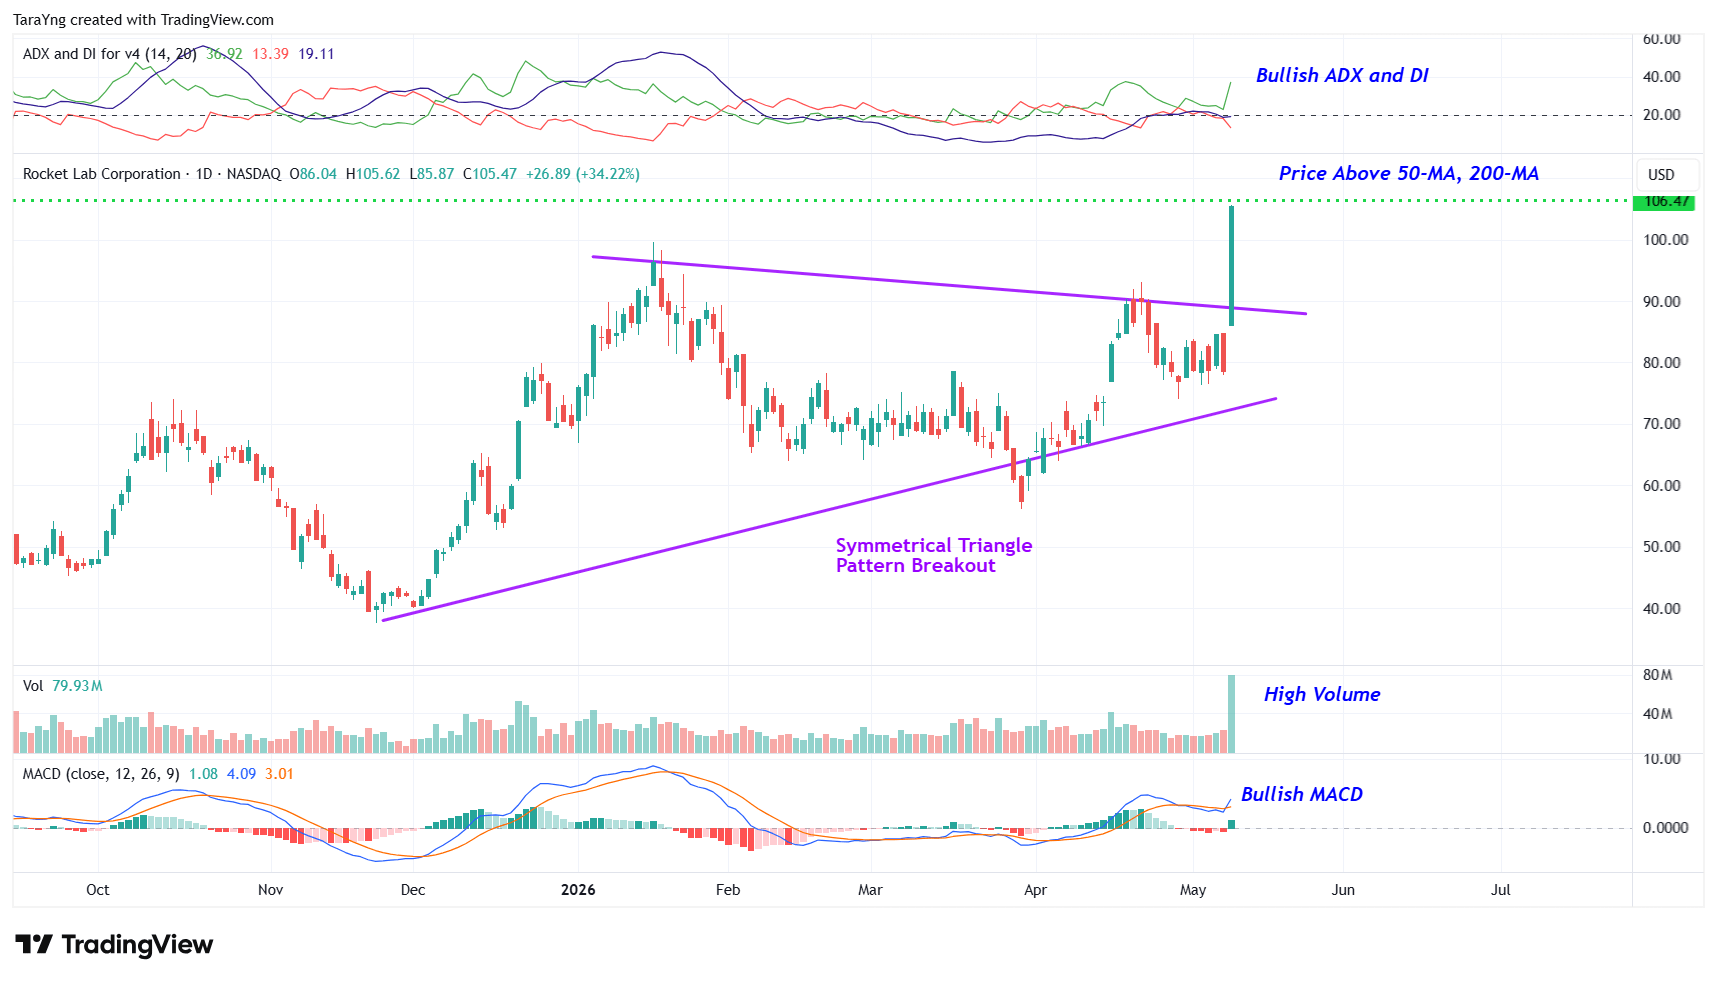
RKLB – Daily Chart
#2 Price above MAs: RKLB is trading above both the 50-day and 200-day SMAs, a structurally bullish configuration that reflects strength across both the near- and long-term timeframes. Price above the 200-day SMA confirms the macro uptrend remains intact, while price above the 50-day SMA signals short-term momentum is aligned with that larger trend. Crucially, both MAs now function as dynamic support levels beneath price, meaning any pullback has a natural floor before the broader trend reasserts itself.
#3 MACD Above Signal Line: On the daily chart, the MACD line has crossed above the signal line, a classic bullish crossover that signals short-term momentum is now accelerating faster than its longer-term baseline. Equally important is the position of this crossover: it’s occurring just above the zero line, meaning the signal is backed by positive absolute momentum, not just a relative shift. This isn’t a recovering signal from deeply negative territory — it’s momentum building from a position of strength, which historically carries greater follow-through potential.
#4 Bullish ADX: The ADX indicator shows that the +DI line has crossed above the –DI line, confirming that buyers are firmly in control of trend direction. More significantly, the ADX line itself is turning higher from a low base, a setup that often marks the early stages of a trend rather than its exhaustion. Because ADX measures trend strength independent of direction, a rising ADX from low levels is a particularly meaningful signal: it suggests the market is transitioning from indecision into a directional move with room to run.
#5 Above Support Area: Zooming out to the weekly chart, RKLB has launched higher from a key resistance-turned-support level at approximately $84.45 (marked by the pink dotted line). This zone previously acted as a ceiling, and the market’s ability to reclaim and hold it as a floor reflects a meaningful shift in market structure — former sellers have become buyers. The stock is also holding above its 50-week and 200-week SMAs, confirming that the long-term trend remains bullish and that the broader institutional bid is still present beneath the price.
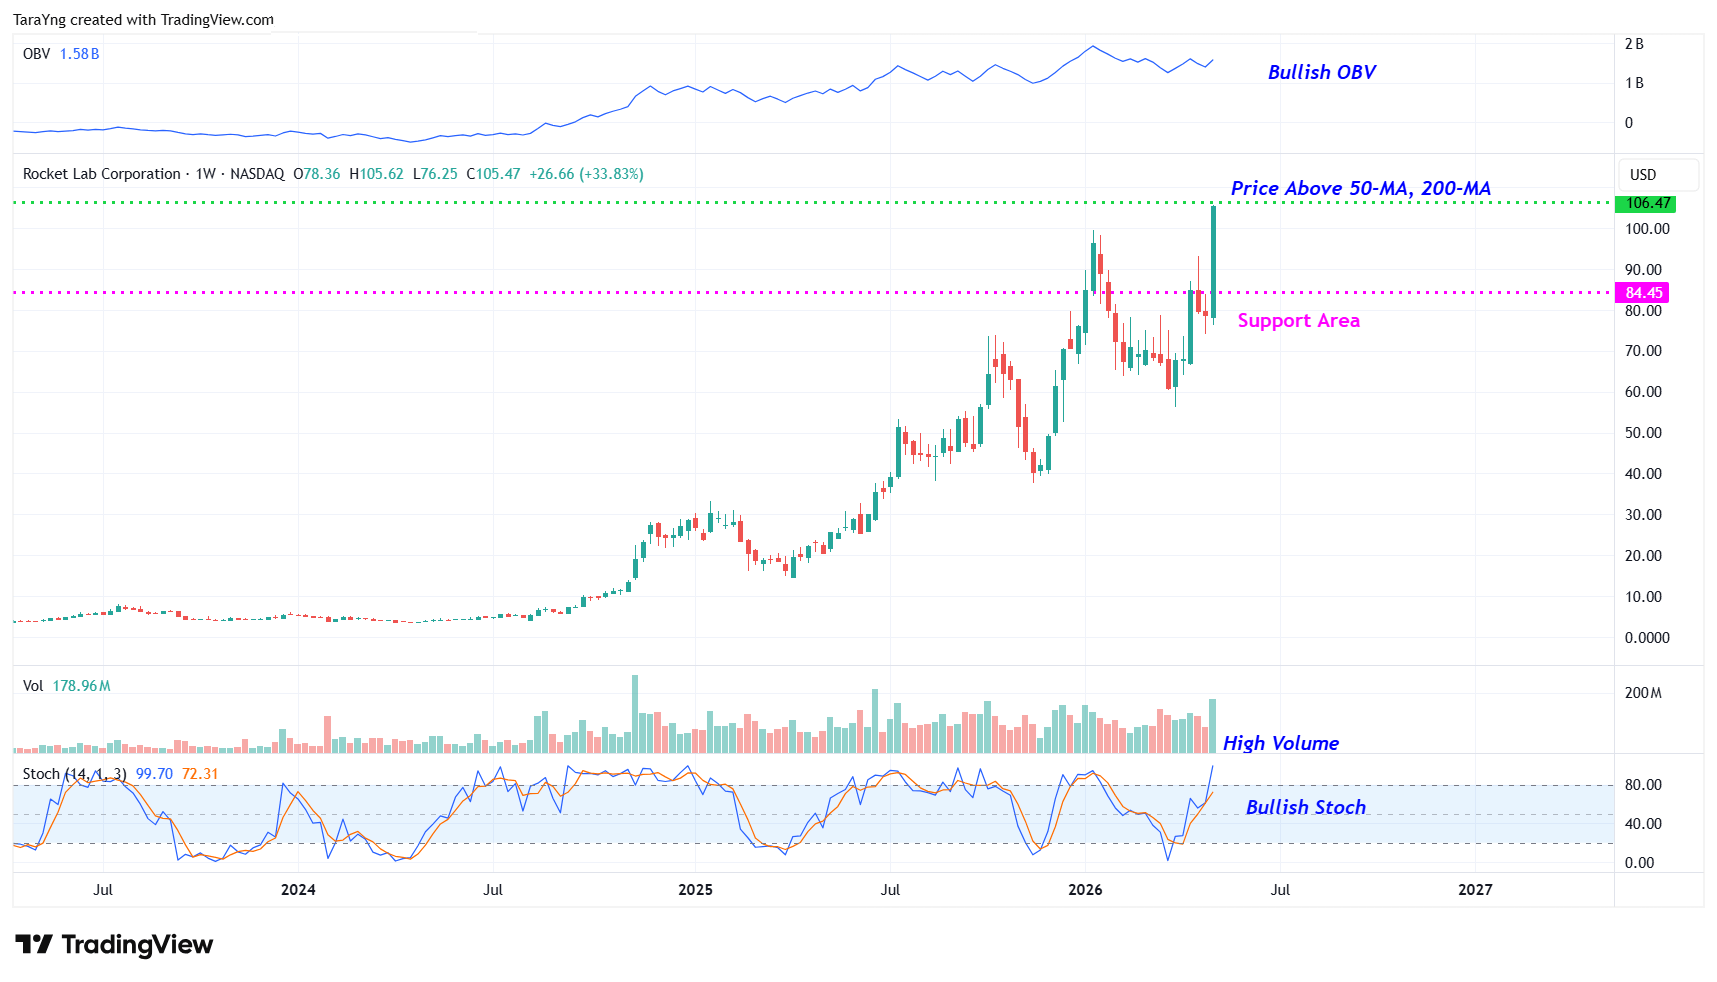
RKLB – Weekly Chart
#6 Bullish Stochastic: The %K (blue) line of stochastic has crossed above the %D (orange) line on the weekly chart. This suggests that buyers are taking control, signaling a potential price increase. The crossover is emerging after the oscillator spent time in oversold territory, suggesting the prior pullback has run its course and that a fresh momentum cycle to the upside may be underway. Weekly-timeframe stochastic signals carry more weight than daily, making this a meaningful longer-term buy cue.
#7 Positive OBV: The weekly OBV (On-Balance Volume) continues to trend higher, reflecting that volume on up weeks is consistently outpacing volume on down weeks. Since OBV tracks the net flow of money into and out of a stock, a rising OBV tells you that smart money is quietly accumulating even during price consolidations. The sustained uptrend in OBV across this entire chart history suggests the underlying demand structure is healthy and that any price strength is likely to be supported by genuine volume conviction.
Risks to Consider
Even strong setups can fail, especially in a high-growth space-tech name like Rocket Lab. A few things could knock the stock off course:
- A breakdown back below the symmetrical triangle breakout level on heavy volume
- Negative company-specific news or broader market weakness — the recent reassessment of AI/hyperscaler spending in Q1 2026 has already pressured innovation stocks, including space-tech names
- Neutron schedule risk — any delay beyond the October 2026 window would jeopardize NSSL Phase 3 eligibility, a major revenue pillar for the late 2020s, and first-stage reusability is only targeted on flight 2
- Continued unprofitability with ongoing Neutron capex — sustained delays could force an additional capital raise in a potentially high-interest-rate environment
- Valuation premium — RKLB is currently trading above the $90.00 average analyst price target, making it vulnerable to near-term profit-taking
- Direct competition from Firefly Aerospace (which IPO’d in August 2025) and continued pricing pressure from SpaceX’s Transporter rideshare missions on the small-launch segment
- Execution risk on Q2 2026 guidance of $225–240 million — any shortfall could undermine the “scale-up era” thesis driving the recent move
- Regulatory or contract-related risks around NSSL Phase 3 timing and the broader U.S. Space Force procurement cycle
The Bottom Line
RKLB is breaking out of a multi-month symmetrical triangle on the daily chart while bouncing cleanly off a resistance-turned-support level on the weekly — a dual-timeframe technical setup that historically signals the start of a sustained move higher.
The fundamental story underneath the chart is just as strong: a record Q1 revenue beat at +63.5% YoY, the largest-ever launch contract in company history, and a $2.2 billion backlog that more than doubled year-over-year — all underwritten by $1.38 billion in cash.
Combine that with multiple regulatory and commercial catalysts staggered through year-end — Q2 earnings, the Neutron maiden flight, NSSL Phase 3 eligibility, and a record Electron launch cadence — and RKLB looks like one of the more compelling risk-reward setups on the board right now.
If this is a trade you want to get in on, here’s how we’d play it. Below you’ll find our exact entry level, both price targets that imply 15%–22% potential upside, and the stop-loss we’re using to manage the downside.
Recommended Trade Setup
| Item | Detail |
|---|---|
| Buy Level | Above approximately $106.50 |
| Price Target 1 | $122.00 — Potential upside: 15% |
| Price Target 2 | $130.00 — Potential upside: 22% |
| Timeframe | Next 2–5 months |
| Stop-Loss | $98.50 on a closing basis |
If needed, swipe or scroll sideways to view the full table.
For a risk of approximately $8.00 per share, the target rewards are about $15.50 and $23.50 per share. That makes this roughly a 1:2 and 1:3 risk-reward trade. In other words, the setup offers nearly 2x to 3x more potential upside than downside.
Happy Trading!
Tara and Greg
Source: TradesOfTheDay.com
