
Super Micro Computer, Inc. (NASDAQ: SMCI) was on our watchlist this past April — and the stock has since broken out powerfully and looks headed even higher.
As we’ll get to just ahead, the combination of a blowout earnings beat with record-setting guidance, a major DOJ overhang that just got significantly defused, and a fresh technical breakout makes SMCI one of the more interesting setups on the board. Here’s what’s going on…
The Themes Behind the Move
Super Micro Computer designs, builds, and sells high-performance server and storage systems — including liquid- and air-cooled AI server racks, blade systems, storage arrays, and edge/IoT platforms — that power data centers running today’s largest AI workloads.
In plain English, SMCI is one of the key “picks-and-shovels” suppliers of the AI buildout. Its business hinges on hyperscaler demand for GPU-packed servers, its leadership position in direct liquid cooling (DLC) — which is increasingly required for the next generation of power-hungry AI chips — and how quickly it can ship those integrated rack solutions versus competitors like Dell and HPE.
SMCI’s latest move reflects a confluence of developments — financial, legal, and strategic — that have come together in rapid succession to fundamentally reset the bull case after months of overhang-driven pressure.
| Theme / Catalyst | What Happened | Why Traders Care |
|---|---|---|
| Fiscal Q3 2026 Beat & Blowout Guidance | On May 5, SMCI reported a significant EPS beat of $0.84 vs. $0.62 expected — a 35% beat. Revenue of $10.2 billion (up 123% YoY) missed on supply chain delays, but Q4 guidance of $11B–$12.5B crushed the Street’s $11.07B estimate. Gross margins climbed to 10.1% from 6.4% last quarter. | The market cared less about the revenue miss and more about margin recovery and record-setting Q4 guidance. A gross margin rebound from 6.4% to 10.1% in one quarter suggests the aggressive price-cutting phase may be over — a major narrative shift for a stock that had been punished on profitability concerns. |
| DOJ Investigation Clarification | Management explicitly addressed the ongoing DOJ investigation, stating SMCI is not a target or defendant of the grand jury. Internal findings suggest no additional employee involvement beyond those named in the March indictment. The company is cooperating and has placed implicated individuals on leave or terminated contractors. | The “smuggling” narrative — U.S. AI servers being diverted to China — had been the primary weight on the stock, with real fears around potential delisting or sanctions. This clarification significantly lowered the immediate tail risk that had been priced in, even if it doesn’t represent total legal clearance. |
| Silicon Valley Campus Expansion & New AI Platforms | On Apr 27, SMCI announced its largest U.S. DCBBS facility — a 714,000+ sq ft campus in San Jose — to scale domestic AI data center manufacturing. The following day, it launched new Arm AGI CPU-based servers and OCP ORv3-compliant racks for next-gen AI/HPC workloads. | Domestic capacity expansion directly addresses export-control scrutiny while positioning SMCI to capture surging hyperscaler demand. The new Arm and OCP platforms broaden its addressable market beyond Nvidia-centric workloads. |
| Sector Tailwind: AMD’s AI Server Market Upgrade | Concurrent with SMCI’s earnings report, AMD raised its 2030 server CPU addressable market growth forecast to 35% annually — up from its prior estimate of 18% — citing sustained “Agentic AI” infrastructure demand. | This signal from a major semiconductor player confirms the AI infrastructure buildout is accelerating, not decelerating. For SMCI as a primary provider of liquid-cooled racks, a doubling of AMD’s growth estimate is a direct endorsement of the end-market it serves. |
| Analyst Coverage | Among the 17 analysts covering SMCI, the average 12-month price target is $37.43, with a high of $64.00 and a low of $22.00 — implying roughly 8% upside to the mean and as much as 85% upside on the high end from recent levels. | Analyst consensus targets are relatively modest given the stock’s recent move, which means the current setup is more of a technical momentum trade than a consensus call — and that the high-end targets have significant room above current levels for those willing to take a more aggressive view. |
| Fundamentals & Balance Sheet | Q3 revenue of $10.2B was up 123% YoY. Non-GAAP EPS of $0.84 beat by 35%. Net margin came in at 3.1% — tight but showing signs of a bottom. The company secured a $1.8 billion credit facility in Taiwan to address liquidity concerns stemming from its $7.5B net debt position. | The margin recovery is the key number here. If 10.1% gross margin holds or expands in Q4, the profitability narrative flips from a risk to a catalyst. The new credit facility shows management is proactively managing the balance sheet ahead of a high-growth quarter. |
| Upcoming Triggers | Traders are watching the May 26 lead plaintiff deadline for the securities fraud class action (expect legal headlines), Computex Taipei in June (new liquid-cooling partnership announcements expected), and August 4, 2026 Fiscal Q4 earnings — the “moment of truth” for whether the gross margin recovery is a trend or a one-off. | Multiple near-term events create a staggered catalyst pipeline. Computex announcements could accelerate partnership momentum, while the Q4 print in August will either confirm or challenge the new bull thesis on margins and revenue. |
If needed, swipe or scroll sideways to view the full table.
Put it all together, and SMCI is looking less like a troubled server company weighed down by legal overhangs and more like a high-growth AI infrastructure franchise in the early stages of a margin recovery — with the dominant liquid-cooling moat intact and a record backlog heading into its biggest revenue quarter ever.
The story is getting stronger, but the chart is what could determine whether this move has more room to run in the near term. Here are the bullish technical signals traders should be watching now.
Bullish Technical Signals
#1 Falling Wedge Pattern Breakout: SMCI had been carving out a falling wedge over the past several weeks, which is a pattern defined by converging trendlines with lower highs and lower lows, reflecting a controlled compression of selling pressure. Crucially, the stock has now broken above the upper trendline of that wedge, a classically bullish signal. Falling wedge breakouts indicate that sellers are exhausting their momentum while buyers begin to assert dominance. Think of it as a final squeeze before the spring releases, and today’s price action suggests that release is underway.
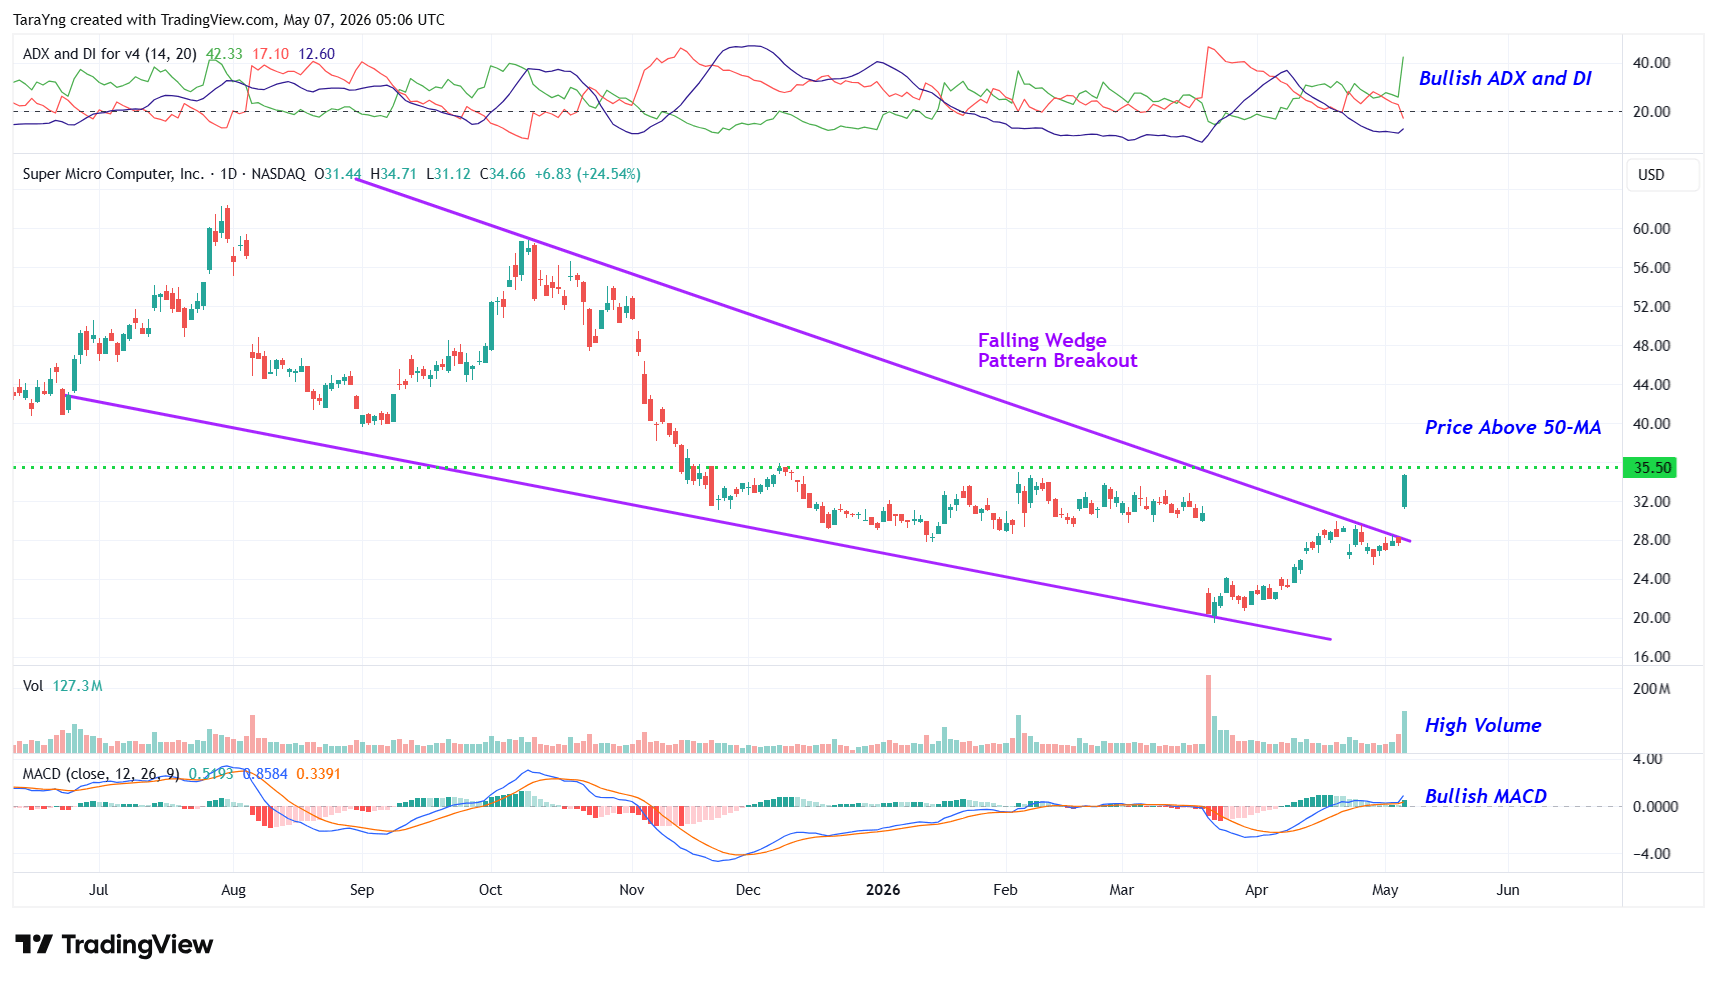
SMCI – Daily Chart
#2 Price Above MA: The stock is now trading above its 50-day Simple Moving Average, a meaningful near-term inflection point. This level is significant for two reasons: it confirms that bulls are regaining structural control of the trend, and the 50-SMA itself tends to act as a dynamic support floor, meaning any pullbacks toward it may offer favorable re-entry opportunities rather than signal renewed weakness.
#3 Bullish ADX: The directional system is flashing a clear trend-birth signal. The +DI line is riding above the –DI line, confirming buyers are controlling trend direction. The ADX line is also curling upward from below both DI lines, which is a tell-tale sign that the market is transitioning out of a low-volatility, range-bound phase and into an emerging directional trend. When ADX rises from a subdued base like this, it often marks the early innings of a sustained move rather than a temporary spike.
#4 Bullish MACD: The MACD line has crossed above the signal line on the daily chart. This bullish crossover indicates that short-term momentum is now outpacing longer-term momentum. The expanding histogram reinforces this, reflecting accelerating buying pressure beneath the surface. Historically, this type of crossover from a low base acts as an early-stage entry signal, suggesting the path of least resistance has shifted to the upside.
#5 Above Support Area: Zooming out to the weekly chart, SMCI recently tested and respected a key zone that had previously acted as resistance and has now converted to structural support (marked with the pink dotted line at approximately $27.03). The stock bounced cleanly off this level, which is a strong indication that institutional buyers are defending the floor.
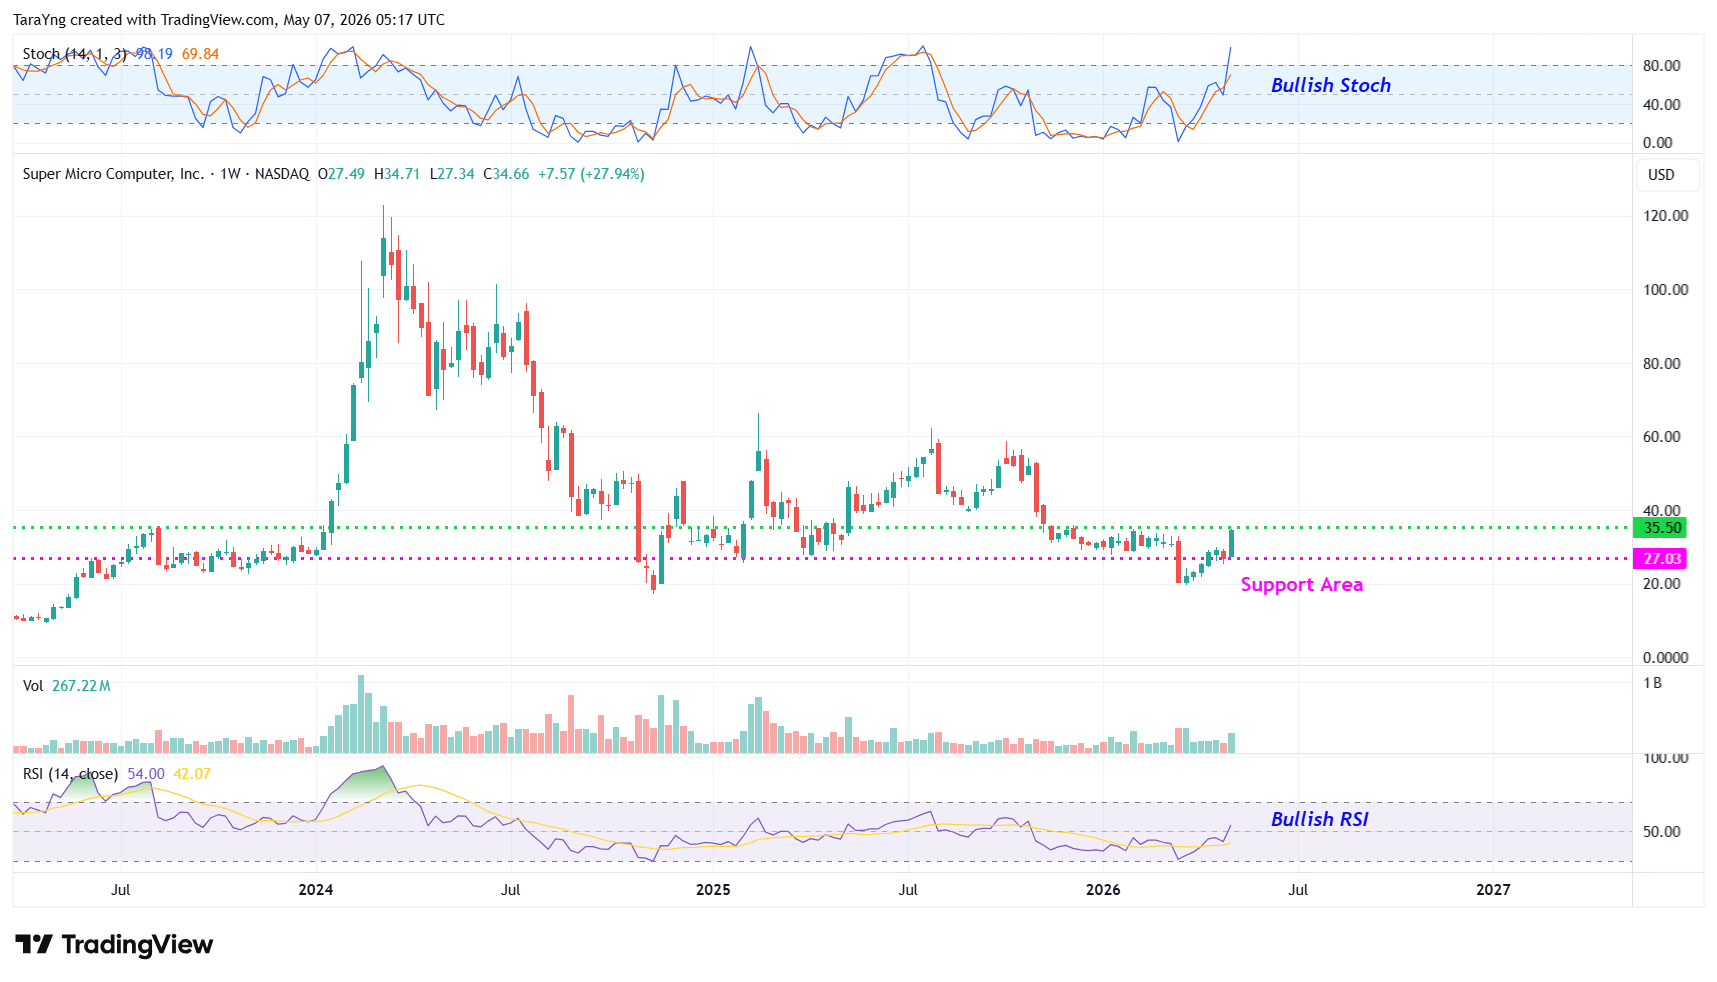
SMCI – Weekly Chart
#6 %K above %D: On the weekly stochastic, the %K line has crossed above the %D line while recovering from oversold territory, a particularly potent combination. A crossover alone is a momentum signal, but a crossover from oversold levels adds conviction: it suggests that selling pressure has been fully exhausted and buyers are stepping in with enough force to reverse the trend. On a weekly timeframe, this type of signal carries longer-term weight, pointing toward a sustained recovery rather than a short-term bounce.
#7 Bullish RSI: The weekly RSI has climbed above the 50 midline and continues to trend higher, which is a two-part confirmation. Crossing above 50 signals a shift in the balance of power from sellers to buyers. The continued upward trajectory means this isn’t just a reactive bounce; momentum is building, not stalling. On a weekly chart, an RSI that is rising through 50 with room to run toward 60–70 historically aligns with the early-to-mid stages of meaningful price recoveries.
Risks to Consider
Even strong setups can fail, especially in a high-beta momentum name like Super Micro Computer. A few things could knock the stock off course:
- A breakdown back below the falling wedge breakout level on heavy volume — this would invalidate the technical setup and likely trigger a swift reversal
- Negative company-specific news or broader market weakness that pressures high-beta tech and AI infrastructure names
- Ongoing DOJ overhang from the March 2026 indictment of co-founder Yih-Shyan “Wally” Liaw and two others for allegedly conspiring to divert ~$2.5 billion of AI servers to China — while the company is not charged, legal headlines around the May 26 lead plaintiff deadline could rattle sentiment
- Working capital and liquidity strain — SMCI carries a $7.5 billion net debt position and saw its cash conversion cycle double last quarter, a red flag that bears will continue to highlight
- Continued margin pressure — the 10.1% gross margin recovery is encouraging, but net margin remains thin at 3.1% and any reversion in Q4 would damage the bull thesis significantly
- Intense competition from Dell and HPE, both of which are aggressively scaling their AI server businesses and gaining share in a market that SMCI had largely dominated
- Export-control and regulatory risk — despite management’s reassurances, the broader geopolitical scrutiny around U.S. AI chip exports to China could trigger new restrictions that complicate SMCI’s supply chain or customer base
- Valuation volatility — at current prices, SMCI is priced for strong execution; any earnings miss or guidance cut could result in an outsized downside move given the stock’s high-beta nature
The Bottom Line
SMCI is breaking out of a multi-week falling wedge on the daily chart while bouncing cleanly off a resistance-turned-support level on the weekly — a dual-timeframe technical setup that historically signals the start of a sustained move higher.
The fundamental story underneath the chart is just as strong: a blowout Q4 guidance that crushed Street estimates, a gross margin recovery from 6.4% to 10.1% in a single quarter, and a DOJ clarification that significantly de-risked the most feared legal scenario.
Combine that with multiple near-term catalysts staggered through year-end — Computex announcements in June, the Q4 earnings print in August, and ongoing domestic capacity expansion — and SMCI looks like one of the more compelling risk-reward setups on the board right now.
If this is a trade you want to get in on, here’s how we’d play it. Below you’ll find our exact entry level, both price targets that imply 32%–55% potential upside, and the stop-loss we’re using to manage the downside.
Recommended Trade Setup
| Item | Detail |
|---|---|
| Buy Level | Above approximately $35.50 |
| Price Target 1 | $47.00 — Potential upside: 32% |
| Price Target 2 | $55.00 — Potential upside: 55% |
| Timeframe | Next 3–6 months |
| Stop-Loss | $29.00 on a closing basis |
If needed, swipe or scroll sideways to view the full table.
For a risk of approximately $6.50 per share, the target rewards are about $11.50 and $19.50 per share. That makes this roughly a 1:2 and 1:3 risk-reward trade. In other words, the setup offers nearly 2x to 3x more potential upside than downside.
Happy Trading!
Tara and Greg
Source: TradesOfTheDay.com
