
FuelCell Energy, Inc. (NASDAQ: FCEL) just had a powerful breakout and looks headed even higher.
In short, the combination of AI-driven power demand, manufacturing scale-up, improving commercial momentum, and a fresh technical breakout makes it one of the more interesting setups on the board.
Here’s what’s going on…
The Themes Behind the Move
FuelCell builds fuel-cell systems that generate reliable, always-on power. In plain English, it makes on-site power solutions that can help data centers, utilities, and industrial users get electricity without waiting on the traditional grid — which is exactly why the stock is starting to get fresh attention in the AI era.
FCEL’s latest surge doesn’t appear to be about one single headline. Instead, traders seem to be reacting to a broader set of themes that have been building underneath the story…
| Theme / Catalyst | What Happened | Why Traders Care |
|---|---|---|
| AI power demand | FuelCell launched a new 12.5 MW utility-scale power solution aimed at data centers. | It ties FCEL directly to one of the market’s hottest themes: how to power AI infrastructure. |
| Manufacturing scale-up | The company plans to expand manufacturing capacity in Torrington, CT from about 100 MW to 350 MW annually. | It suggests management is preparing for much larger demand rather than just talking about it. |
| Pipeline growth | Management said the business-development pipeline grew roughly 275% YoY, with more than 80% tied to digital infrastructure and data centers. | That helps frame FCEL as an emerging AI power story, not just a generic clean-energy stock. |
| Commercial traction | Q1 revenue rose about 61% YoY to roughly $30.5M, and net losses came in better than expected. | It gives traders evidence that there is at least some real business momentum underneath the narrative. |
| Financing support | FuelCell teamed with SDCL to co-develop up to 450 MW of distributed power projects. | That helps address one of the market’s long-running concerns: how the company funds larger-scale growth. |
| Aggressive options flow | Large bullish call sweeps showed up as the stock accelerated higher. | It suggests traders were pressing the upside story in a big way as momentum built. |
If needed, swipe or scroll sideways to view the full table.
Put it all together, and FCEL starts to look less like just another volatile clean-energy name and more like a stock being pulled into the AI infrastructure power trade.
The story may be getting stronger, but the chart is what could determine whether this move has real staying power. Here are the bullish technical signals traders should be watching now.
Bullish Technical Signals
#1 Symmetrical Triangle Pattern Breakout: The daily chart shows that the stock has broken out of a Symmetrical Triangle pattern, which is marked as purple lines. The stock has also broken above converging trend lines with high volume. The previous consolidation now may now act as support levels.
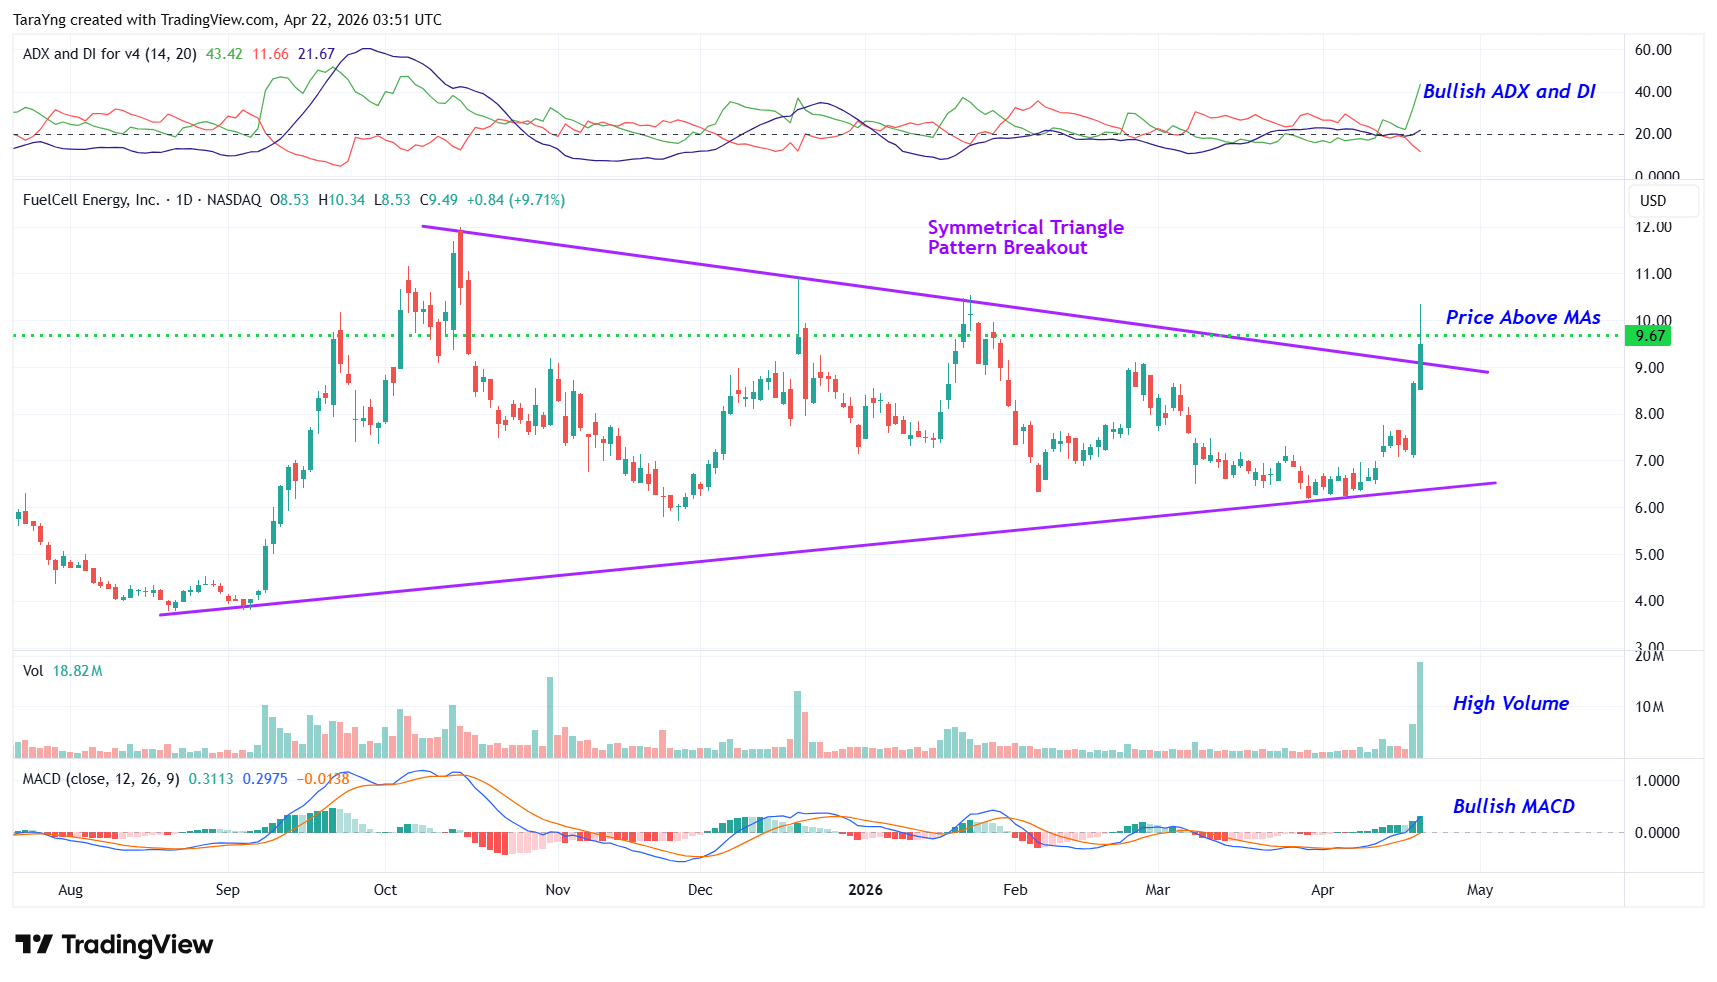
FCEL – Daily Chart
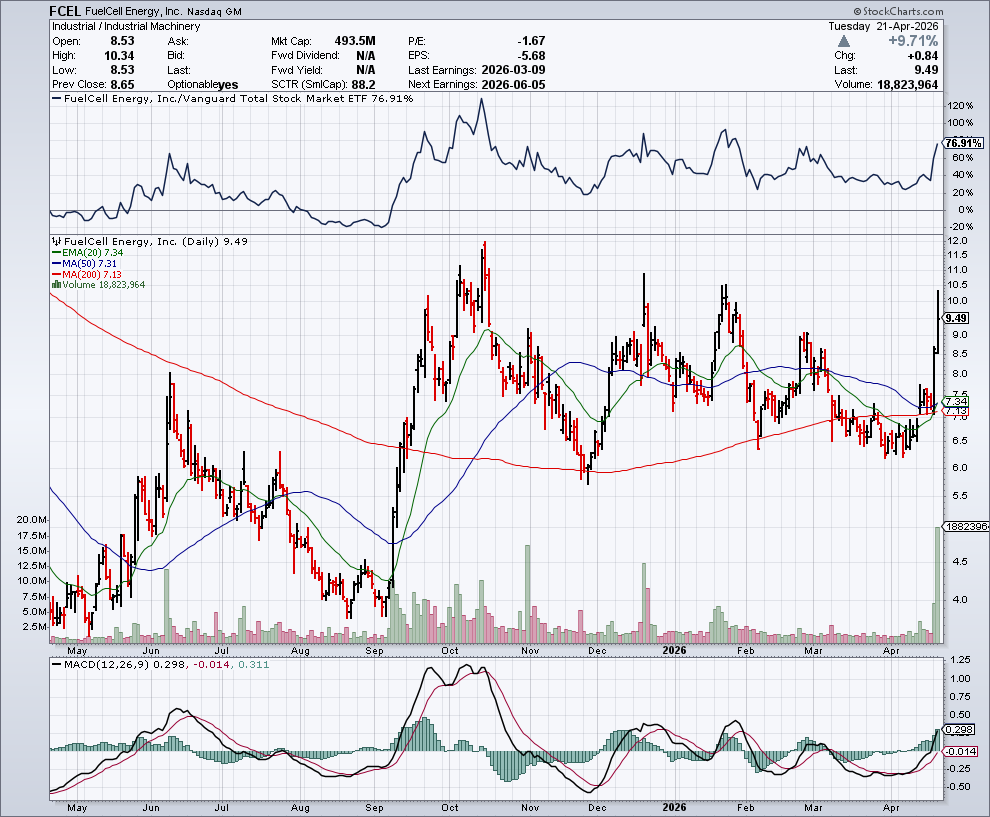
#2 Price above MAs: The price is currently above the short-term moving average of 50-day SMA as well as the longer-term moving average of 200-day SMA. Bullish alignment confirms uptrend control by buyers. MAs also act as dynamic support levels.
#3 MACD Above Signal Line: In the daily chart, the MACD line (light blue color) is currently above the MACD signal line (orange color). The histogram shows positive momentum acceleration. Bullish crossover confirms upside potential.
#4 Bullish ADX: The ADX indicator shows that the +DI line is currently above the –DI line, and the ADX line has started to move up from below the –DI and +DI lines. This indicates strengthening directional momentum. This suggests sustained uptrend establishment.
#5 Above Support Area: As you can see from the weekly chart, the stock has currently moved up from a resistance-turned-support level. This level is marked as a pink dotted line. Stocks trading elevated above the former resistance-turned-support level typically shows strong foundation for further upside potential. Weekly close above this level confirms buyer control. The price is also solidly above 50-week SMA, confirming bulls firmly in control on intermediate-term basis. All these suggest trend sustainability.
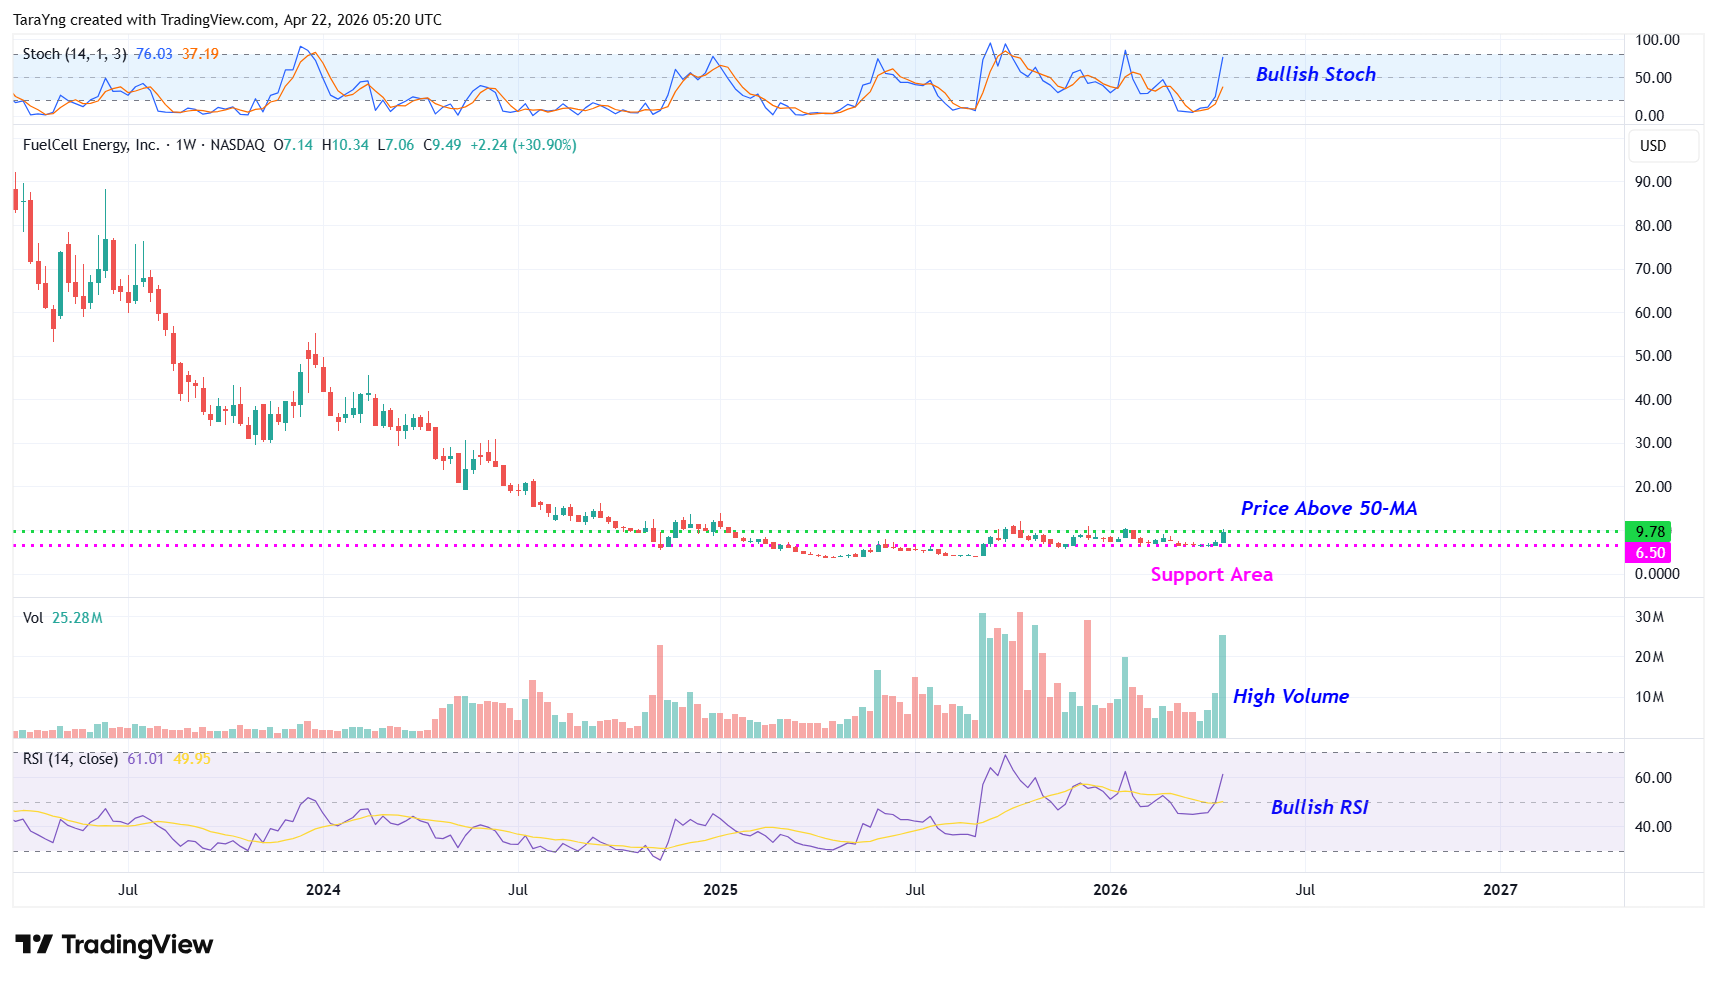
FCEL – Weekly Chart
#6 %K above %D: The %K (blue) line of stochastic has currently crossed above the %D (Orange) line in the weekly chart, crossing from oversold territory. This indicates momentum resumption with room for further gains before overbought conditions.
#7 Bullish RSI: In the weekly chart, the RSI is currently above 50 and moving higher. This indicates shifting momentum toward buyers and sustained buying pressure.
Recommended Trade Setup
| Item | Detail |
|---|---|
| Buy Level | Above approximately $9.80 |
| Price Target 1 | $13.00 Potential upside: 33% |
| Price Target 2 | $16.00 Potential upside: 63% |
| Timeframe | Next 3–6 months |
| Stop-Loss | $7.90 on a closing basis |
If needed, swipe or scroll sideways to view the full table.
For a risk of approximately $1.90 per share, the target rewards are about $3.20 and $6.20 per share. That makes this roughly a 1:2 and 1:3 risk-reward trade. In other words, the setup offers nearly 2x to 3x more potential upside than downside.
Risks to Consider
Even strong setups can fail, especially after a sharp move higher. A few things could knock FCEL off course:
- A breakdown back below the symmetrical triangle breakout level on heavy volume
- Negative company-specific news or broader market weakness that pressures high-beta clean-energy names
- Fresh regulatory or policy changes that hurt sentiment toward the sector
- The simple fact that FuelCell is still not generating positive gross margins — the company reported a $5.9 million gross loss in Q1, which shows manufacturing costs still exceed sales revenue
Happy Trading!
Tara and Greg
Source: TradesOfTheDay.com
