CoreWeave (CRWV) just had a strong breakout, and this setup could still have legs.
Yesterday, shares climbed about 3.5% after the company delivered the kind of announcement investors love to see: a giant customer doubling down in a big way. In other words, this wasn’t hype carrying the stock higher — it was a serious catalyst. Here’s what’s going on…
The Catalyst Behind the Breakout
CoreWeave is a cloud infrastructure company built for artificial intelligence workloads. In plain English, it provides the computing muscle needed to train and run AI models, making it one of the more direct ways to play the AI buildout.
The big catalyst behind the move was CoreWeave’s expanded long-term agreement with Meta Platforms, which the company announced on April 9. The new deal is valued at roughly $21 billion and runs through December 2032. Even better, it builds on a prior agreement worth about $14.2 billion, bringing total Meta commitments to more than $35 billion.
That’s not just another AI headline. It’s a major customer expanding its commitment in a very big way — and the market took notice.
Investors are constantly looking for companies with real, tangible exposure to AI spending, and CoreWeave clearly fits that theme. The company is also among the first to deploy NVIDIA’s Vera Rubin platform, which only strengthens the idea that this is a serious infrastructure player in one of the market’s hottest growth areas.
From a technical standpoint, the stock is now starting to confirm that bullish backdrop. CRWV has broken out of a symmetrical triangle pattern on strong volume, pushed above key moving averages, and reclaimed an important support area on the weekly chart.
That said, this is not a risk-free setup. CoreWeave also announced a $3.0 billion convertible note offering, which raises the possibility of short-term dilution and could create volatility along the way.
Still, right now the combination of a major AI catalyst, a bullish technical breakout, and continued investor appetite for AI infrastructure plays makes this one of the more interesting setups on the board.
The Meta deal may have sparked the move, but the technical setup is what could help sustain it. Here are the bullish technical signals traders should be watching now.
Bullish Technical Signals
#1 Symmetrical Triangle Pattern Breakout: The daily chart shows that the stock has recently formed a Symmetrical Triangle pattern. This is a continuation pattern and is characterized by two converging trend lines connecting a series of sequential peaks and troughs. This pattern is marked on the daily chart as purple lines. The breakout from a symmetrical triangle pattern usually signifies a bullish move. Currently, the stock has broken out of the symmetrical triangle pattern with high volume, which is a possible bullish sign.
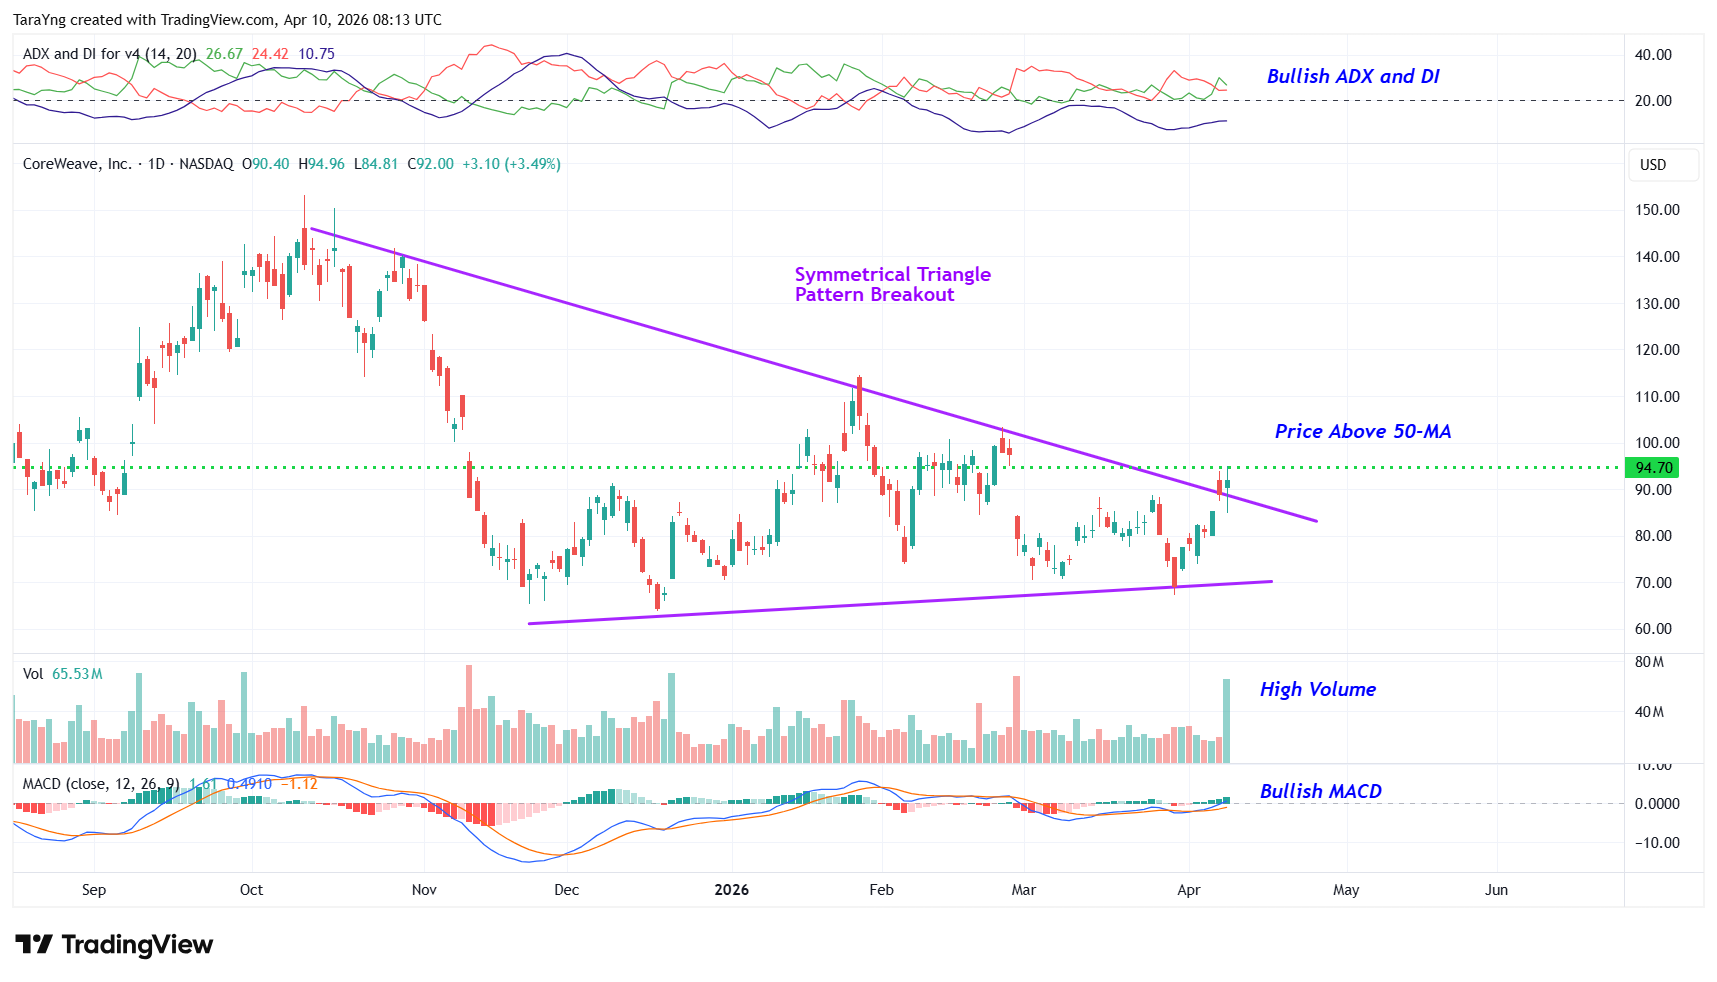
CRWV – Daily Chart
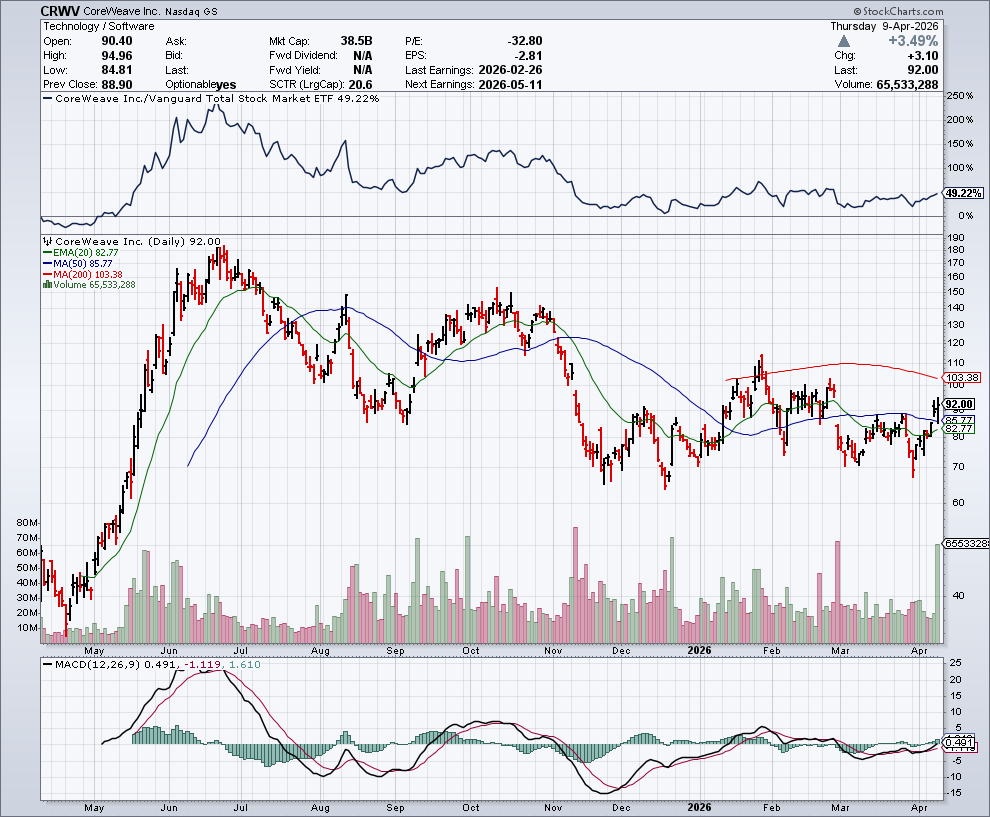
#2 Price above MAs: The price is currently above the short-term moving average of 50-day SMA as well as the longer-term moving average of 200-day SMA, indicating that the bulls are still in control. This is a positive indication.
#3 MACD Above Signal Line: In the daily chart, the MACD line (light blue color) is currently above the MACD signal line (orange color), which is typically considered bullish.
#4 Bullish ADX: The ADX indicator shows that the +DI line is currently above the –DI line, and the ADX line has started to move up from below the –DI and +DI lines. This indicates possible bullishness.
#5 Above Support Area: As you can see from the weekly chart, the stock has currently moved up from a resistance-turned-support level. This level is marked as a pink dotted line. This looks like a good area for the stock to move higher.
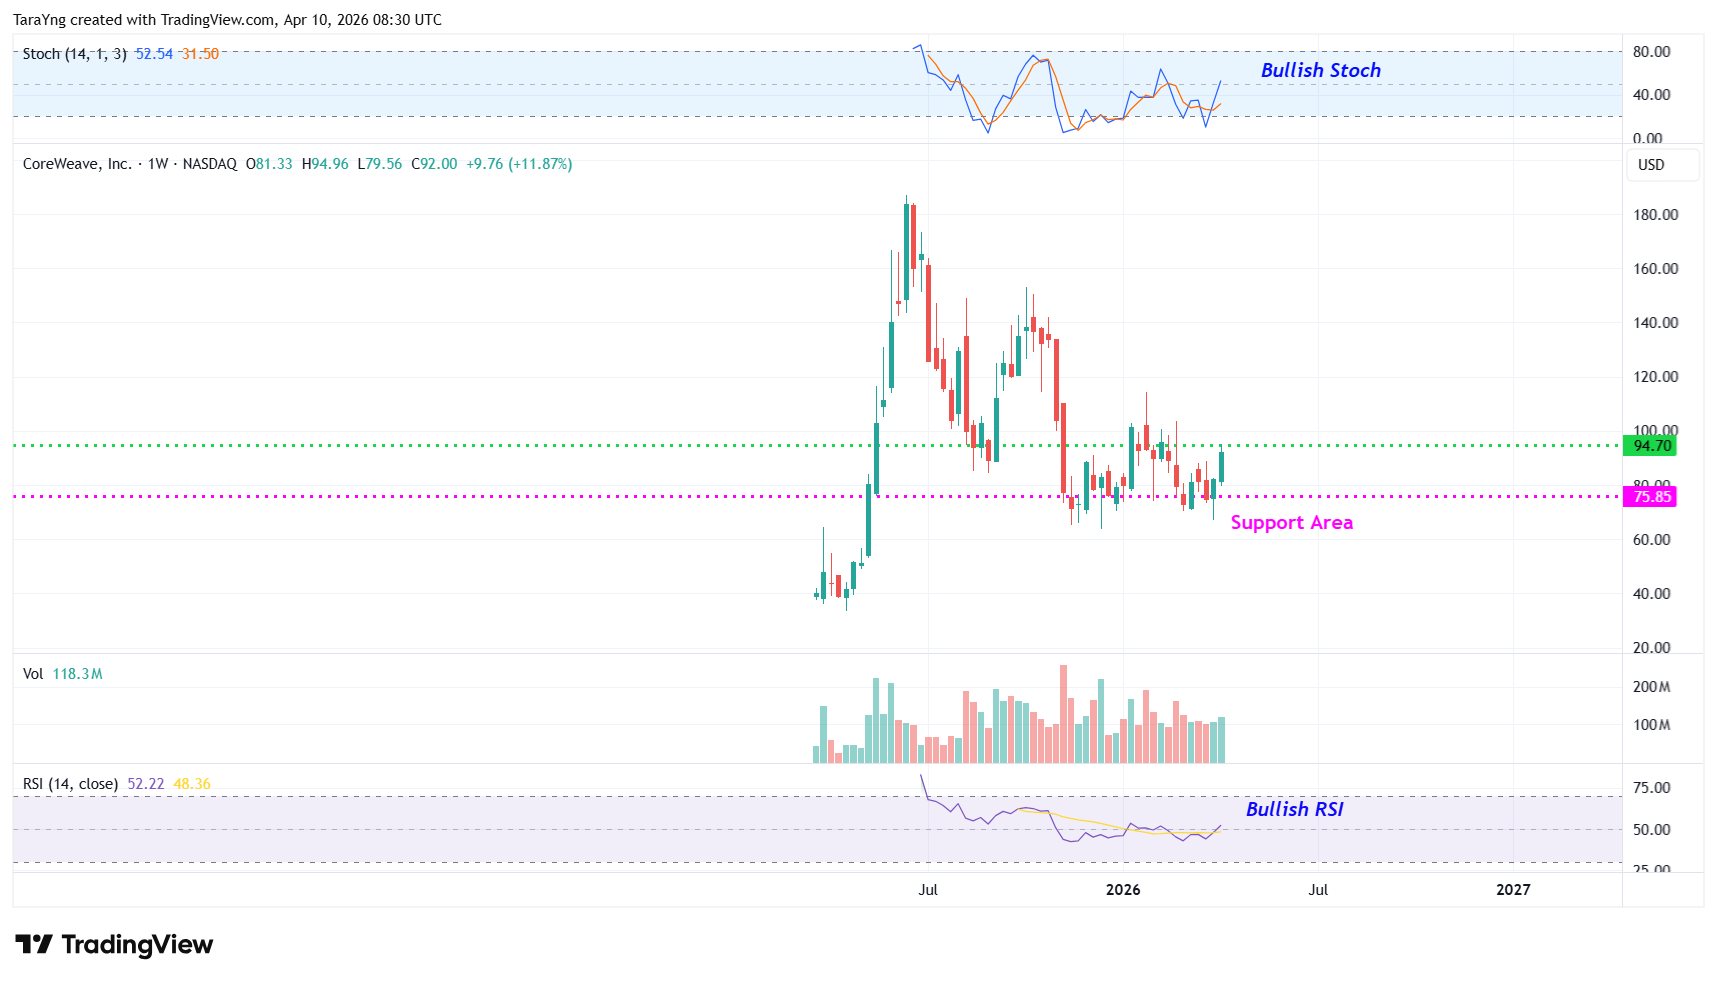
CRWV – Weekly Chart
#6 %K above %D: The %K (blue) line of stochastic has currently crossed above the %D (Orange) line in the weekly chart and is also moving higher from oversold levels. This is a possible bullish indication.
#7 Bullish RSI: In the weekly chart, the RSI is currently above 50 and moving higher. This is a possible bullish sign.
Recommended Trade (based on the charts)
Buy Levels: If you want to get in on this trade, you can purchase shares of CRWV above the price of around $94.70.
TP: Our target prices are $110.00 and $120.00 in the next 3-6 months.
SL: To limit risk, place a stop-loss at $87.00. Note that the stop-loss is on a closing basis.
Our target potential upside is 16% to 27% in the next 3 to 6 months.
For a risk of $7.70, our target rewards are $15.30 and $25.30. This is a nearly 1:2 and 1:3 risk-reward trade.
In other words, this trade offers nearly 2x to 3x more potential upside than downside.
Risks to Consider
The stock may reverse its overall trend if it breaks down from the symmetrical triangle pattern with high volume. The sell-off of the stock could also be triggered in case of any negative news, overall weakness in the market, or any regulatory changes in the sector.
Happy Trading!
Tara and Greg
P.S. CRWV caught our attention because of the breakout and the clear Meta-driven catalyst. The next step in our process is running the stock through our proprietary Alpha Signals rating system to see whether other factors — like unusual options activity, analyst momentum, or smart money accumulation — are starting to line up as well. That kind of alignment can turn an interesting setup into one of our highest-conviction ideas.
If you're buying rare earth or other critical mineral stocks, you're already one step behind - because we believe that political insiders in Washington are preparing to buy a whole new group of stocks, which could begin soaring 500%+ just days from now. The man once ranked in 2020 as America's #1 stock picker is doing something extraordinary and giving away the name and ticker of every single stock that could be next. Everything you need to know is here.
Source: Trades of the Day

