Picking a winning trade on a consistent basis is not simply a stroke of luck. It’s the result of calculated screening, planning, and deliberation.
With this in mind, we have started a new weekly series on our top 10 stocks to watch this week — stocks that look poised for a possible breakout in the coming days. Traders should add these stocks to their watchlist now.
The Top 10 Stocks to Watch This Week for Possible Breakouts
| Sl # | Name of the Stock | Stock Ticker | Last Close | Buy Level(s) | Reason |
| 1 | EchoStar Corp. | NASDAQ: SATS | $128.68 | $131.60 | Symmetrical Triangle Pattern Breakout |
| 2 | Stellantis N.V | NYSE: STLA | $7.55 | $7.70 | Falling Wedge Pattern Breakout |
| 3 | Firefly Aerospace Inc. | NASDAQ: FLY | $32.93 | $34.50 | Double Bottom Pattern |
| 4 | Intel Corp. | NASDAQ: INTC | $50.38 | $50.60 | Symmetrical Triangle Pattern Breakout |
| 5 | TripAdvisor Inc. | NASDAQ: TRIP | $10.85 | $11.20 | Downtrend Channel |
| 6 | Intuitive Machines Inc. | NASDAQ: LUNR | $23.99 | $24.30 | Symmetrical Triangle Pattern Breakout |
| 7 | Bitdeer Technologies Group | NASDAQ: BTDR | $9.35 | $9.50 | Falling Wedge Pattern Breakout |
| 8 | Replimune Group Inc. | NASDAQ: REPL | $8.41 | $8.50 | Symmetrical Triangle Pattern |
| 9 | Globalstar Inc. | NASDAQ: GSAT | $77.73 | $78.50 | Flag Pattern Breakout |
| 10 | Applied Optoelectronics Inc. | NASDAQ: AAOI | $103.91 | $105.30 | Symmetrical Triangle Pattern |
Important: Typically, these trades offer a risk: reward ratio of 1:2 or 1:3 in the next 6 months, which implies 2x to 3x rewards when compared to risks. So, be sure to set your stop-loss levels and target prices accordingly to manage your risk. In addition, these trade ideas are triggered using daily closing prices, not intra-day pricing. So, if you participate in these trades, make sure that you only buy the stock once its daily close is above the recommended price level.
That said, here are the top 10 stocks to watch for a breakout, in no particular order.
#1 EchoStar Corp. (NASDAQ: SATS)
Sector: Communication Services • Telecom Services
Reason: Symmetrical Triangle Pattern Breakout
A symmetrical triangle is a chart pattern formed by two converging trend lines connecting a series of sequential peaks and troughs. These two lines result in the formation of a triangle that appears to be symmetrical.
A symmetrical triangle pattern is usually formed when there is indecision in the price movements and there is uncertainty among the buyers and sellers. This chart pattern represents a period of consolidation before the price breaks out or breaks down. In case a breakout occurs from the upper trend line, it is a strong bullish indication as it signifies the start of a new bullish trend.
Buy Level(s): The stock has currently broken out of a symmetrical triangle pattern. However, the ideal buy level for SATS is if the stock closes above the immediate resistance level of $131.60. This is marked in the chart below as a green color dotted line.
Daily chart – SATS
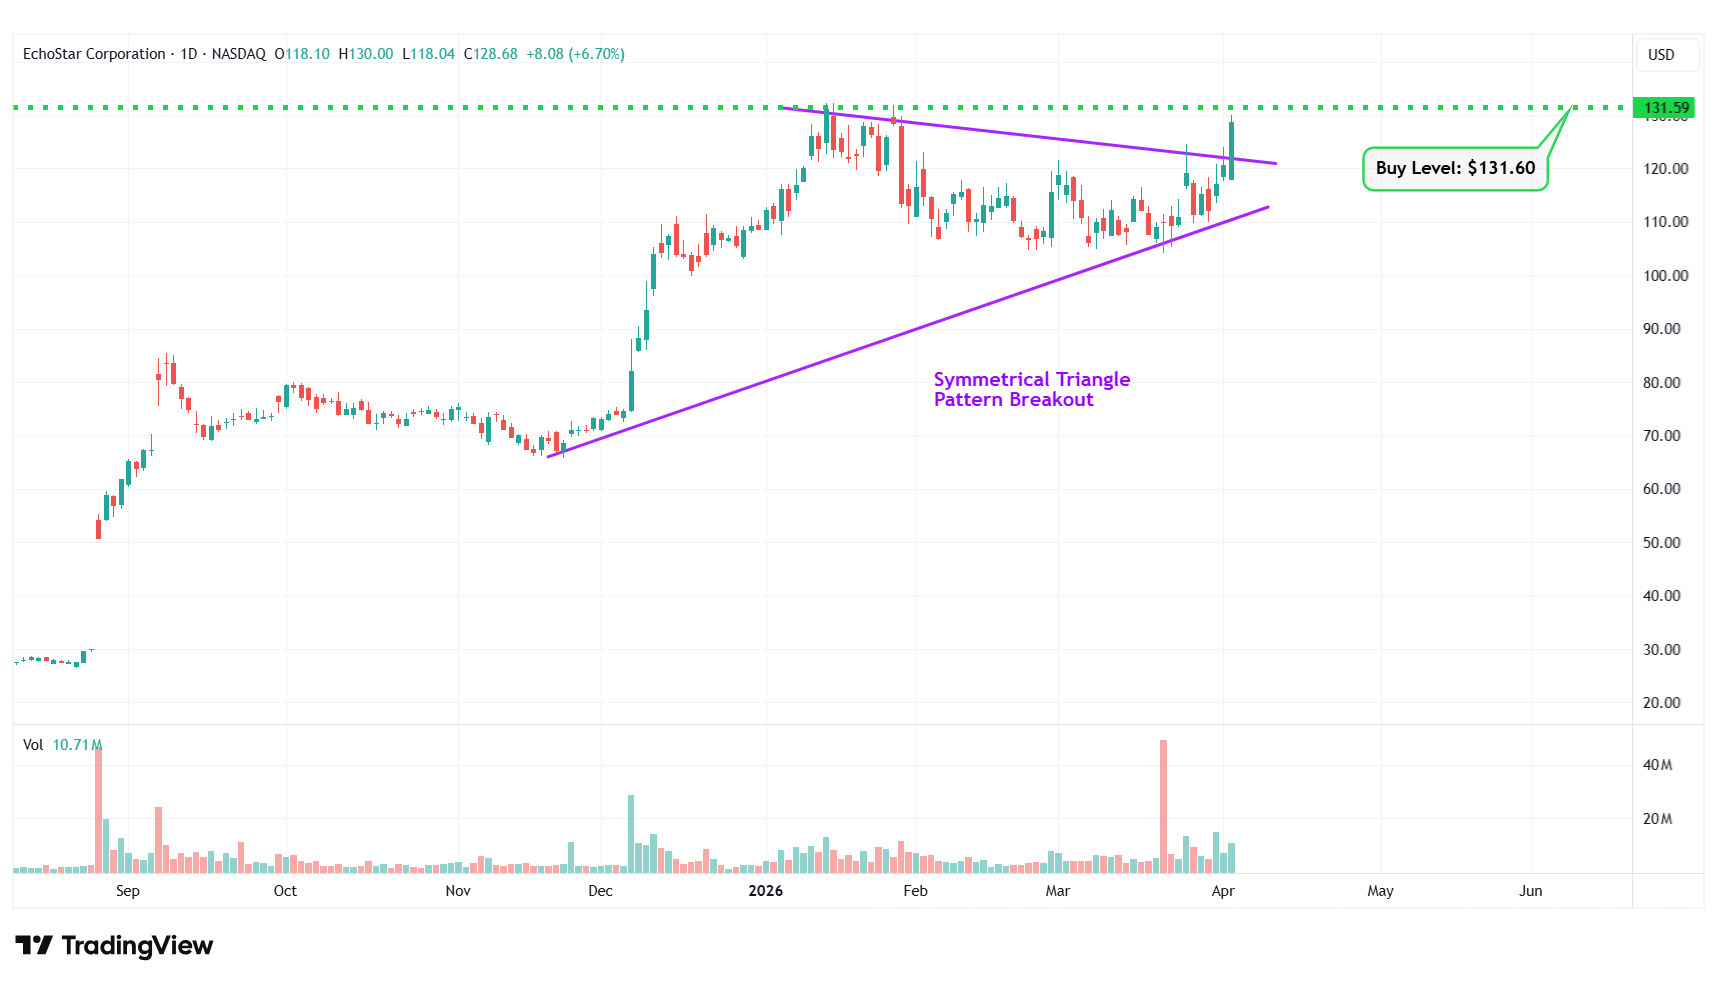
SATS – Symmetrical Triangle Pattern Breakout
#2 Stellantis N.V (NYSE: STLA)
Sector: Consumer Cyclical • Auto Manufacturers
Reason: Falling Wedge Pattern Breakout
A falling wedge pattern is formed by joining two downward-sloping, converging trendlines having a contracting range. The pattern appears to be wide at the top and continues to contract as prices fall. A breakout from a falling wedge pattern can indicate either reversal or continuation depending on where the pattern appeared in the trend.
A stock that has broken out of a falling wedge pattern would have gained momentum and would have the potential to move higher.
Buy Level(s): The stock has currently broken out of a falling wedge pattern. However, the ideal buy level for STLA is above the nearest resistance level of $7.70. This is marked in the chart below as a green color dotted line.
Daily chart – STLA
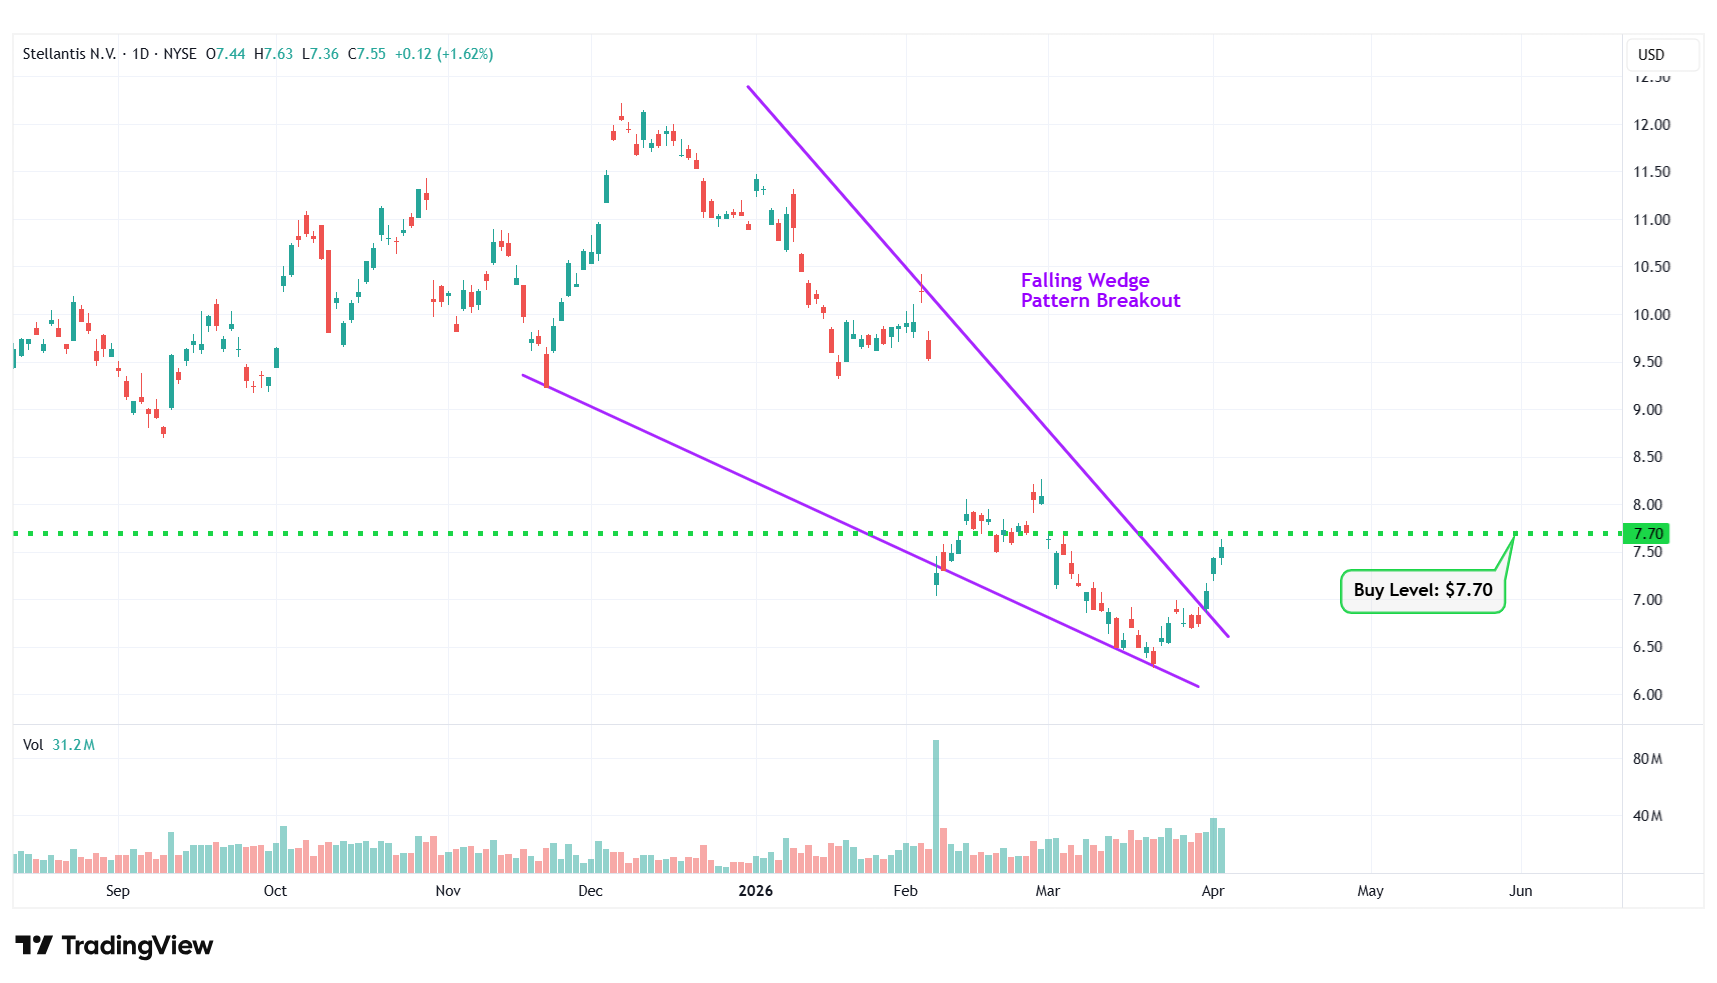
STLA – Falling Wedge Pattern Breakout
#3 Firefly Aerospace Inc. (NASDAQ: FLY)
Sector: Industrials • Aerospace & Defense
Reason: Formation of a Double Bottom Pattern
A Double Bottom Pattern looks like the letter W and is characterized by two well-defined lows at approximately the same price level. This twice-touched low is usually a very strong support level. The high point between the two bottoms’ resistance level is called a neckline. Once a breakout happens from this key price level (neckline), it signifies the start of a bullish move.
Buy Level(s): The ideal buy level for FLY is if the stock breaks out of the double bottom pattern and has a daily close above $34.50. This is marked in the chart below as a green color dotted line.
Daily chart – FLY
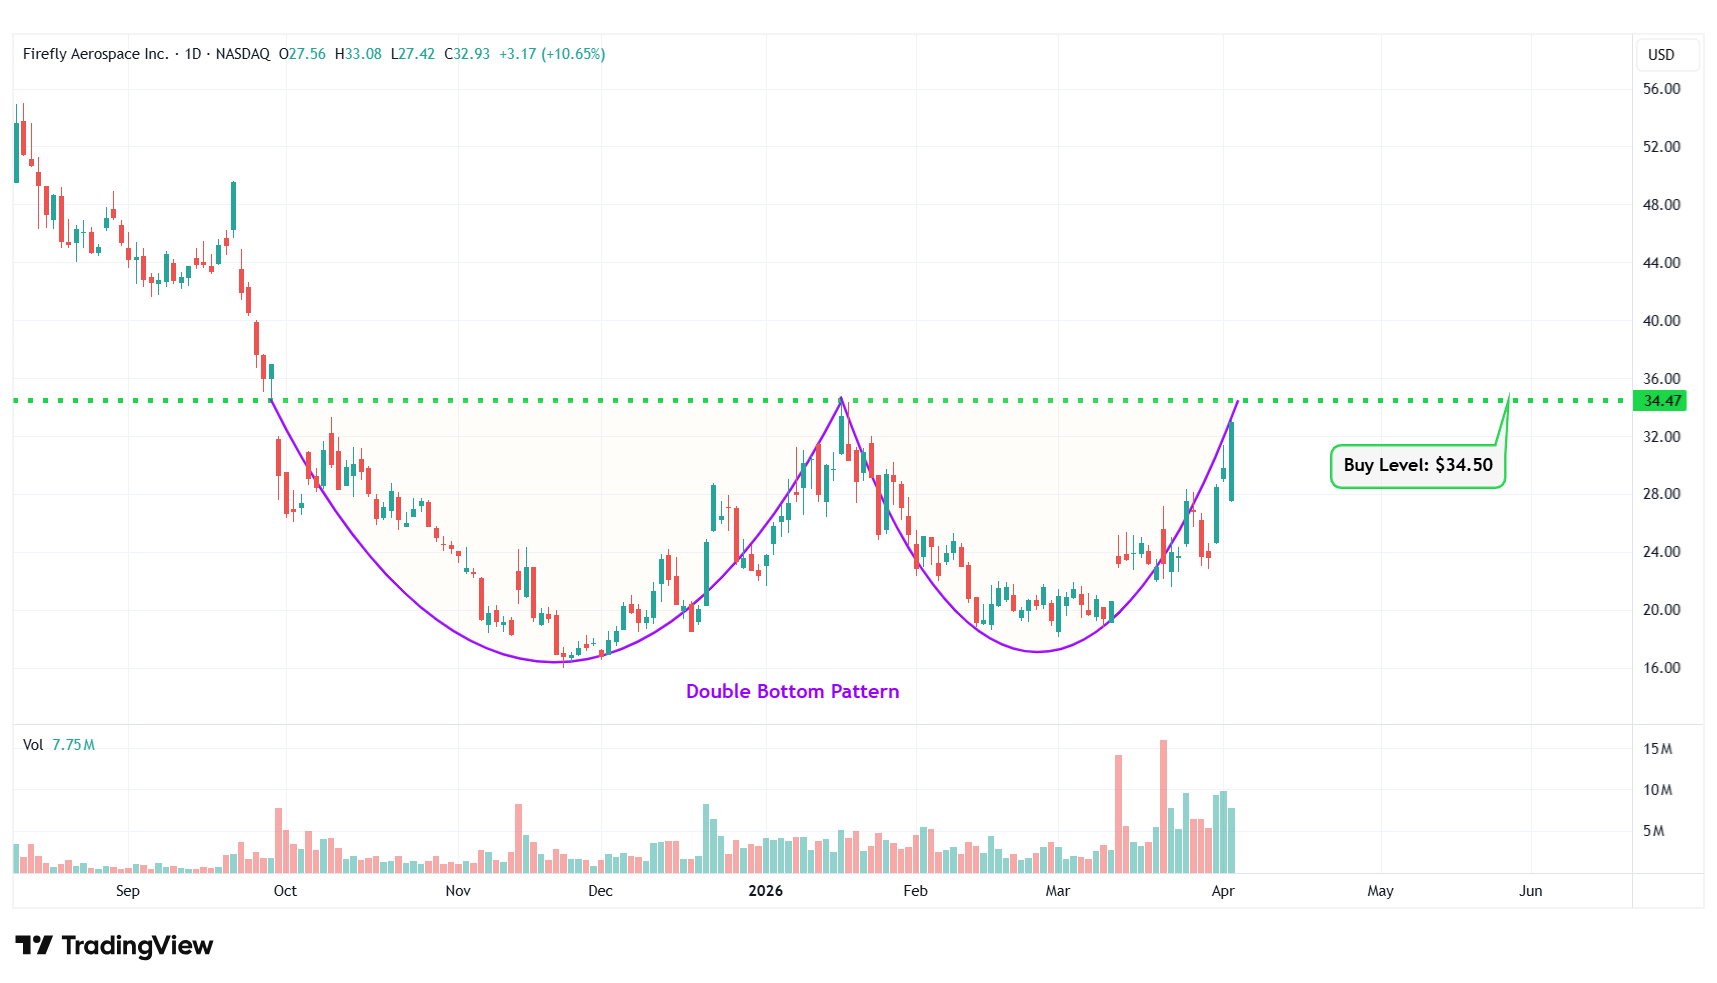
FLY – Double Bottom Pattern
#4 Intel Corp. (NASDAQ: INTC)
Sector: Technology • Semiconductors
Reason: Symmetrical Triangle Pattern Breakout
A symmetrical triangle is a chart pattern formed by two converging trend lines connecting a series of sequential peaks and troughs. These two lines result in the formation of a triangle that appears to be symmetrical.
A symmetrical triangle pattern is usually formed when there is indecision in the price movements and there is uncertainty among the buyers and sellers. This chart pattern represents a period of consolidation before the price breaks out or breaks down. In case a breakout occurs from the upper trend line, it is a strong bullish indication as it signifies the start of a new bullish trend.
Buy Level(s): The stock has currently broken out of a symmetrical triangle pattern. However, the ideal buy level for INTC is if the stock closes above the immediate resistance level of $50.60. This is marked in the chart below as a green color dotted line.
Daily chart – INTC
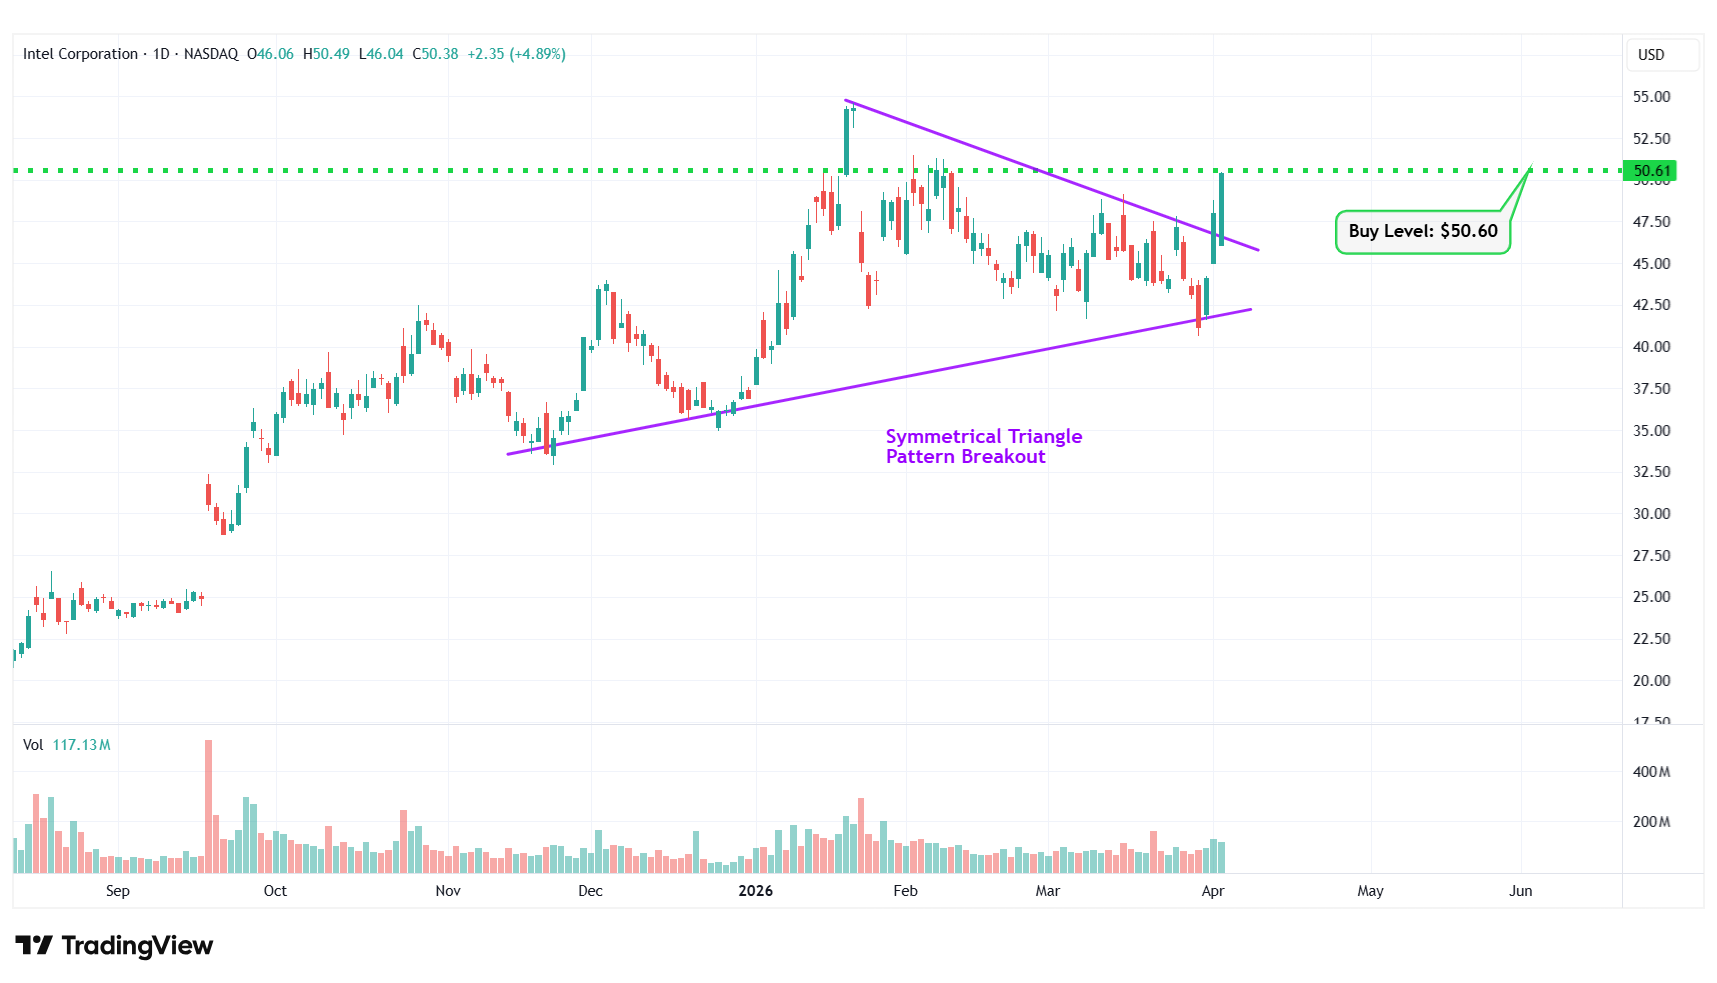
INTC – Symmetrical Triangle Pattern Breakout
#5 TripAdvisor Inc. (NASDAQ: TRIP)
Sector: Consumer Cyclical • Travel Services
Reason: Formation of a Downtrend Channel
A downtrend or descending channel is the price action contained between downward sloping parallel lines. It is formed by two lines that are drawn by connecting the lower highs and lower lows of a stock’s price. Even though this is typically a bearish pattern, a breakout from the upper rail of this pattern is considered a good bullish indication.
Buy Level(s): The daily chart shows that the stock is currently forming a downtrend channel. The ideal buy level for TRIP is if the stock breaks out of the downtrend channel and has a daily close above $11.20. This is marked in the chart below as a green color dotted line.
Daily chart – TRIP
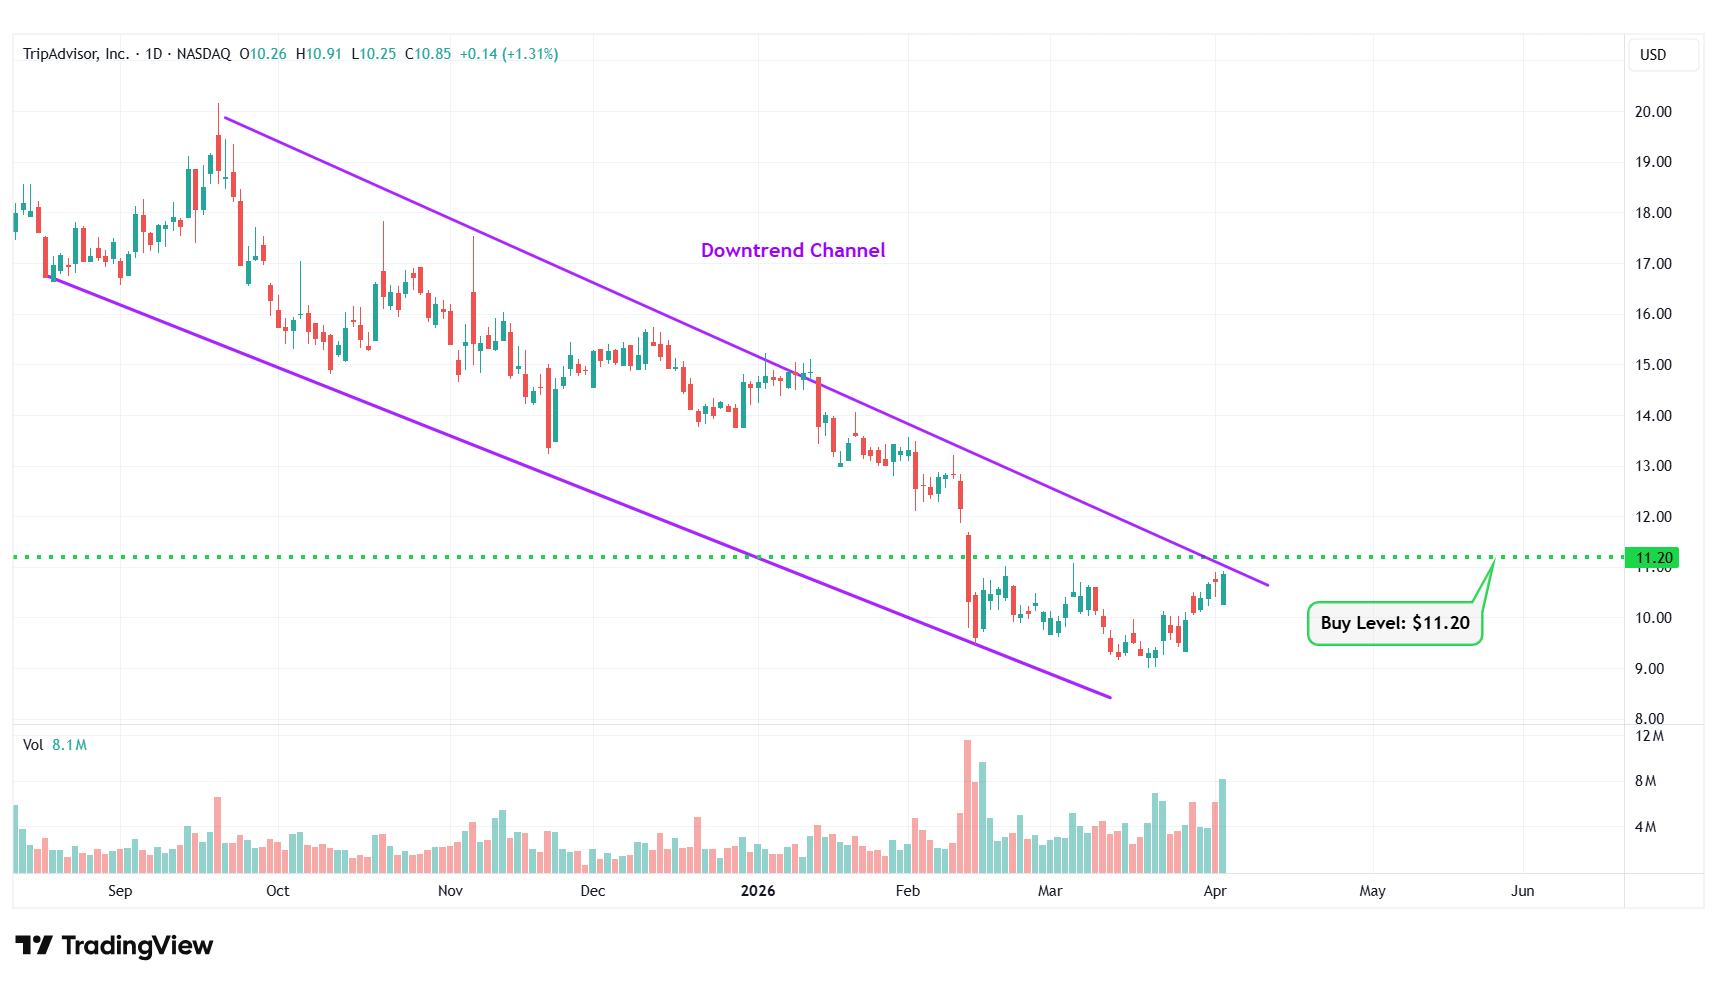
TRIP – Downtrend Channel
#6 Intuitive Machines Inc. (NASDAQ: LUNR)
Sector: Industrials • Aerospace & Defense
Reason: Symmetrical Triangle Pattern Breakout
A symmetrical triangle is a chart pattern formed by two converging trend lines connecting a series of sequential peaks and troughs. These two lines result in the formation of a triangle that appears to be symmetrical.
A symmetrical triangle pattern is usually formed when there is indecision in the price movements and there is uncertainty among the buyers and sellers. This chart pattern represents a period of consolidation before the price breaks out or breaks down. In case a breakout occurs from the upper trend line, it is a strong bullish indication as it signifies the start of a new bullish trend.
Buy Level(s): The stock has currently broken out of a symmetrical triangle pattern. However, the ideal buy level for LUNR is if the stock closes above the immediate resistance level of $24.30. This is marked in the chart below as a green color dotted line.
Daily chart – LUNR
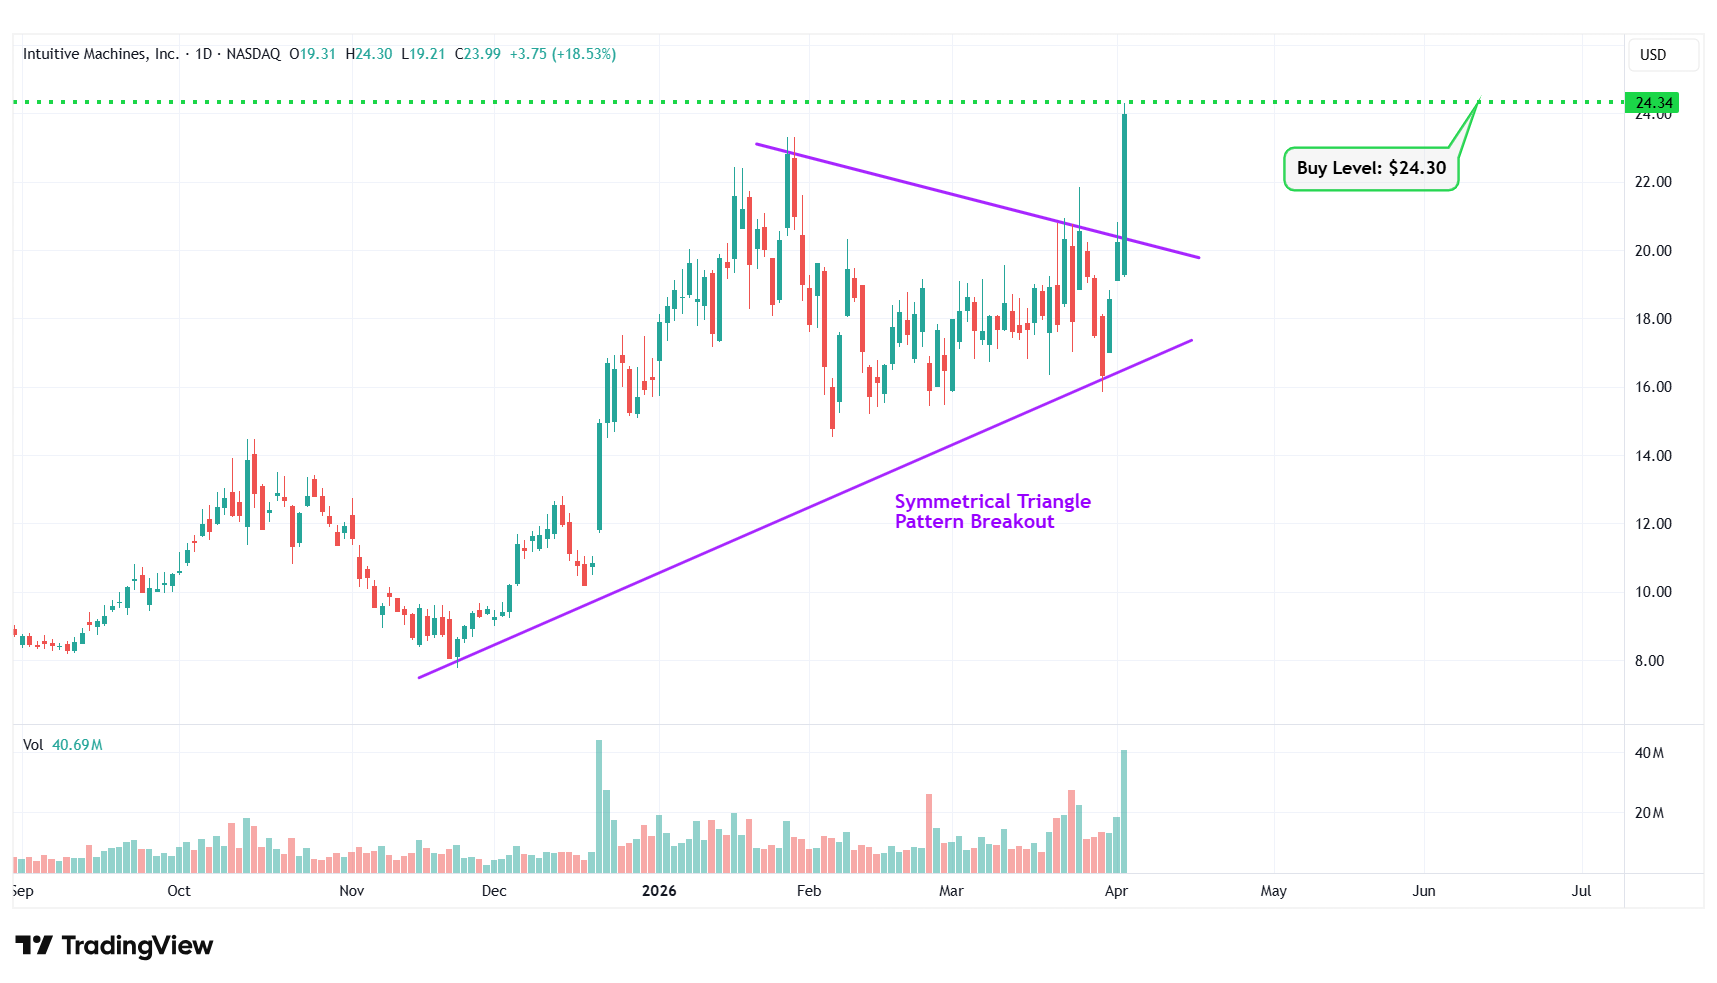
LUNR – Symmetrical Triangle Pattern Breakout
#7 Bitdeer Technologies Group (NASDAQ: BTDR)
Sector: Technology • Software – Application
Reason: Falling Wedge Pattern Breakout
A falling wedge pattern is formed by joining two downward-sloping, converging trendlines having a contracting range. The pattern appears to be wide at the top and continues to contract as prices fall. A breakout from a falling wedge pattern can indicate either reversal or continuation depending on where the pattern appeared in the trend.
A stock that has broken out of a falling wedge pattern would have gained momentum and would have the potential to move higher.
Buy Level(s): The stock has currently broken out of a falling wedge pattern. However, the ideal buy level for BTDR is above the nearest resistance level of $9.50. This is marked in the chart below as a green color dotted line.
Daily chart – BTDR
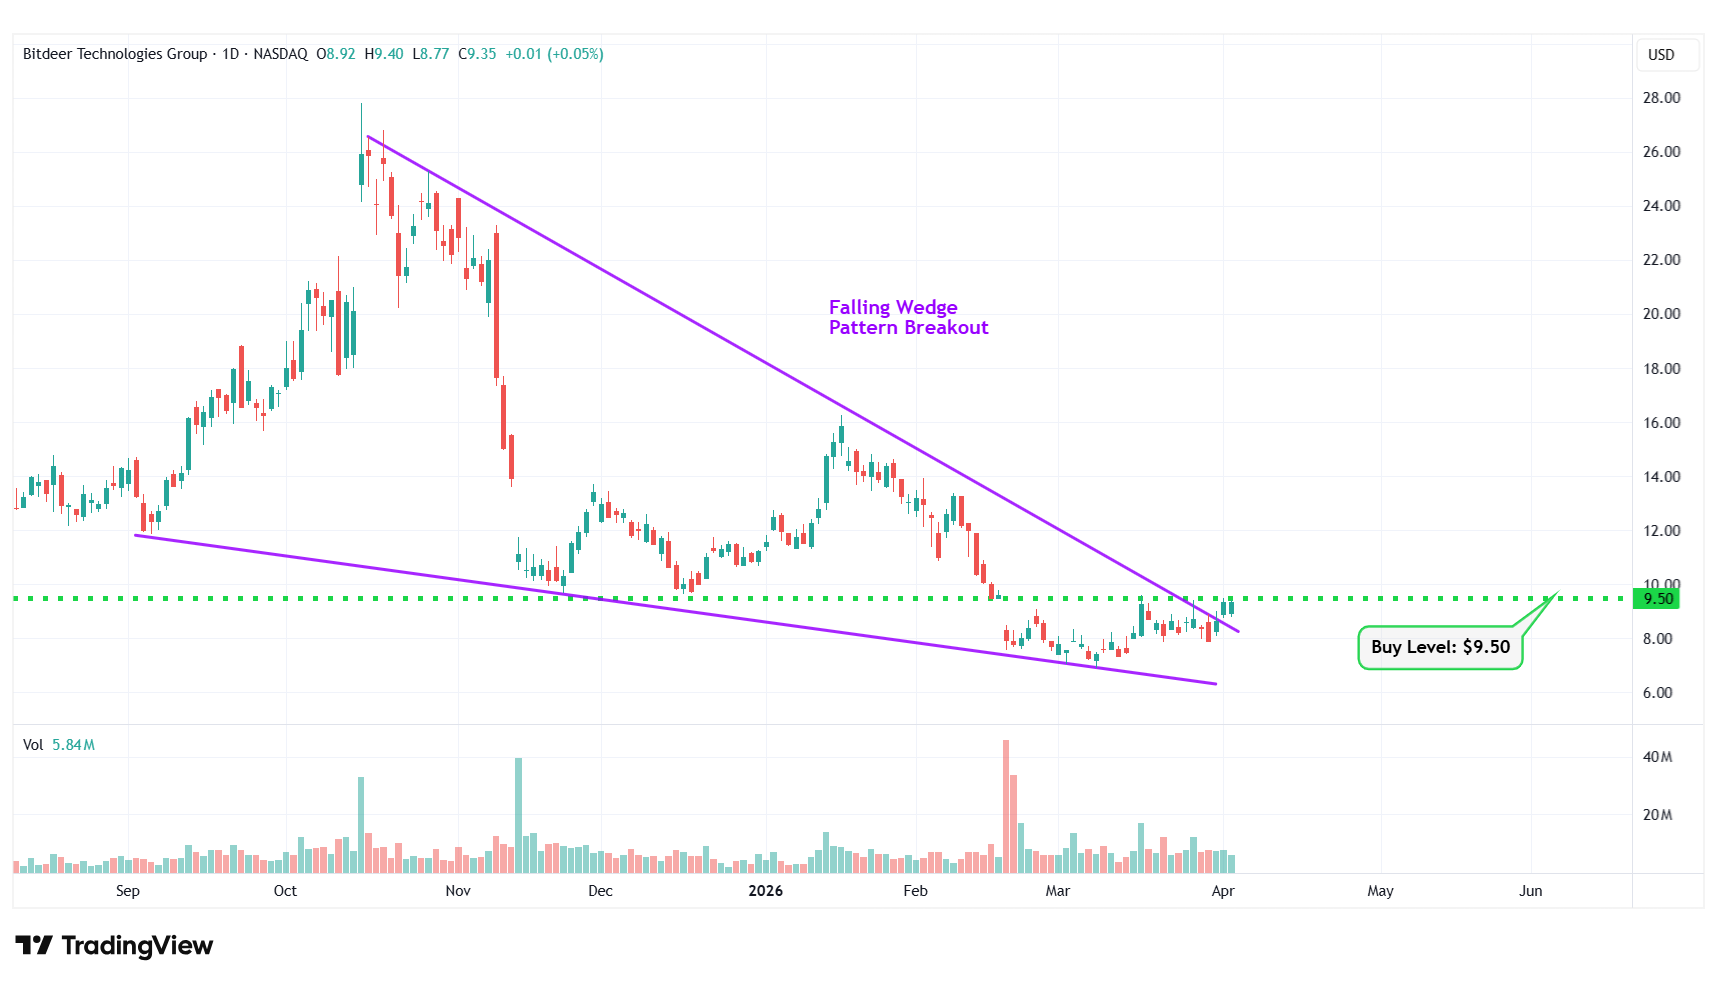
BTDR – Falling Wedge Pattern Breakout
#8 Replimune Group Inc. (NASDAQ: REPL)
Sector: Healthcare • Biotechnology
Reason: Formation of a Symmetrical Triangle Pattern
A symmetrical triangle is a chart pattern formed by two converging trend lines connecting a series of sequential peaks and troughs. These two lines result in the formation of a triangle that appears to be symmetrical.
A symmetrical triangle pattern is usually formed when there is indecision in the price movements and there is uncertainty among the buyers and sellers. This chart pattern represents a period of consolidation before the price breaks out or breaks down. In case a breakout occurs from the upper trend line, it is a strong bullish indication as it signifies the start of a new bullish trend.
Buy Level(s): The ideal buy level for REPL is if the stock has a daily close above the breakout level of the symmetrical triangle pattern, at around $8.50. This is marked in the chart below as a green color dotted line.
Daily chart – REPL
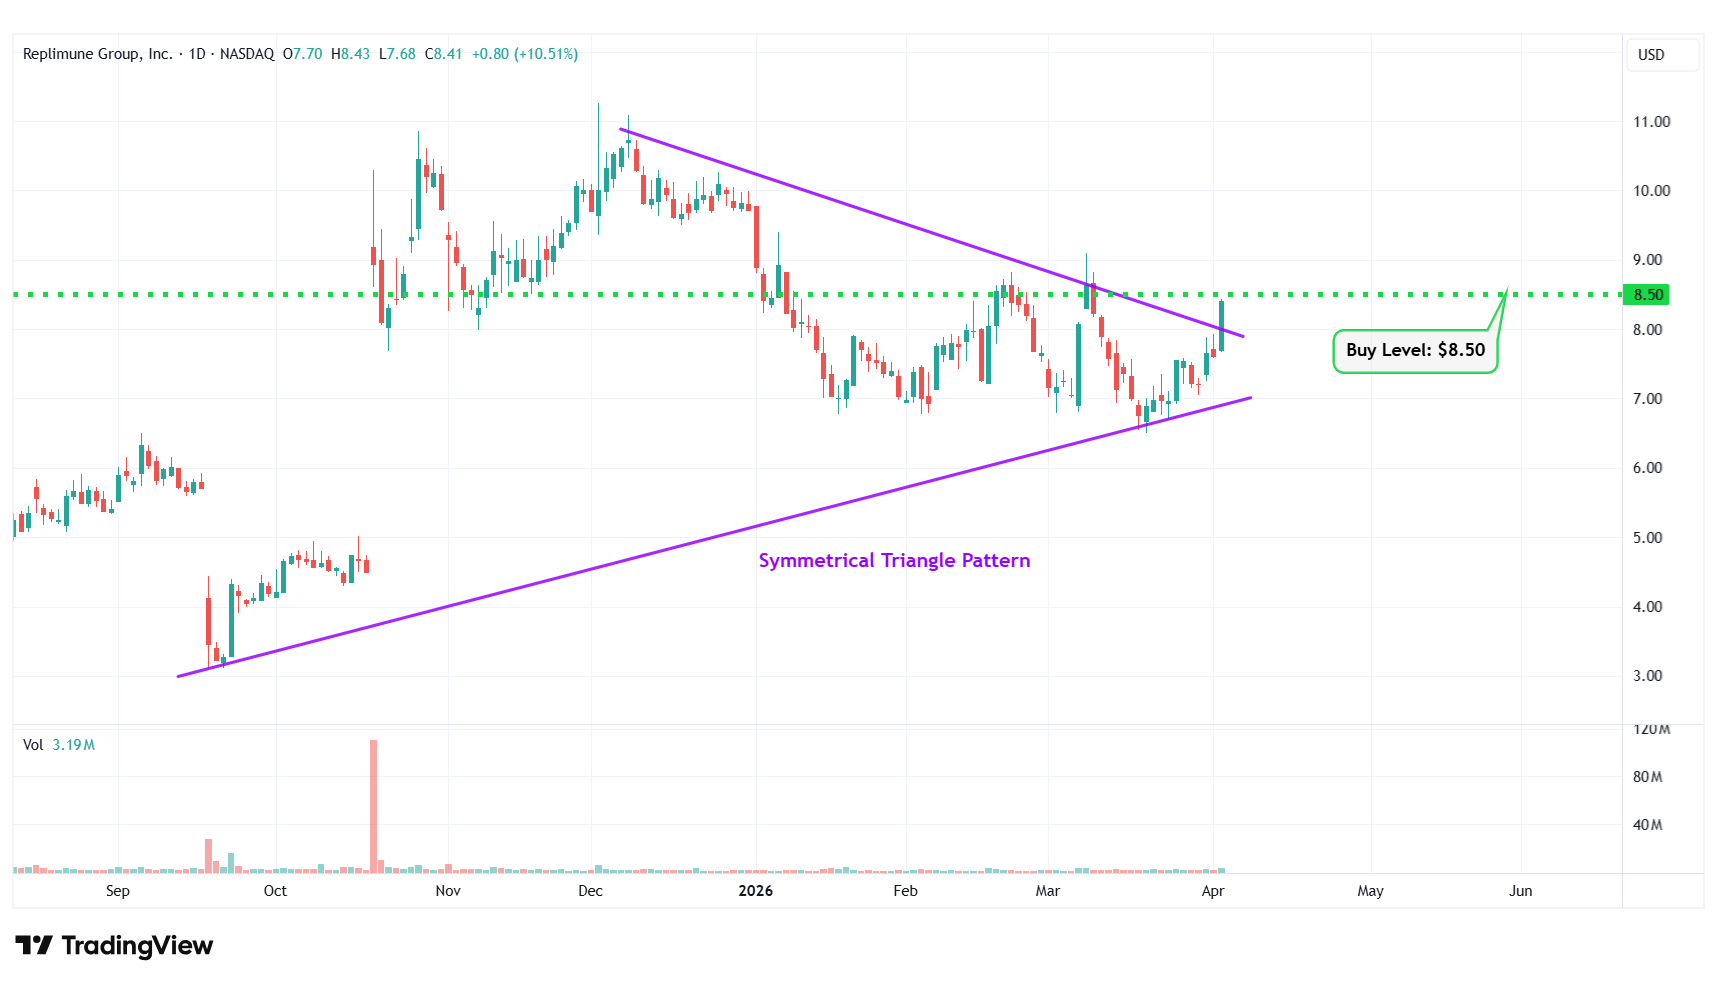
REPL – Symmetrical Triangle Pattern
#9 Globalstar Inc. (NASDAQ: GSAT)
Sector: Communication Services • Telecom Services
Reason: Breakout From a Flag Pattern
A flag pattern is a short-term continuation pattern that marks a small consolidation before the previous move resumes. The pattern is formed when the market consolidates in a narrow range after a sharp move. For a stock in an uptrend, a breakout from this pattern is typically a strong bullish indication.
Buy Level(s): Although the stock has currently broken out of the flag pattern, the ideal buy level for GSAT is above the near-term resistance level of $78.50. This is marked in the chart below as a green color dotted line.
Daily chart – GSAT
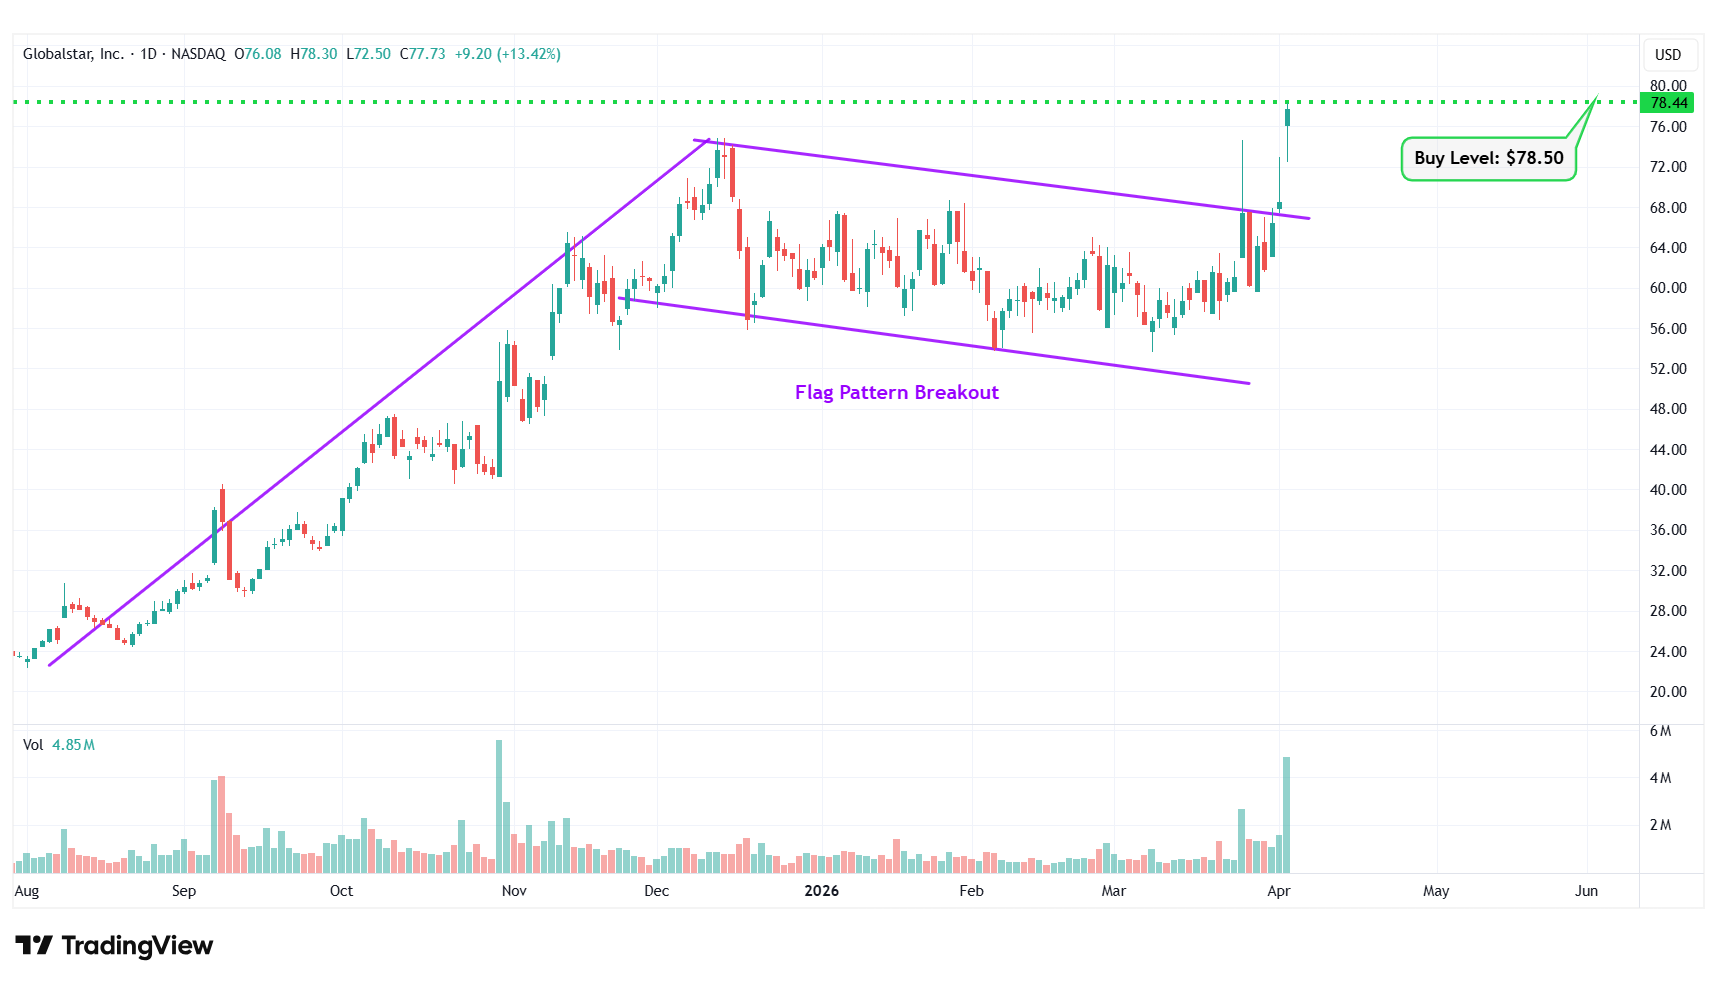
GSAT – Flag Pattern Breakout
#10 Applied Optoelectronics Inc. (NASDAQ: AAOI)
Sector: Technology • Communication Equipment
Reason: Formation of a Symmetrical Triangle Pattern
A symmetrical triangle is a chart pattern formed by two converging trend lines connecting a series of sequential peaks and troughs. These two lines result in the formation of a triangle that appears to be symmetrical.
A symmetrical triangle pattern is usually formed when there is indecision in the price movements and there is uncertainty among the buyers and sellers. This chart pattern represents a period of consolidation before the price breaks out or breaks down. In case a breakout occurs from the upper trend line, it is a strong bullish indication as it signifies the start of a new bullish trend.
Buy Level(s): The ideal buy level for AAOI is if the stock has a daily close above the breakout level of the symmetrical triangle pattern, at around $105.30. This is marked in the chart below as a green color dotted line.
Daily chart – AAOI
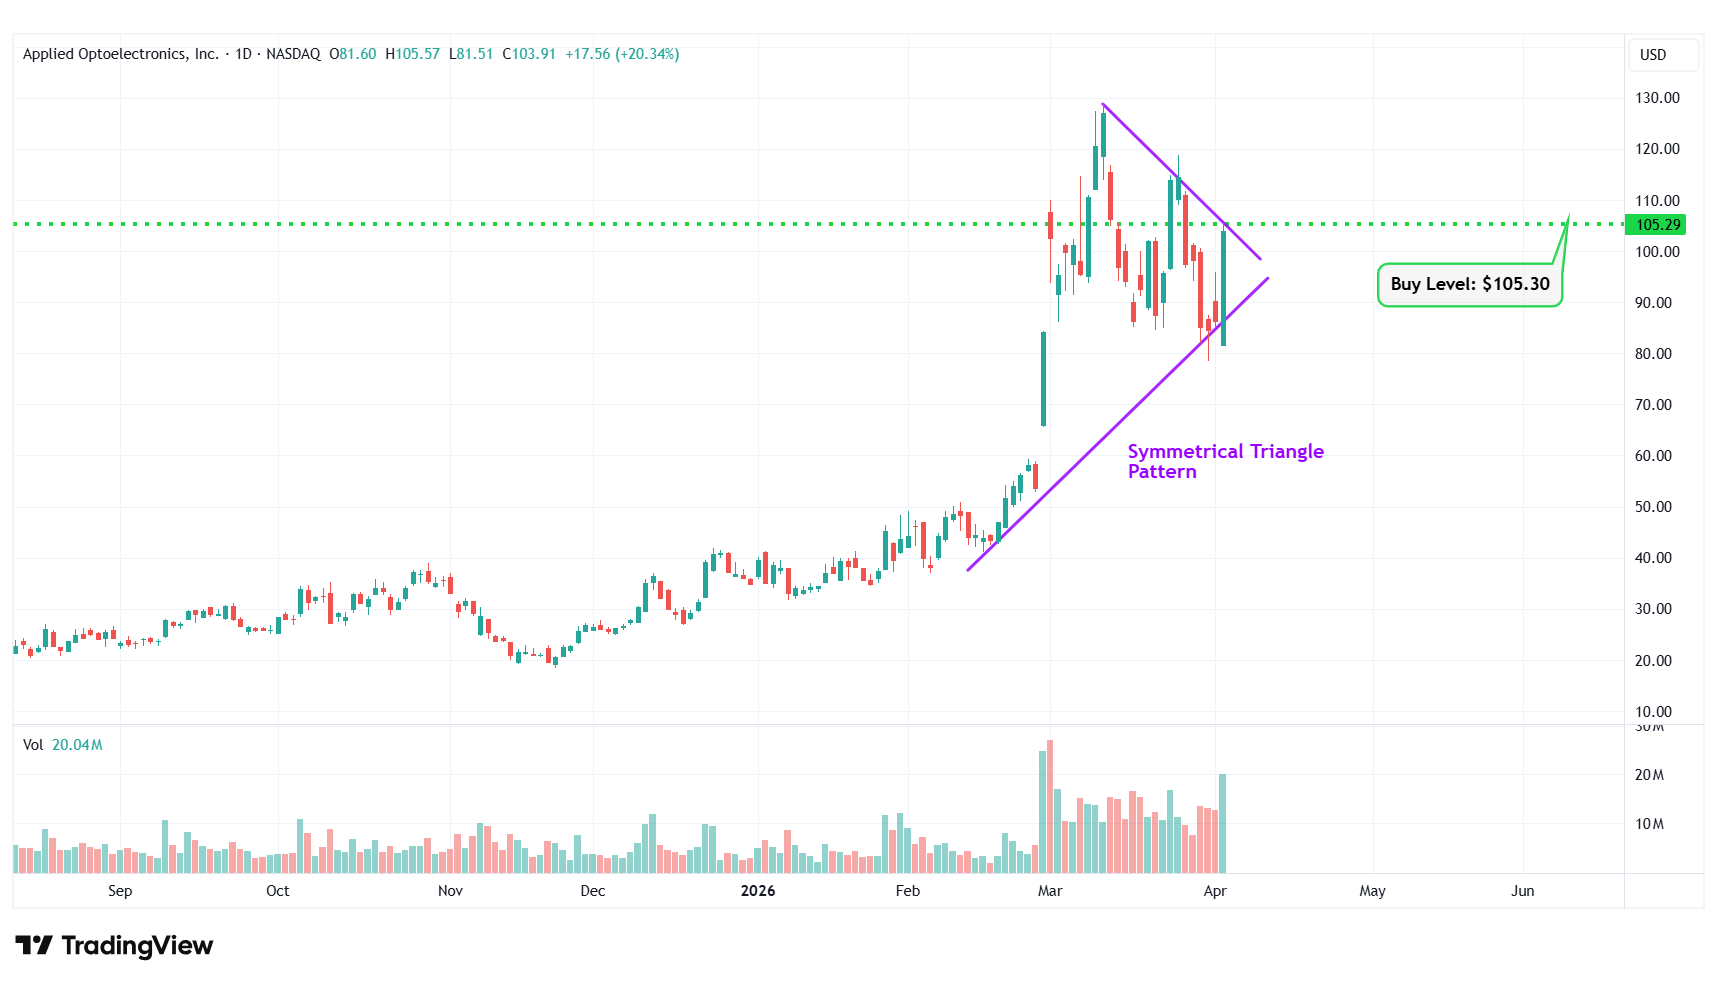
AAOI – Symmetrical Triangle Pattern
Happy Trading!
Trades of The Day Research Team
Legendary fund manager Louis Navellier – a man Forbes calls "the king of quants" – is going "ALL-IN" on this game-changing AI technology. He says, "This is the culmination of everything you've been reading about AI for the last 60 years."Get the details...
Source: Trades of the Day

