Insmed Incorporated (NASDAQ: INSM) seems poised for a price surge based on its latest charts. The company develops and commercializes therapies for patients with serious and rare diseases in the United States, Europe, Japan, and internationally.
The company offers ARIKAYCE for the treatment of refractory nontuberculous mycobacterial lung infections, as well as is in phase 3 clinical trial for the treatment of mycobacterium avium complex lung disease as part of a combination antibacterial drug regimen for adult patients.
Bullish Indications
#1 Falling Wedge Pattern Breakout: As you can see from the daily chart, the stock has been forming a falling wedge pattern for the past few weeks. These are marked as purple lines. The stock has currently broken out of the falling wedge pattern and looks poised for an upmove. A falling wedge is a bullish pattern, and a breakout from it implies that the stock may move higher in the short term.
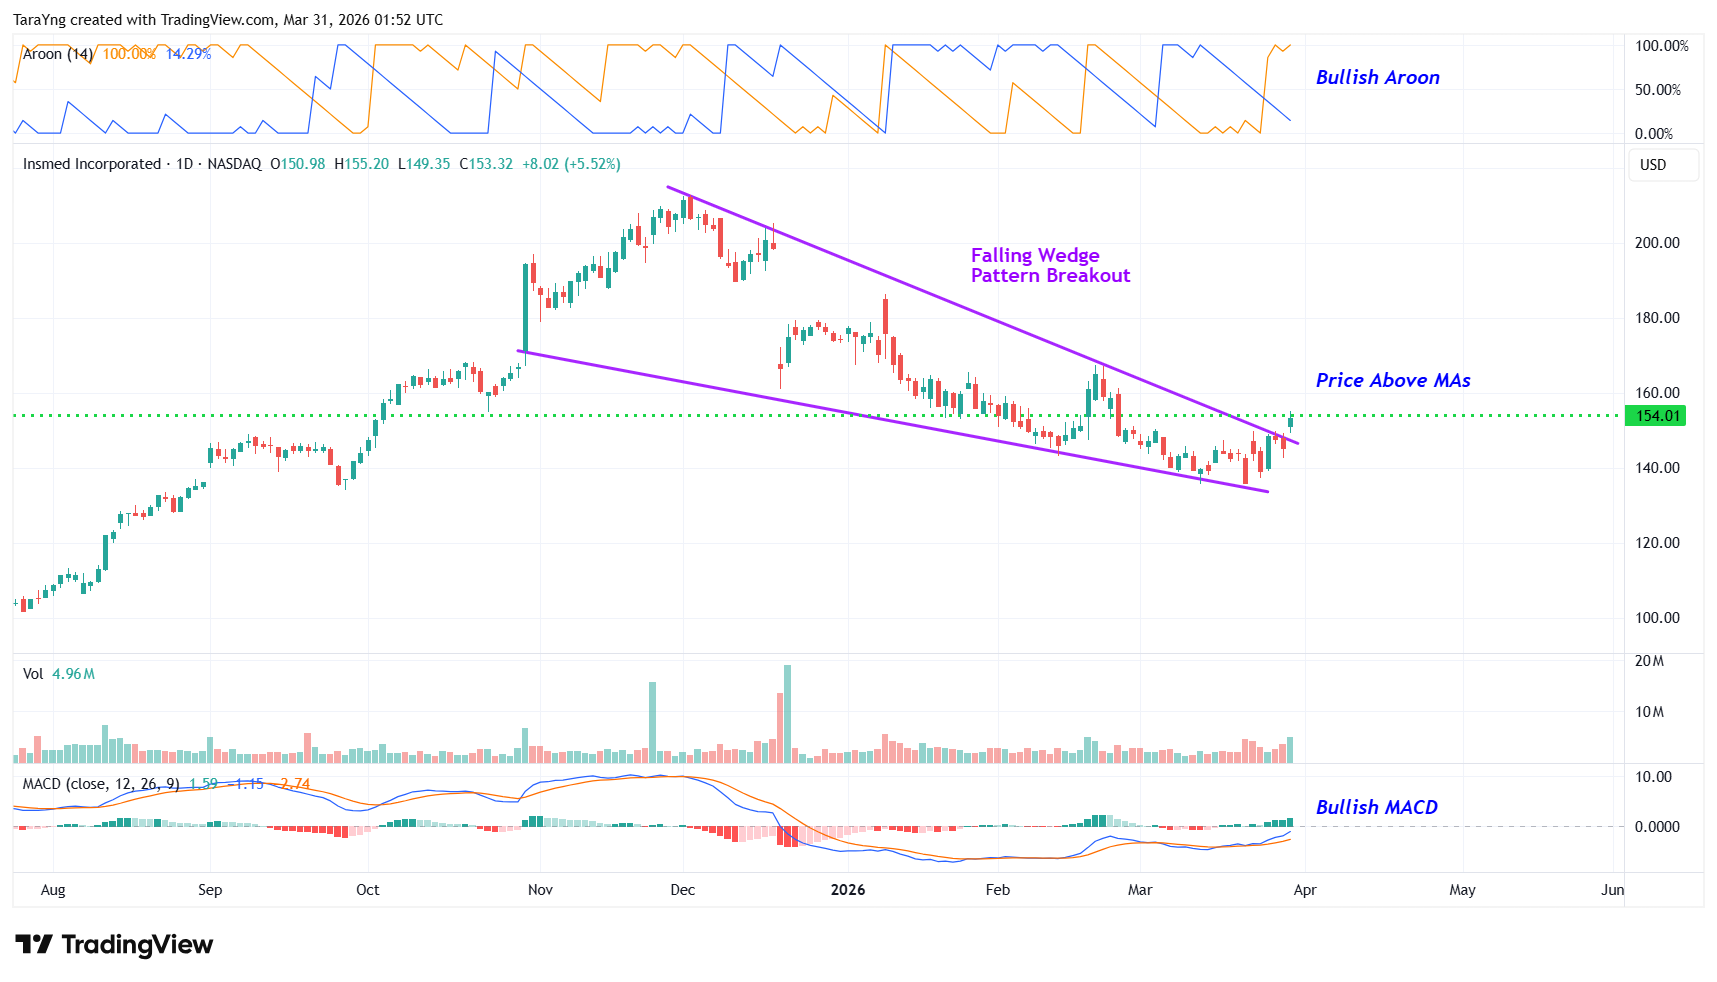
INSM – Daily Chart
#2 Price above MAs: The price is currently above the short-term moving average of 50-day SMA as well as the longer-term moving average of 200-day SMA, indicating that the bulls are still in control. This is a positive indication.
#3 MACD Above Signal Line: In the daily chart, the MACD line (light blue color) is currently above the MACD signal line (orange color), which is typically considered bullish.
#4 Bullish Aroon: The value of Aroon Up (orange line) is above 70 while Aroon Down (blue line) is below 30 in the daily chart. This indicates possible bullishness.
#5 Above Support Area: As you can see from the weekly chart, the stock has currently moved up from a resistance-turned-support level. This level is marked as a pink dotted line. This looks like a good area for the stock to move higher. The stock is also trading above its 50-week and 200-week SMA, indicating that the bulls are still in control.
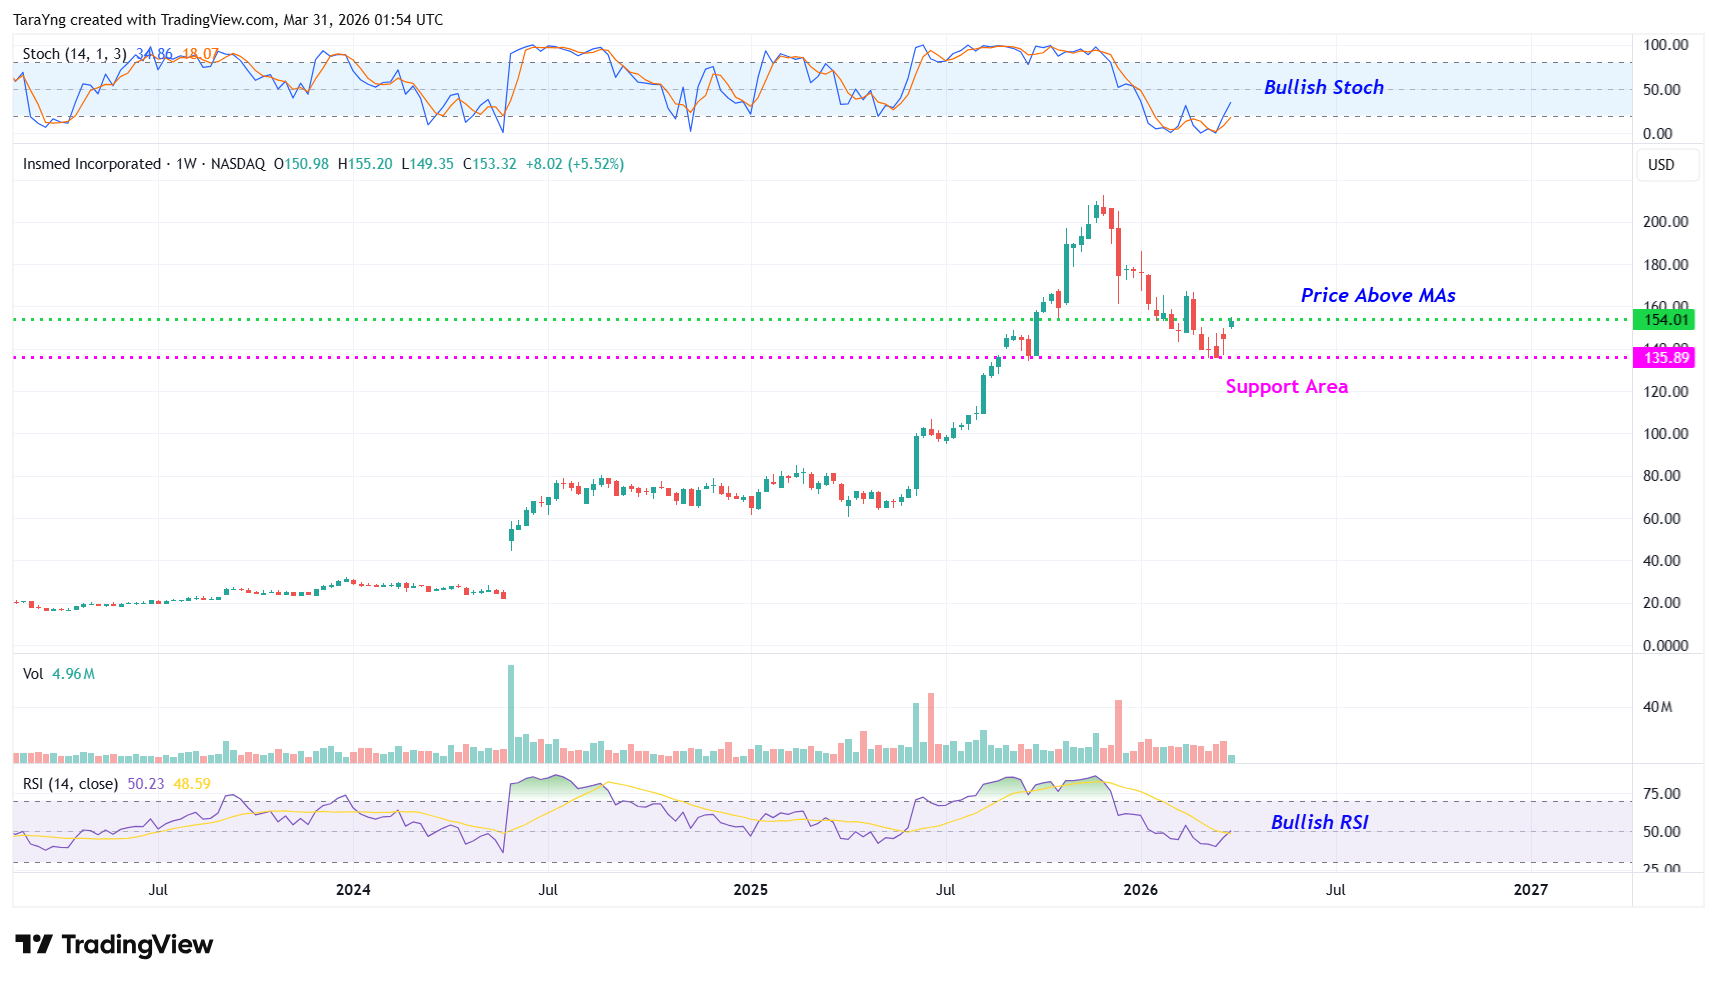
INSM – Weekly Chart
#6 %K above %D: The %K (blue) line of stochastic has currently crossed above the %D (Orange) line in the weekly chart and is also moving higher from oversold levels. This is a possible bullish indication.
#7 Bullish RSI: In the weekly chart, the RSI is currently above 50 and moving higher. This is a possible bullish sign.
Recommended Trade (based on the charts)
Buy Levels: If you want to get in on this trade, you can purchase shares of INSM above the price of around $154.50.
TP: Our target prices are $167.00 and $177.00 in the next 3-6 months.
SL: To limit risk, place a stop-loss at $147.00. Note that the stop-loss is on a closing basis.
Our target potential upside is 8% to 15% in the next 3 to 6 months.
For a risk of $7.50, our target rewards are $12.50 and $22.50. This is a nearly 1:2 and 1:3 risk-reward trade.
In other words, this trade offers nearly 2x to 3x more potential upside than downside.
Risks to Consider
The stock may reverse its overall trend if it breaks down from the falling wedge pattern with high volume. The sell-off of the stock could also be triggered in case of any negative news, overall weakness in the market, or any regulatory changes in the sector.
Happy Trading!
Tara
Imagine having 12 new monthly income checks, carrying the potential of up to 21% yields.This is possible because of a tested strategy to get paid out regularly, like a paycheck. For over a decade, I have helped more than 26,000 investors secure 12 new monthly payouts. Meaning, you know exactly how much you'll make every month... Because of some stocks that pay us 8%,13.4%, and even 21.6% yields. See it for yourself here.
Source: Trades of the Day

