DocuSign, Inc. (NASDAQ: DOCU) seems poised for a price surge based on its latest charts. The company provides electronic signature solution in the United States and internationally.
The company offers AI-powered intelligent agreement management (IAM) platform to optimize the agreement management process and provides e-signature solution that enables sending and signing of agreements on various devices; Contract Lifecycle Management (CLM), Document Generation, and Gen for Salesforce for automated agreement generation within Salesforce.
Bullish Indications
#1 Falling Wedge Pattern: As you can see from the daily chart, the stock has been forming a falling wedge pattern for the past few weeks. These are marked as purple lines. The stock currently looks poised for a breakout of the falling wedge pattern. A falling wedge is a bullish pattern, and a breakout from it implies that the stock may move higher in the short term.
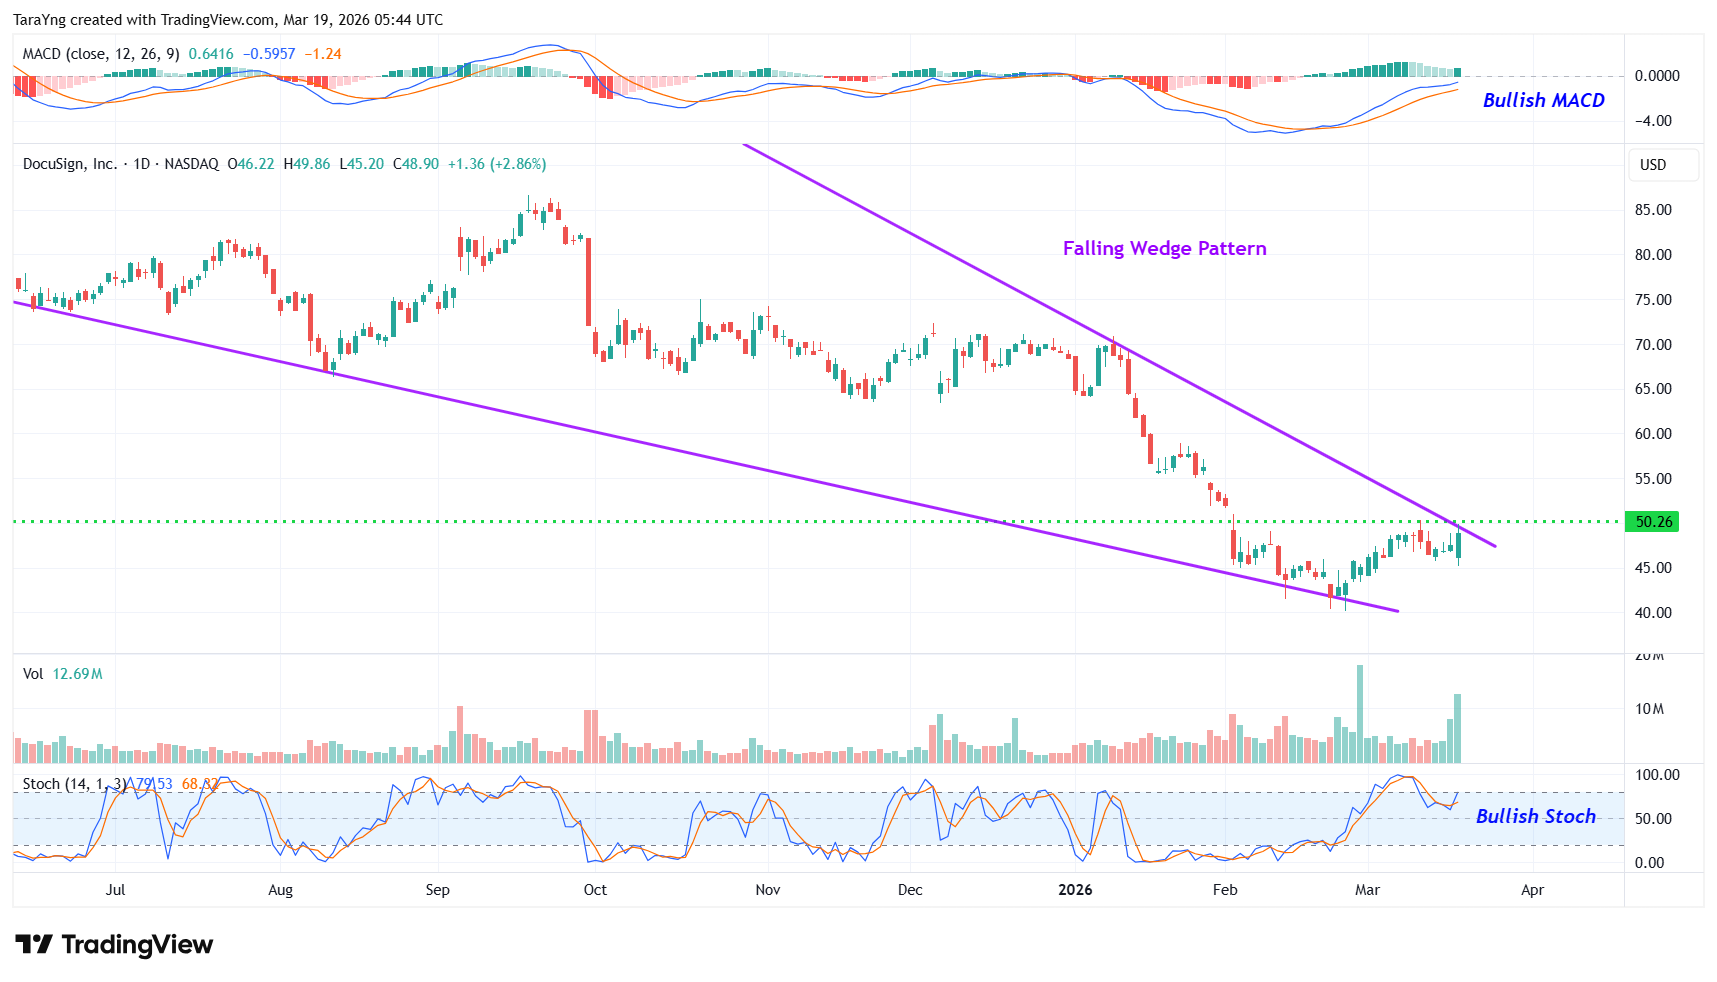
DOCU – Daily Chart
#2 MACD Above Signal Line: In the daily chart, the MACD line (light blue color) is currently above the MACD signal line (orange color), which is typically considered bullish.
#3 Bullish Stoch: The %K line is above the %D line of the stochastic in the daily chart, indicating possible bullishness.
#4 Above Support Area: As you can see from the weekly chart, the stock has currently moved up from a resistance-turned-support level. This level is marked as a pink dotted line. This looks like a good area for the stock to move higher. The stock is also trading above its 50-week moving average, indicating that the bulls are gaining control.
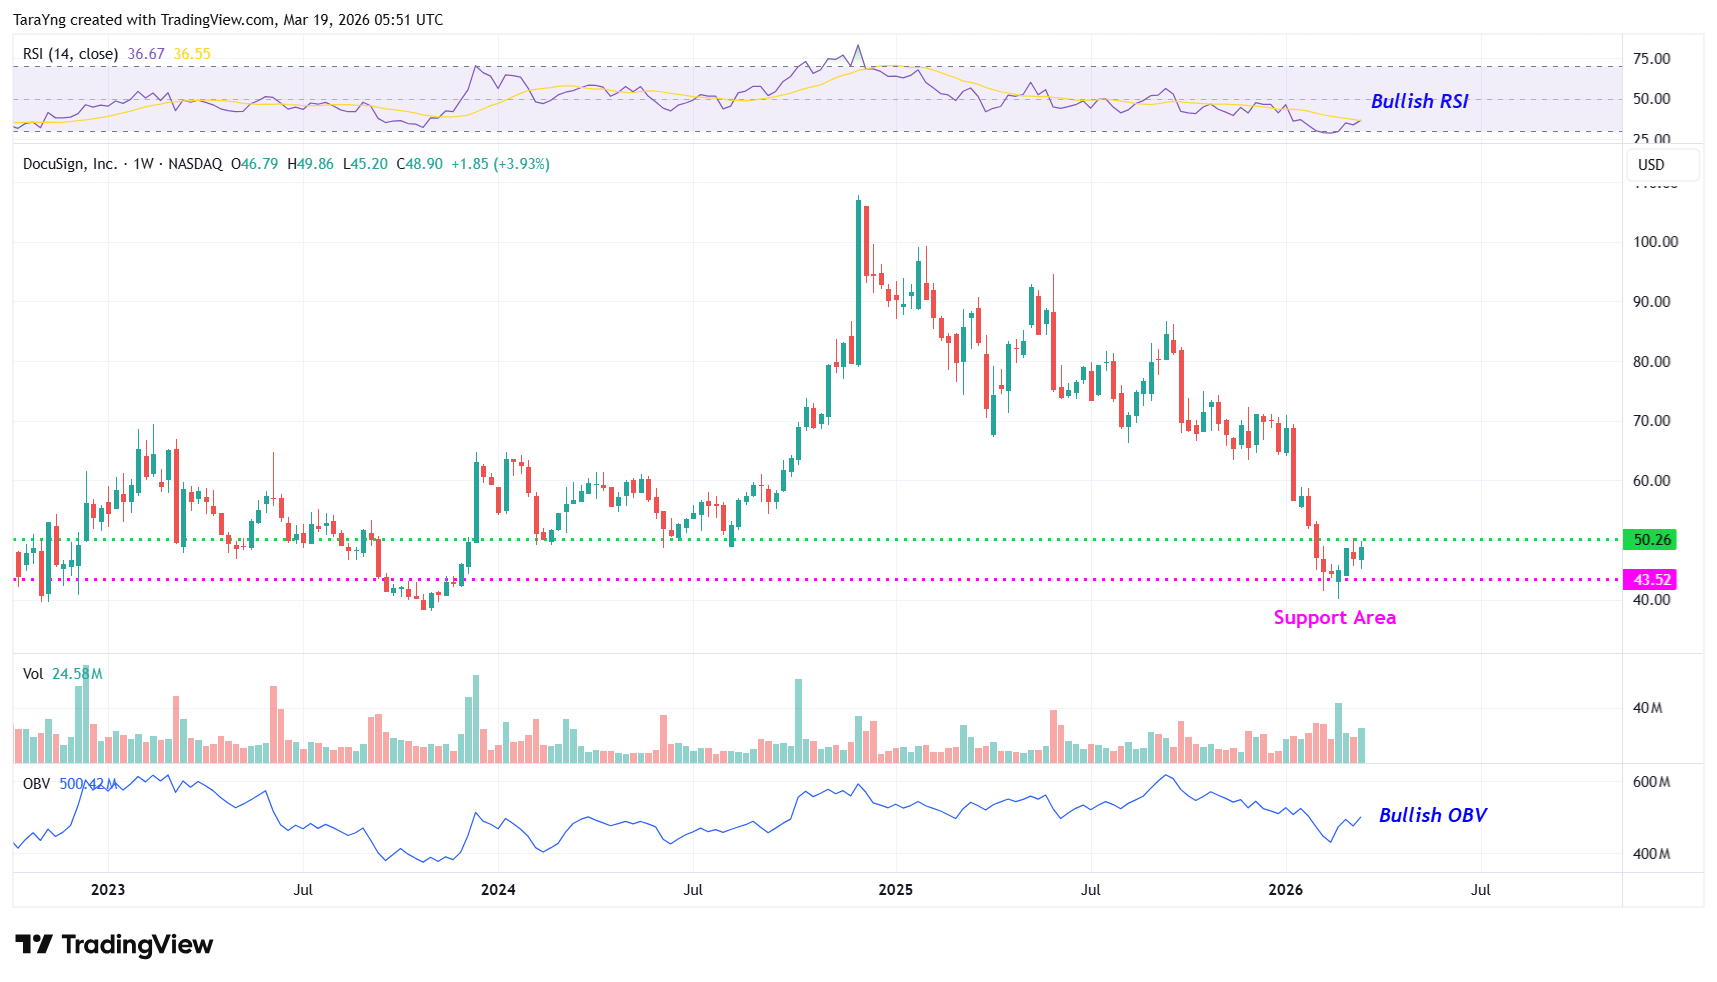
DOCU – Weekly Chart
#5 Bullish MACD: The MACD line is above the MACD signal line in the weekly chart as well, indicating bullishness.
#6 Positive OBV: The weekly chart shows that the OBV indicator is currently rising. OBV rises when volume in up weeks outpaces volume in down weeks. A rising OBV typically reflects positive volume pressure that can lead to higher prices.
Recommended Trade (based on the charts)
Buy Levels: If you want to get in on this trade, you can purchase shares of DOCU above the price of around $50.30.
TP: Our target prices are $60.00 and $66.00 in the next 3-6 months.
SL: To limit risk, place a stop-loss at $45.00. Note that the stop-loss is on a closing basis.
Our target potential upside is 19% to 31% in the next 3 to 6 months.
For a risk of $5.30, our target rewards are $9.70 and $15.70. This is a nearly 1:2 and 1:3 risk-reward trade.
In other words, this trade offers nearly 2x to 3x more potential upside than downside.
Risks to Consider
The stock may reverse its overall trend if it breaks down from the falling wedge pattern with high volume. The sell-off of the stock could also be triggered in case of any negative news, overall weakness in the market, or any regulatory changes in the sector.
Happy Trading!
Tara
I recently visited Mar-a-Lago... And now I'm prepared to put my reputation on the line. Since 1998, my proprietary system would've returned 13,126% in backtests. (That's 13X the S&P and 106X the average investor, according to JP Morgan.) However, one investment I just uncovered could be my biggest winner of all... It involves President Trump, Elon Musk, trillions of dollars, China... And a MAJOR upgrade to the artificial intelligence revolution. See for yourself!
Source: Trades of the Day

