Broadcom Inc. (NASDAQ: AVGO) seems poised for a price surge based on its latest charts. The company designs, develops, and supplies various semiconductor devices and infrastructure software solutions internationally. The company operates in two segments: Semiconductor Solutions and Infrastructure Software.
Bullish Indications
#1 Symmetrical Triangle Pattern Breakout: The daily chart shows that the stock has recently formed a Symmetrical Triangle pattern. This is a continuation pattern and is characterized by two converging trend lines connecting a series of sequential peaks and troughs. This pattern is marked on the daily chart as purple lines. The breakout from a symmetrical triangle pattern usually signifies a bullish move. Currently, the stock has broken out of the symmetrical triangle pattern, which is a possible bullish sign.
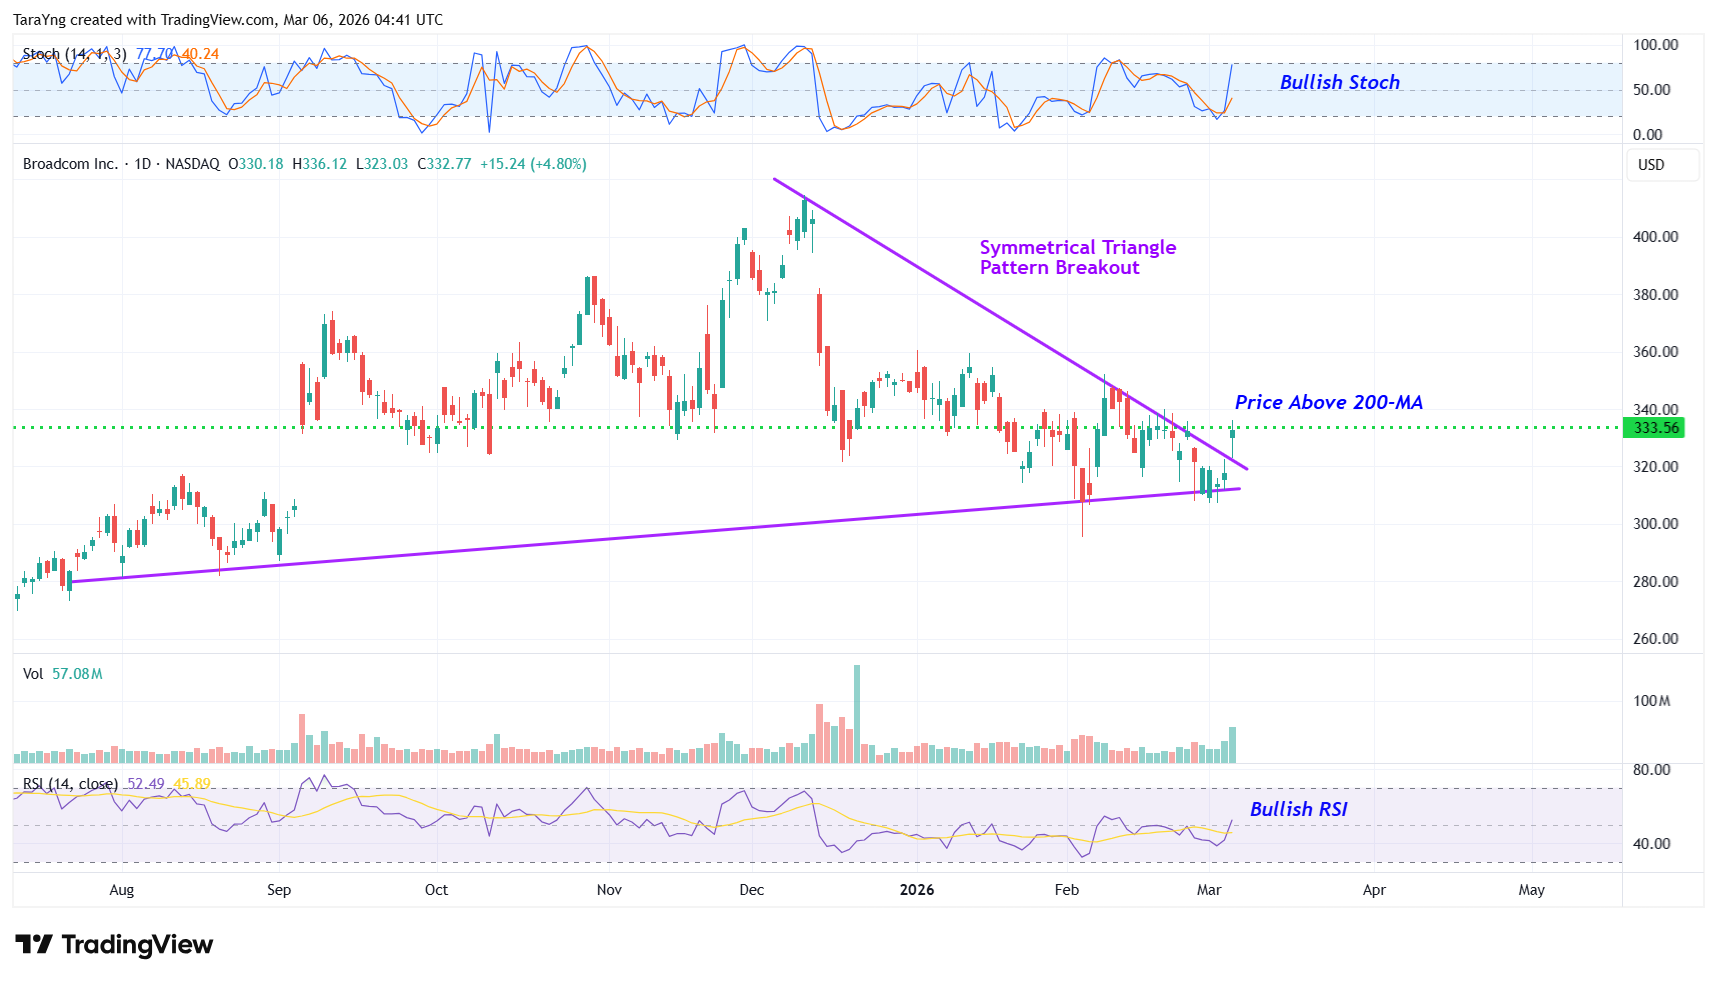
AVGO – Daily Chart
#2 Price above MA: The price is currently above the longer-term moving average of the 200-day SMA, indicating that the bulls are still in control. This is a positive indication.
#3 Bullish Stoch: The %K line is above the %D line of the stochastic in the daily chart and is also moving higher from oversold levels, indicating possible bullishness.
#4 Bullish RSI: The RSI is currently above 50 and moving higher. This is a possible bullish sign.
#5 Above Support Area: As you can see from the weekly chart, the stock has currently moved up from a resistance-turned-support level. This level is marked as a pink dotted line. This looks like a good area for the stock to move higher. The stock is also trading above its 50-week and 200-week SMA, indicating that the bulls are still in control.
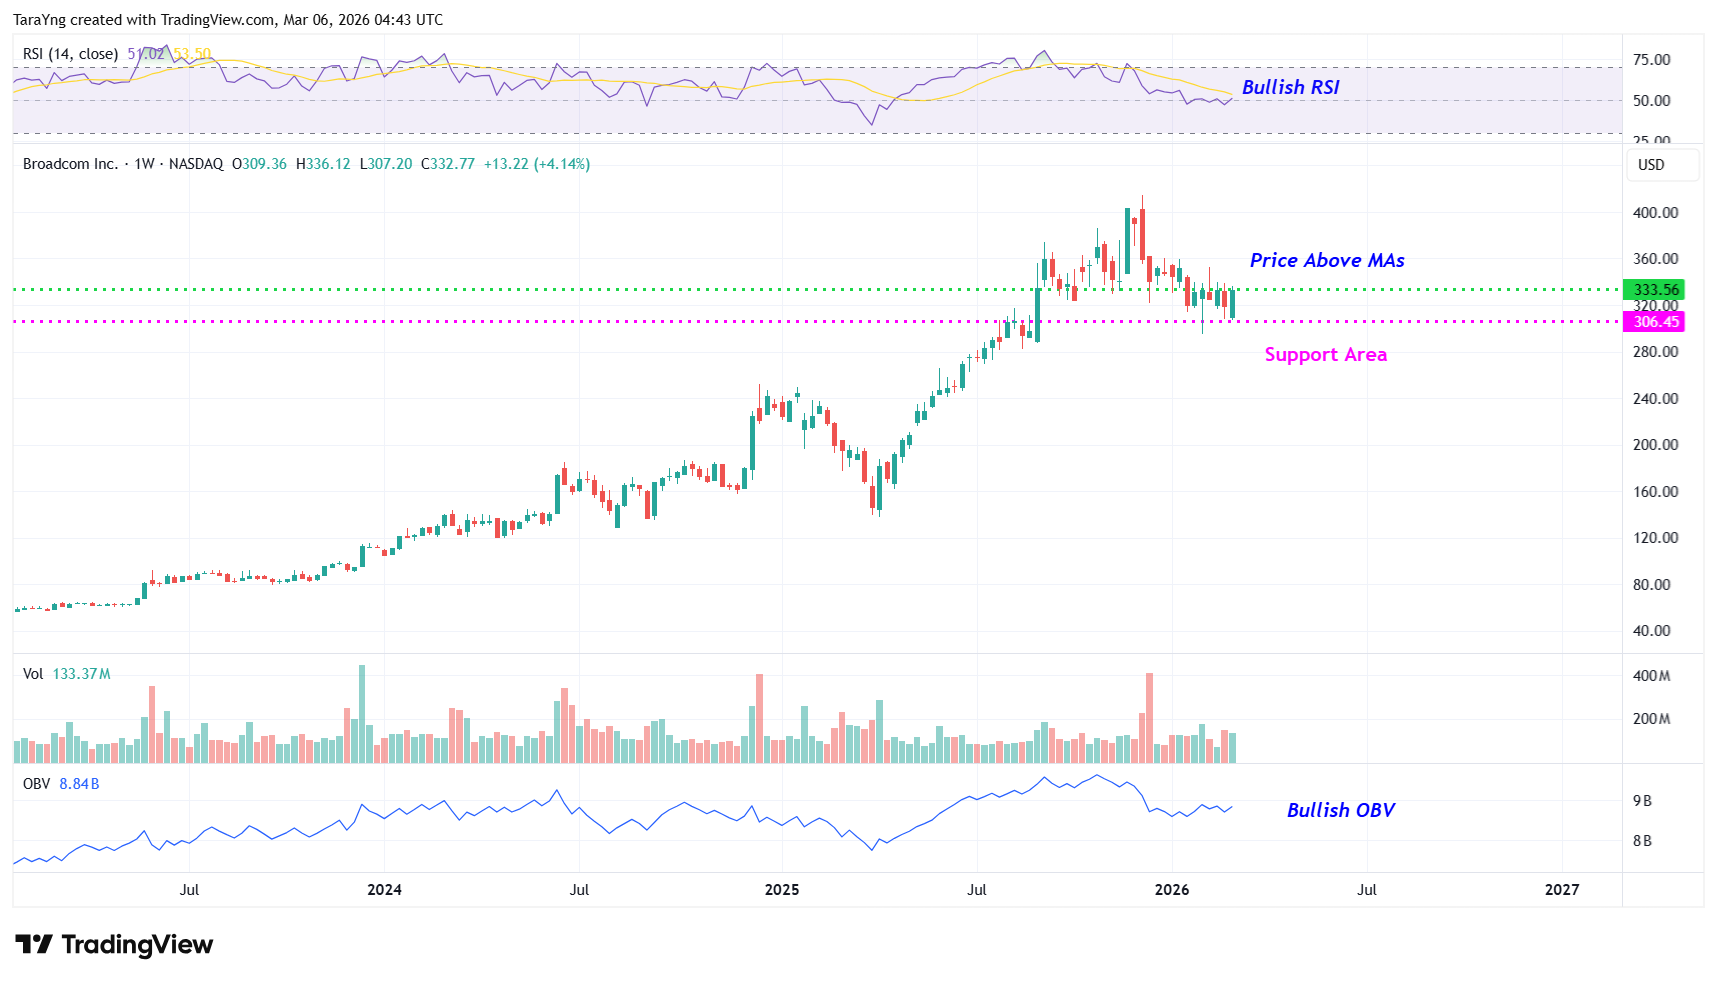
AVGO – Weekly Chart
#6 Bullish RSI: In the weekly chart, the RSI is currently above 50 and moving higher. This is a possible bullish sign.
#7 Positive OBV: The weekly chart shows that the OBV indicator is currently rising. OBV rises when volume in up weeks outpaces volume in down weeks. A rising OBV typically reflects positive volume pressure that can lead to higher prices.
Recommended Trade (based on the charts)
Buy Levels: If you want to get in on this trade, you can purchase shares of AVGO above the price of around $333.60.
TP: Our target prices are $360.00 and $385.00 in the next 3-6 months.
SL: To limit risk, place a stop-loss at $318.00. Note that the stop-loss is on a closing basis.
Our target potential upside is 8% to 15% in the next 3 to 6 months.
For a risk of $15.60, our target rewards are $26.40 and $51.40. This is a nearly 1:2 and 1:3 risk-reward trade.
In other words, this trade offers nearly 2x to 3x more potential upside than downside.
Risks to Consider
The stock may reverse its overall trend if it breaks down from the symmetrical triangle pattern with high volume. The sell-off of the stock could also be triggered in case of any negative news, overall weakness in the market, or any regulatory changes in the sector.
Happy Trading!
Tara
Legendary fund manager Louis Navellier – a man Forbes calls "the king of quants" – is going "ALL-IN" on this game-changing AI technology. He says, "This is the culmination of everything you've been reading about AI for the last 60 years."Get the details...
Source: Trades of the Day

