Picking a winning trade on a consistent basis is not simply a stroke of luck. It’s the result of calculated screening, planning, and deliberation.
With this in mind, we have started a new weekly series on our top 10 stocks to watch this week — stocks that look poised for a possible breakout in the coming days. Traders should add these stocks to their watchlist now.
The Top 10 Stocks to Watch This Week for Possible Breakouts
| Sl # | Name of the Stock | Stock Ticker | Last Close | Buy Level(s) | Reason |
| 1 | Enphase Energy Inc. | NASDAQ: ENPH | $49.80 | $50.70 | Ascending Triangle Pattern Breakout |
| 2 | Super Micro Computer Inc. | NASDAQ: SMCI | $34.38 | $35.40 | Falling Wedge Pattern Breakout |
| 3 | Envista Holdings Corp | NYSE: NVST | $29.10 | $29.30 | Uptrend Channel Breakout |
| 4 | Under Armour Inc. | NYSE: UAA | $7.56 | $7.60 | Symmetrical Triangle Pattern Breakout |
| 5 | Mineralys Therapeutics Inc. | NASDAQ: MLYS | $29.77 | $31.50 | Falling Wedge Pattern |
| 6 | EZCorp, Inc. | NASDAQ: EZPW | $25.63 | $25.90 | Uptrend Channel Breakout |
| 7 | ADT Inc. | NYSE: ADT | $8.07 | $8.20 | Falling Wedge Pattern |
| 8 | JPMorgan Chase & Co | NYSE: JPM | $322.40 | $327.00 | Uptrend Channel |
| 9 | SMX (Security Matters) Plc. | NASDAQ: SMX | $15.83 | $18.00 | Symmetrical Triangle Pattern Breakout |
| 10 | NRG Energy Inc. | NYSE: NRG | $153.32 | $154.80 | Falling Wedge Pattern |
Important: Typically, these trades offer a risk: reward ratio of 1:2 or 1:3 in the next 6 months, which implies 2x to 3x rewards when compared to risks. So, be sure to set your stop-loss levels and target prices accordingly to manage your risk. In addition, these trade ideas are triggered using daily closing prices, not intra-day pricing. So, if you participate in these trades, make sure that you only buy the stock once its daily close is above the recommended price level.
That said, here are the top 10 stocks to watch for a breakout, in no particular order.
#1 Enphase Energy Inc. (NASDAQ: ENPH)
Sector: Technology • Solar
Reason: Breakout From an Ascending Triangle Pattern
An ascending triangle pattern is a bullish pattern formed by drawing a horizontal line along the swing highs, and a rising trendline along the swing lows. These two lines result in the formation of a triangle. A breakout from this pattern is typically a strong bullish indication.
Buy Level(s): Although the stock has broken out of the ascending triangle pattern, the ideal buy level for ENPH is if the stock has a daily close above the near-term resistance level of $50.70. This is marked in the chart below as a green color dotted line.
Daily chart – ENPH
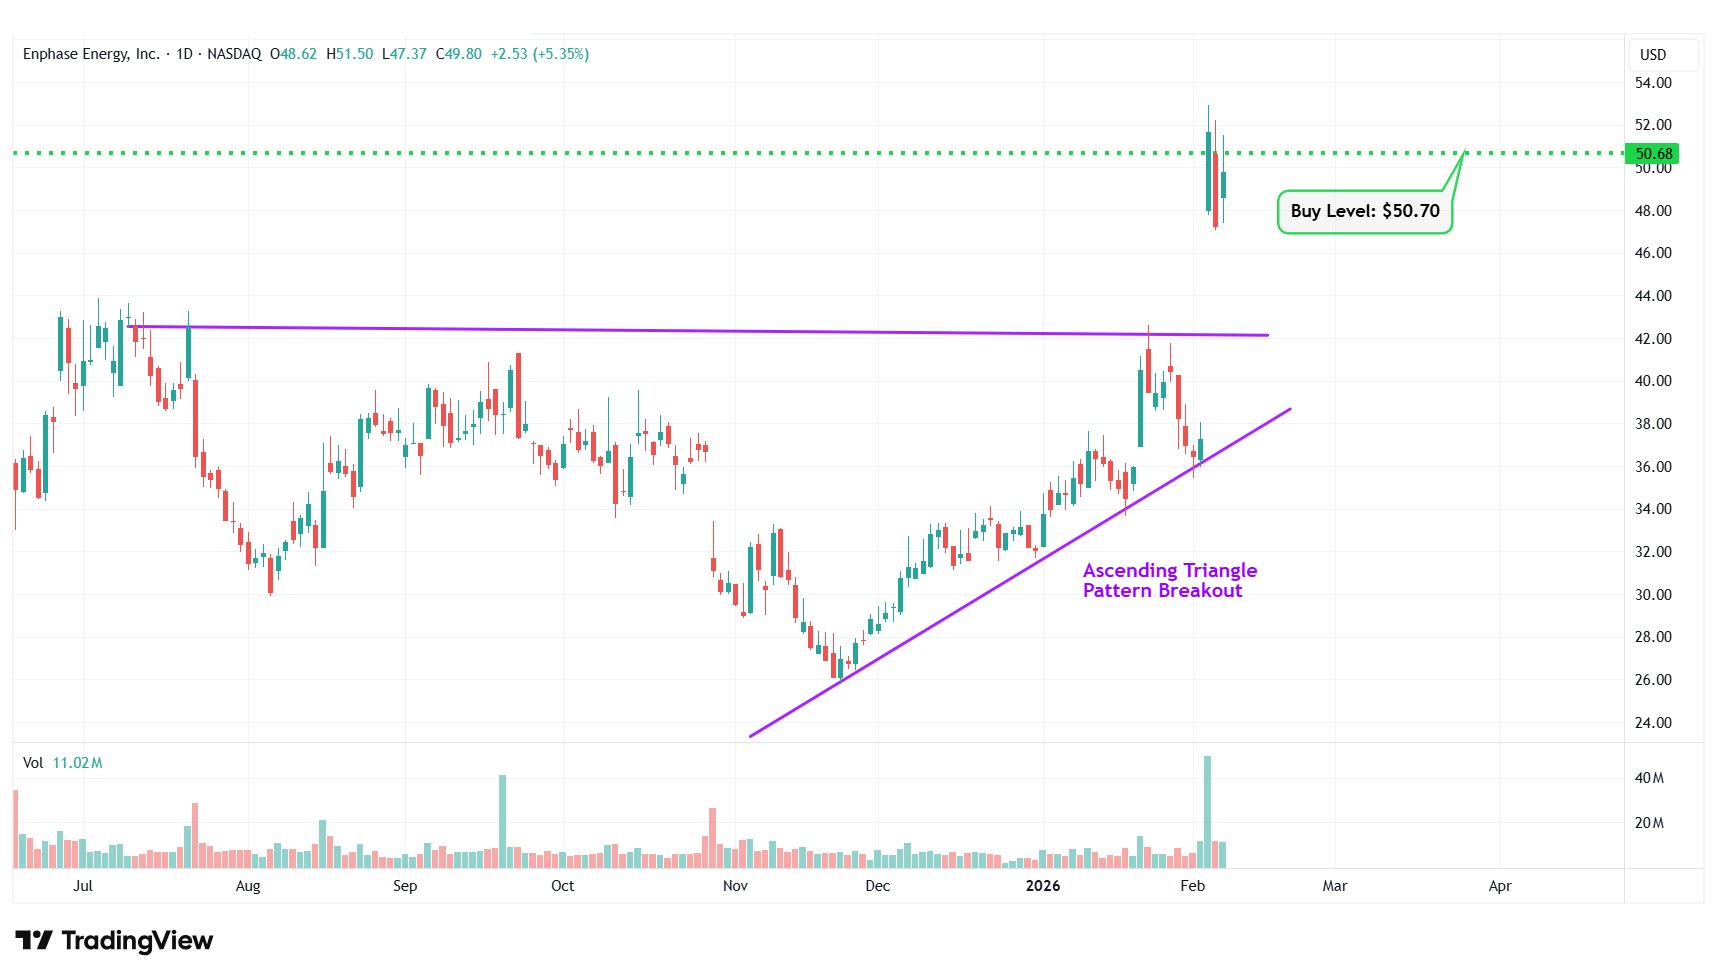
ENPH – Ascending Triangle Pattern Breakout
#2 Super Micro Computer Inc. (NASDAQ: SMCI)
Sector: Technology • Computer Hardware
Reason: Falling Wedge Pattern Breakout
A falling wedge pattern is formed by joining two downward-sloping, converging trendlines having a contracting range. The pattern appears to be wide at the top and continues to contract as prices fall. A breakout from a falling wedge pattern can indicate either reversal or continuation depending on where the pattern appeared in the trend.
A stock that has broken out of a falling wedge pattern would have gained momentum and would have the potential to move higher.
Buy Level(s): The stock has currently broken out of a falling wedge pattern. However, the ideal buy level for SMCI is above the nearest resistance level of $35.40. This is marked in the chart below as a green color dotted line.
Daily chart – SMCI
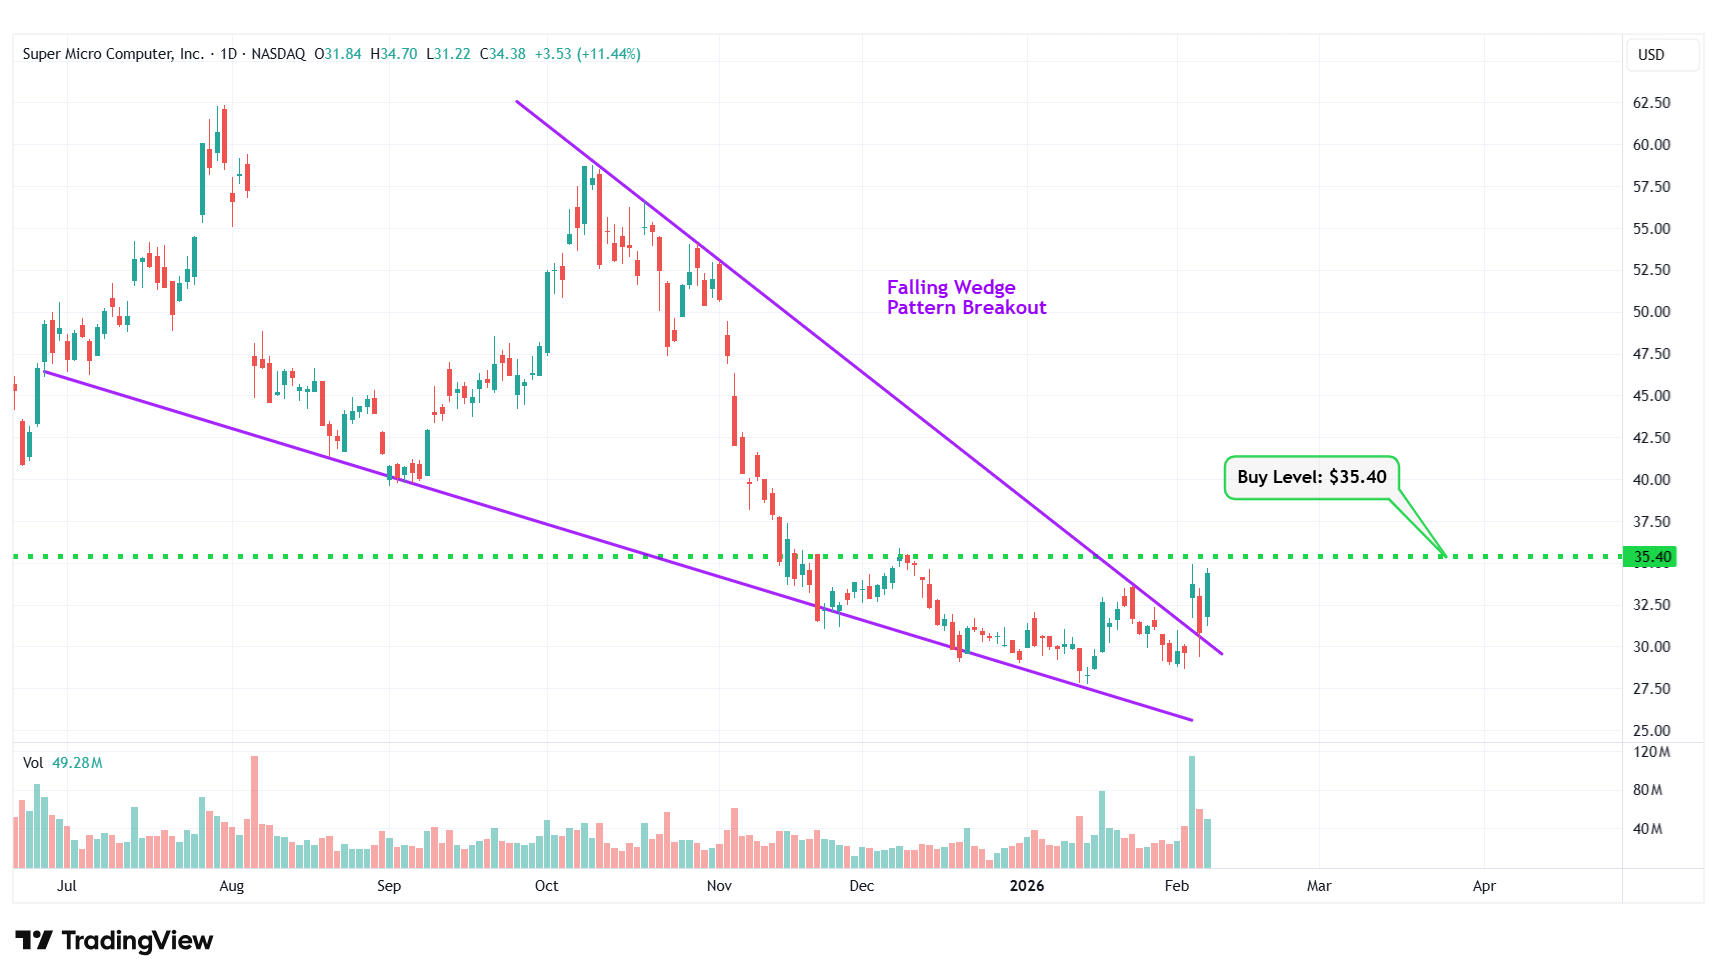
SMCI – Falling Wedge Pattern Breakout
#3 Envista Holdings Corp (NYSE: NVST)
Sector: Healthcare • Medical Instruments & Supplies
Reason: Breakout From an Uptrend Channel
An uptrend channel or an ascending channel is the price action contained between upward sloping parallel lines. It is formed by a lower trend line that connects the swing lows, and an upper channel line that joins the swing highs. A stock usually trades between the two rails of the uptrend channel before finally breaking out from the upper rail.
Buy Level(s): The stock has currently broken out of the uptrend channel. However, the ideal buy level for NVST is if the stock has a daily close above the near-term resistance level of $29.30. This is marked in the chart below as a green color dotted line.
Daily chart – NVST
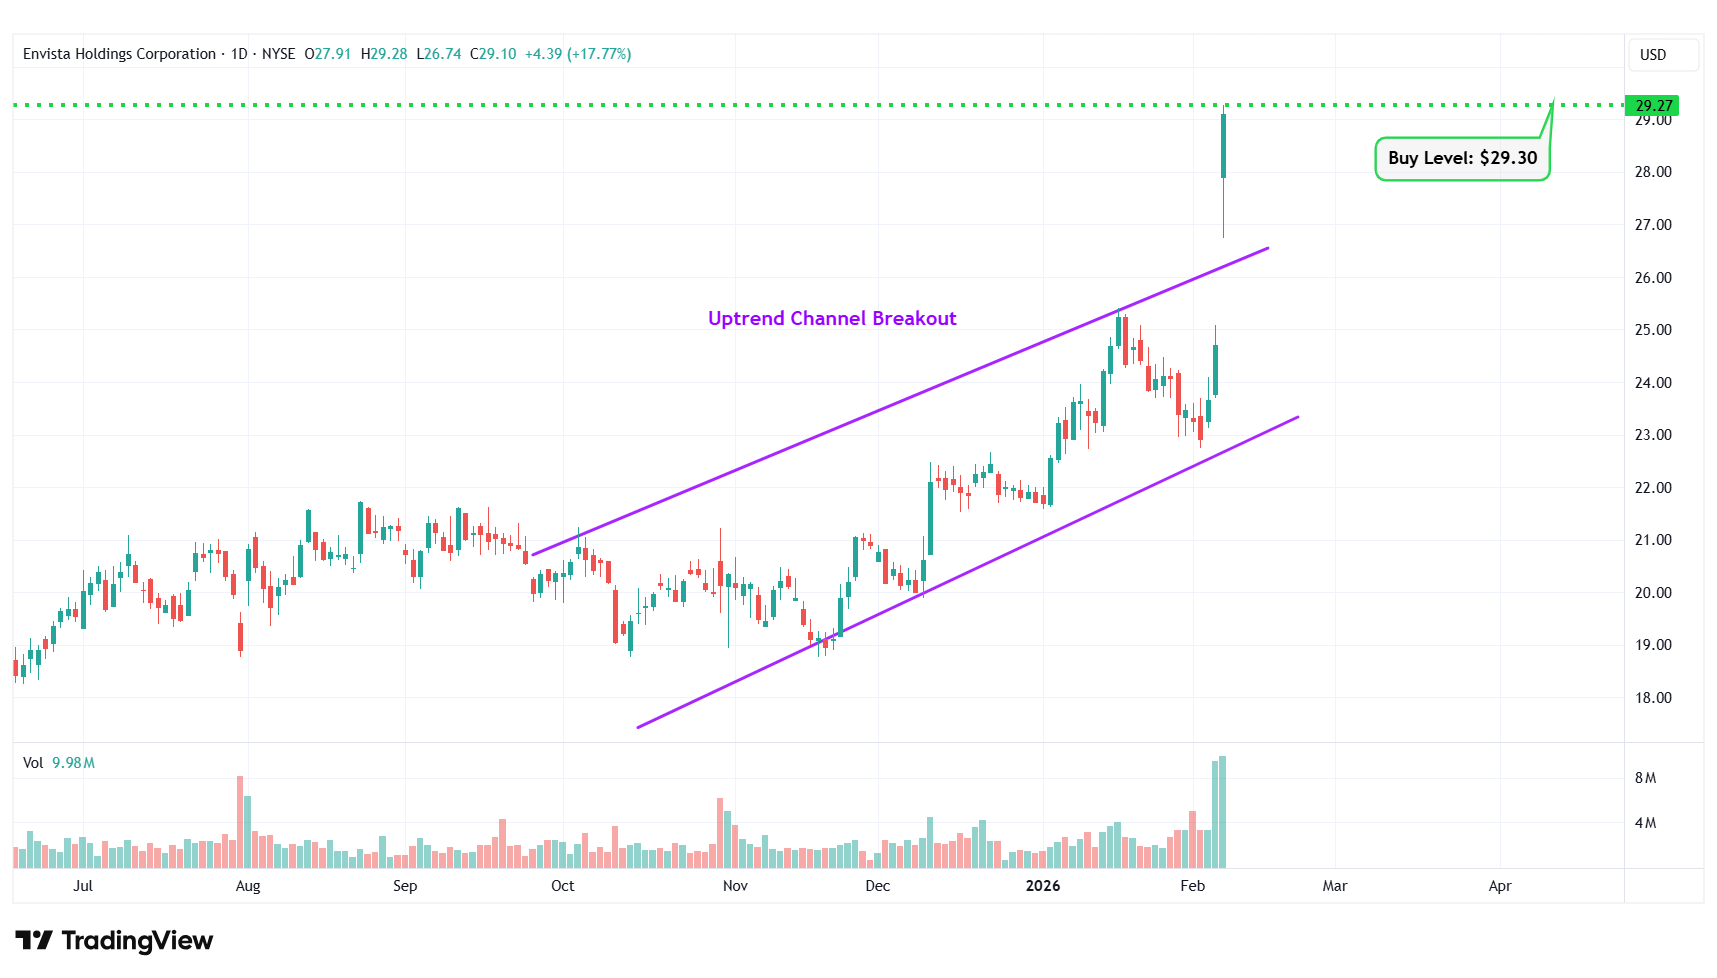
NVST – Uptrend Channel Breakout
#4 Under Armour Inc. (NYSE: UAA)
Sector: Consumer Cyclical • Apparel Manufacturing
Reason: Symmetrical Triangle Pattern Breakout
A symmetrical triangle is a chart pattern formed by two converging trend lines connecting a series of sequential peaks and troughs. These two lines result in the formation of a triangle that appears to be symmetrical.
A symmetrical triangle pattern is usually formed when there is indecision in the price movements and there is uncertainty among the buyers and sellers. This chart pattern represents a period of consolidation before the price breaks out or breaks down. In case a breakout occurs from the upper trend line, it is a strong bullish indication as it signifies the start of a new bullish trend.
Buy Level(s): The stock has currently broken out of a symmetrical triangle pattern. However, the ideal buy level for UAA is if the stock closes above the immediate resistance level of $7.60. This is marked in the chart below as a green color dotted line.
Daily chart – UAA
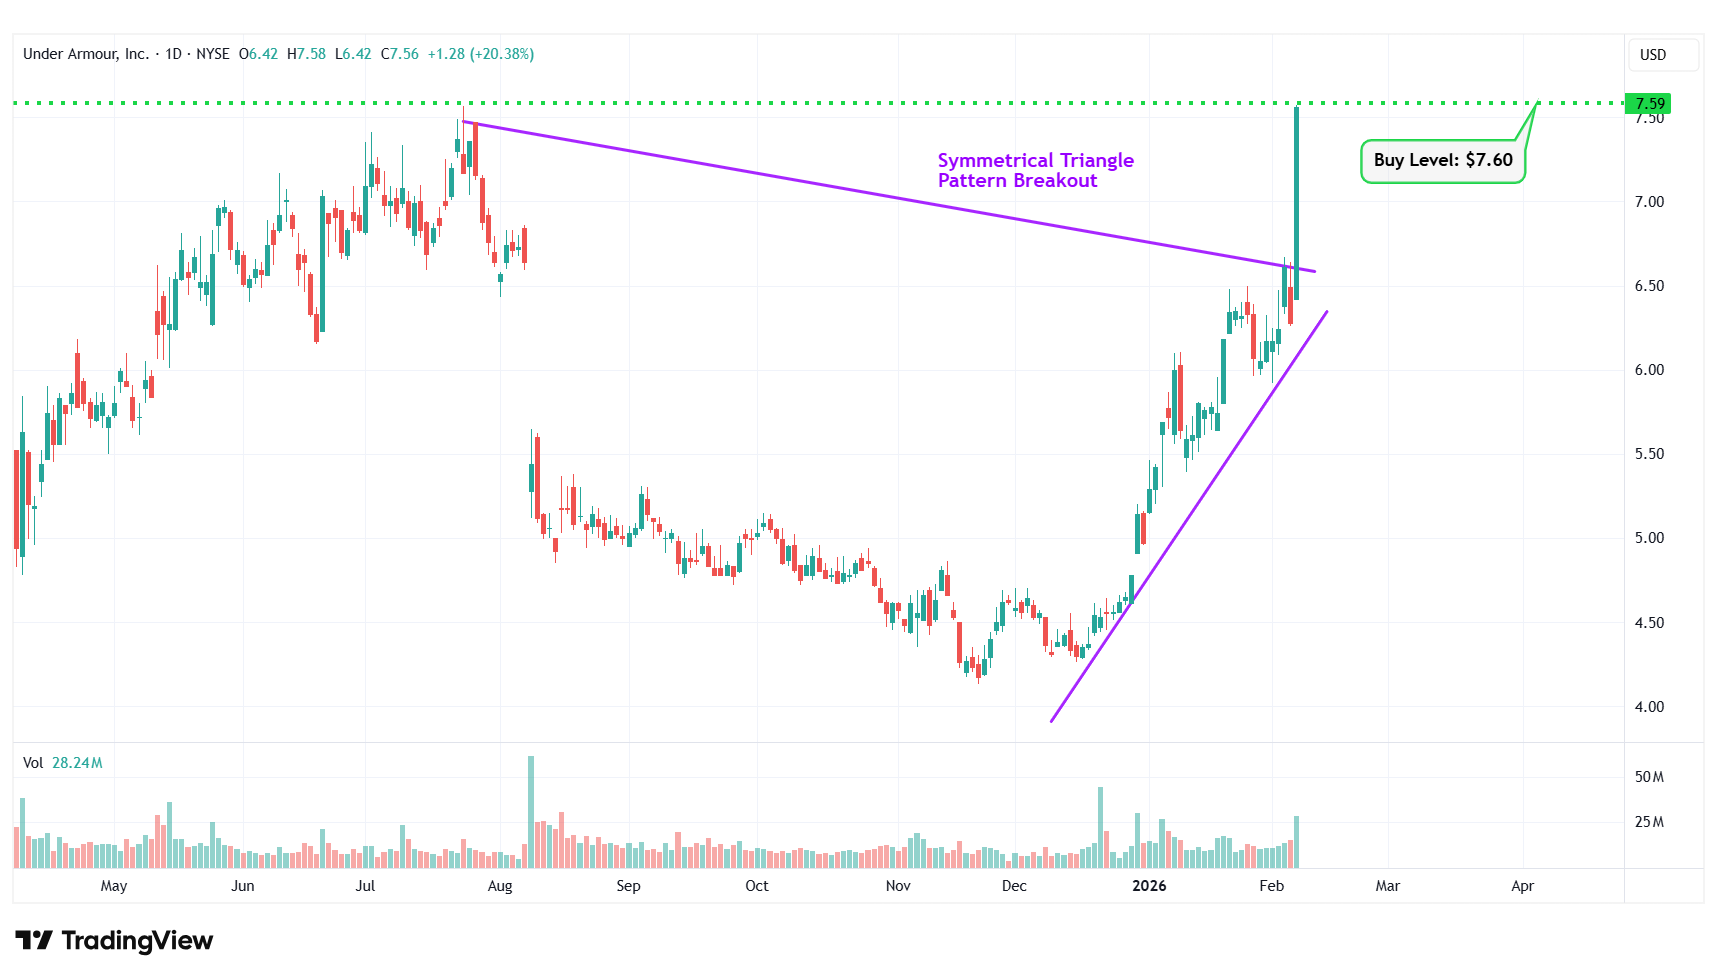
UAA – Symmetrical Triangle Pattern Breakout
#5 Mineralys Therapeutics Inc. (NASDAQ: MLYS)
Sector: Healthcare • Biotechnology
Reason: Formation of a Falling Wedge Pattern
A falling wedge pattern is formed by joining two downward-sloping, converging trendlines having a contracting range. The pattern appears to be wide at the top and continues to contract as prices fall. A breakout from a falling wedge pattern can indicate either reversal or continuation depending on where the pattern appeared in the trend.
A stock that has broken out of a falling wedge pattern would have gained momentum and would have the potential to move higher.
Buy Level(s): The ideal buy level for MLYS is if the stock breaks out of the falling wedge pattern, at a price of around $31.50. This is marked in the chart below as a green color dotted line.
Daily chart – MLYS
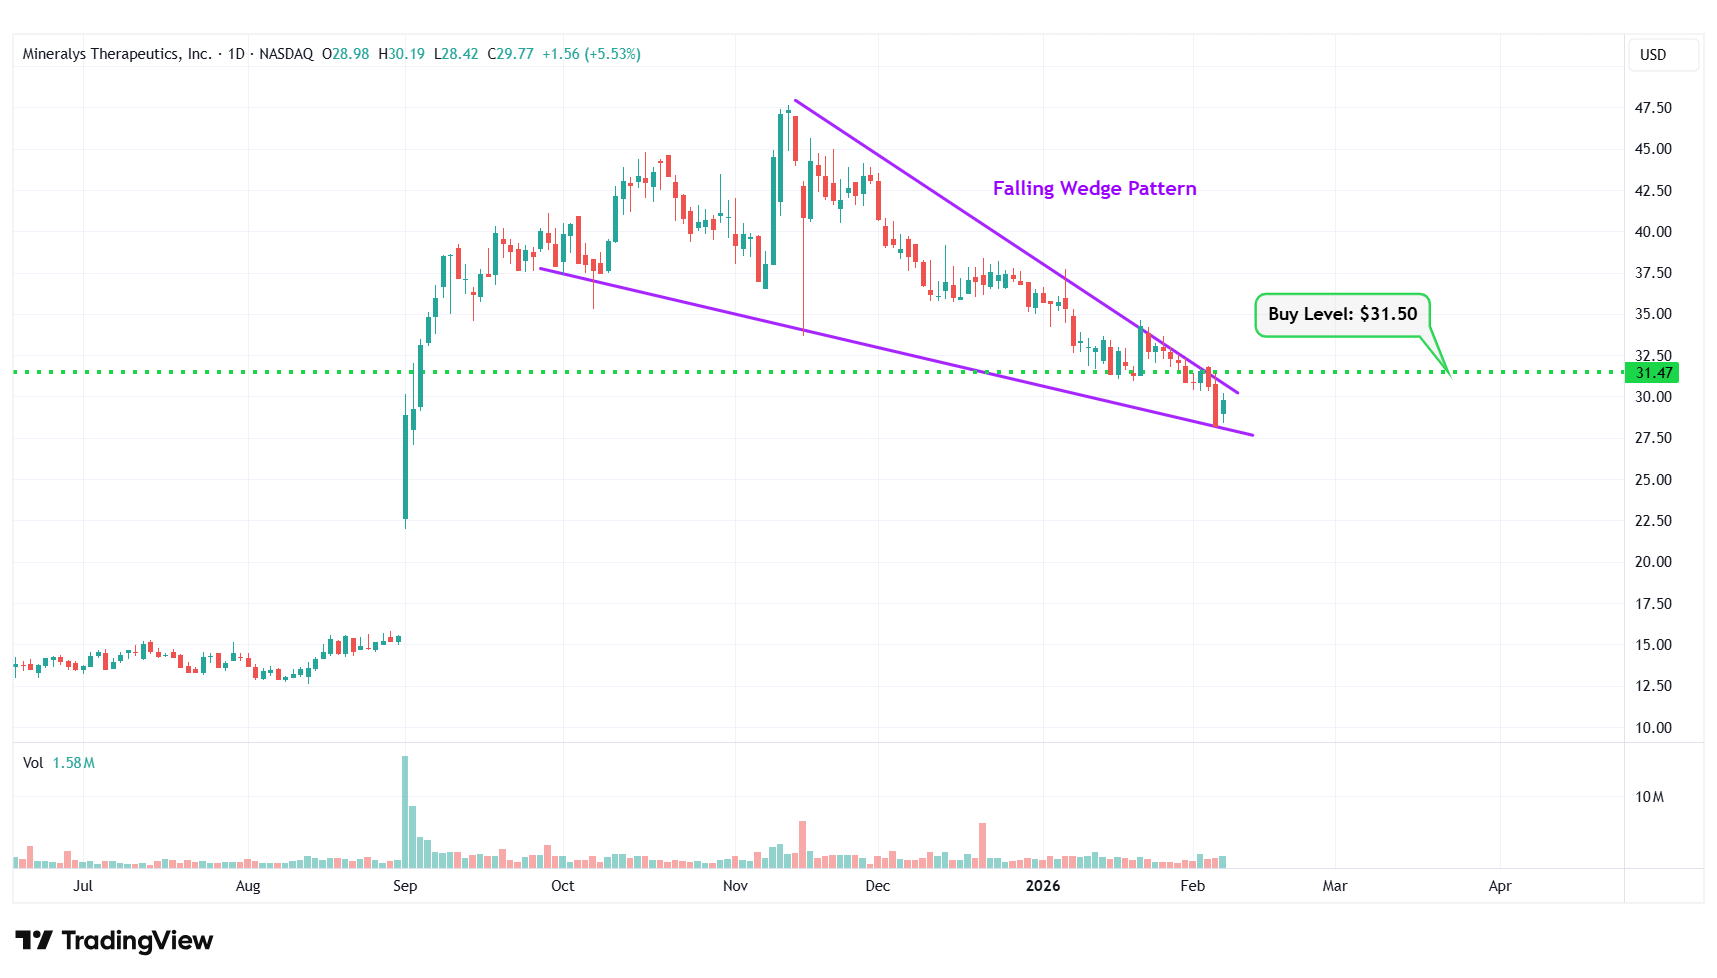
MLYS – Falling Wedge Pattern
#6 EZCorp, Inc. (NASDAQ: EZPW)
Sector: Financial • Credit Services
Reason: Breakout From an Uptrend Channel
An uptrend channel or an ascending channel is the price action contained between upward sloping parallel lines. It is formed by a lower trend line that connects the swing lows, and an upper channel line that joins the swing highs. A stock usually trades between the two rails of the uptrend channel before finally breaking out from the upper rail.
Buy Level(s): The stock has currently broken out of the uptrend channel. However, the ideal buy level for EZPW is if the stock has a daily close above the near-term resistance level of $25.90. This is marked in the chart below as a green color dotted line.
Daily chart – EZPW
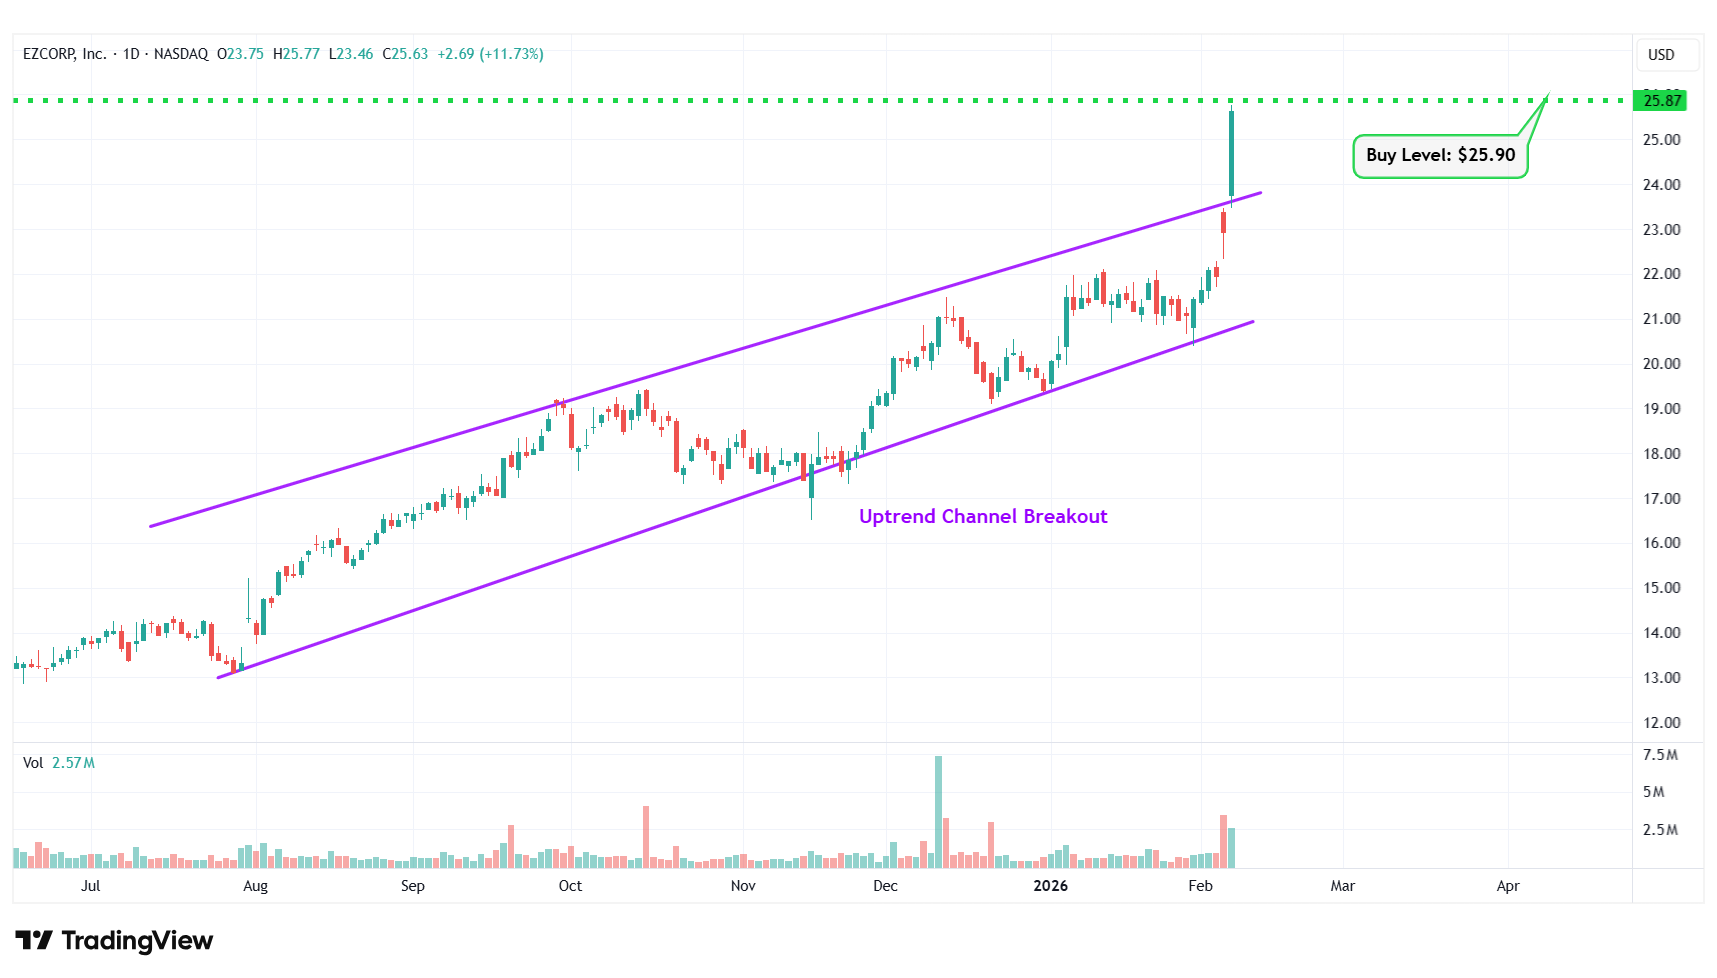
EZPW – Uptrend Channel Breakout
#7 ADT Inc. (NYSE: ADT)
Sector: Industrials • Security & Protection Services
Reason: Formation of a Falling Wedge Pattern
A falling wedge pattern is formed by joining two downward-sloping, converging trendlines having a contracting range. The pattern appears to be wide at the top and continues to contract as prices fall. A breakout from a falling wedge pattern can indicate either reversal or continuation depending on where the pattern appeared in the trend.
A stock that has broken out of a falling wedge pattern would have gained momentum and would have the potential to move higher.
Buy Level(s): The ideal buy level for ADT is if the stock breaks out of the falling wedge pattern, at a price of around $8.20. This is marked in the chart below as a green color dotted line.
Daily chart – ADT
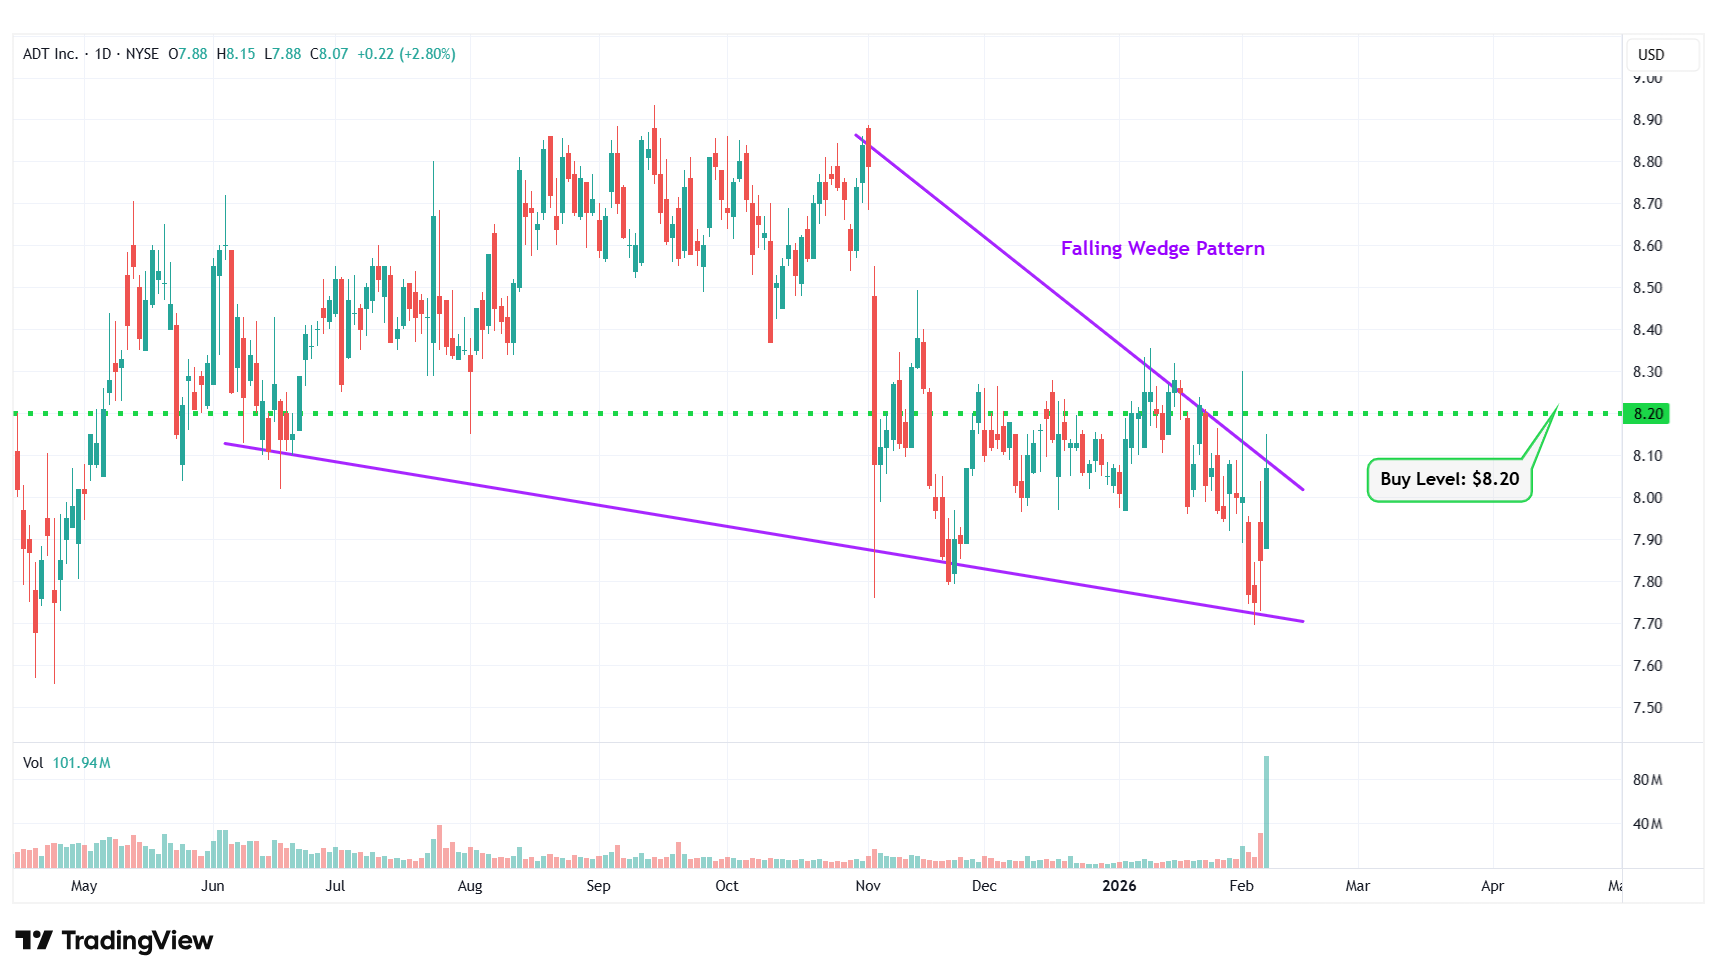
ADT – Falling Wedge Pattern
#8 JPMorgan Chase & Co (NYSE: JPM)
Sector: Financial • Banks – Diversified
Reason: Formation of an Uptrend Channel
An uptrend channel or an ascending channel is the price action contained between upward sloping parallel lines. It is formed by a lower trend line that connects the swing lows, and an upper channel line that joins the swing highs. A stock usually trades between the two rails of the uptrend channel before finally breaking out from the upper rail.
Buy Level(s): The ideal buy level for JPM is if the stock breaks out of the uptrend channel and has a daily close above $327.00. This is marked in the chart below as a green color dotted line.
Daily chart – JPM
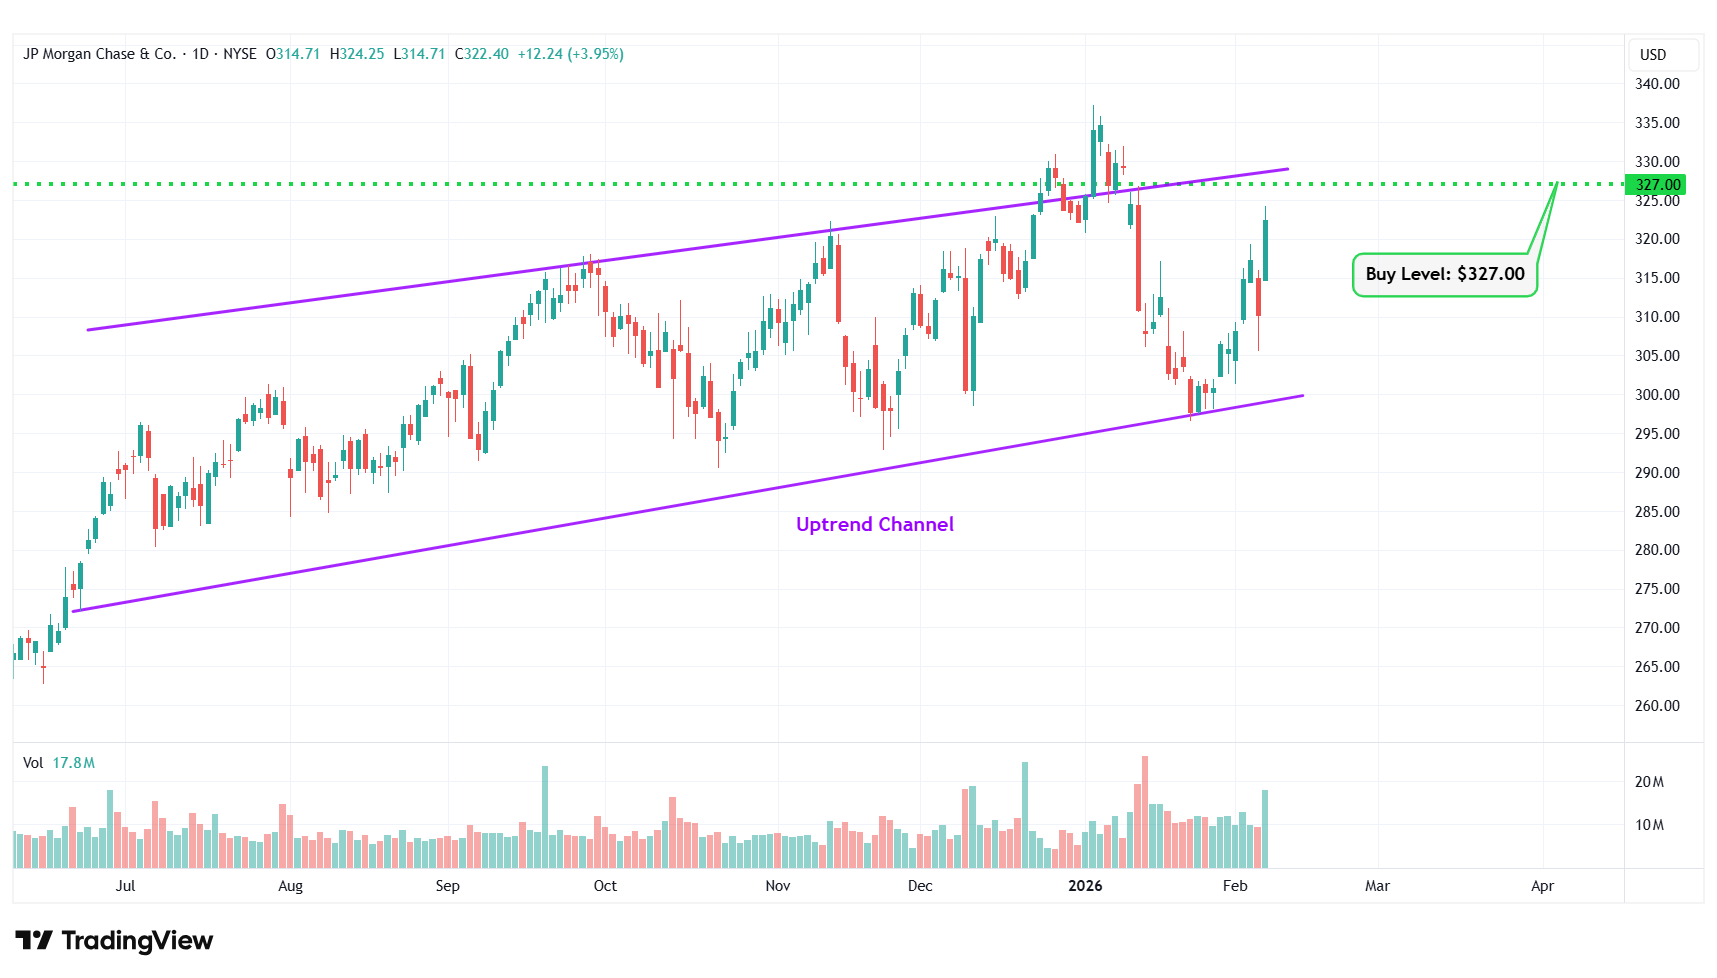
JPM – Uptrend Channel
#9 SMX (Security Matters) Plc. (NASDAQ: SMX)
Sector: Industrials • Specialty Business Services
Reason: Symmetrical Triangle Pattern Breakout
A symmetrical triangle is a chart pattern formed by two converging trend lines connecting a series of sequential peaks and troughs. These two lines result in the formation of a triangle that appears to be symmetrical.
A symmetrical triangle pattern is usually formed when there is indecision in the price movements and there is uncertainty among the buyers and sellers. This chart pattern represents a period of consolidation before the price breaks out or breaks down. In case a breakout occurs from the upper trend line, it is a strong bullish indication as it signifies the start of a new bullish trend.
Buy Level(s): The stock has currently broken out of a symmetrical triangle pattern. However, the ideal buy level for SMX is if the stock closes above the immediate resistance level of $18.00. This is marked in the chart below as a green color dotted line.
Daily chart – SMX
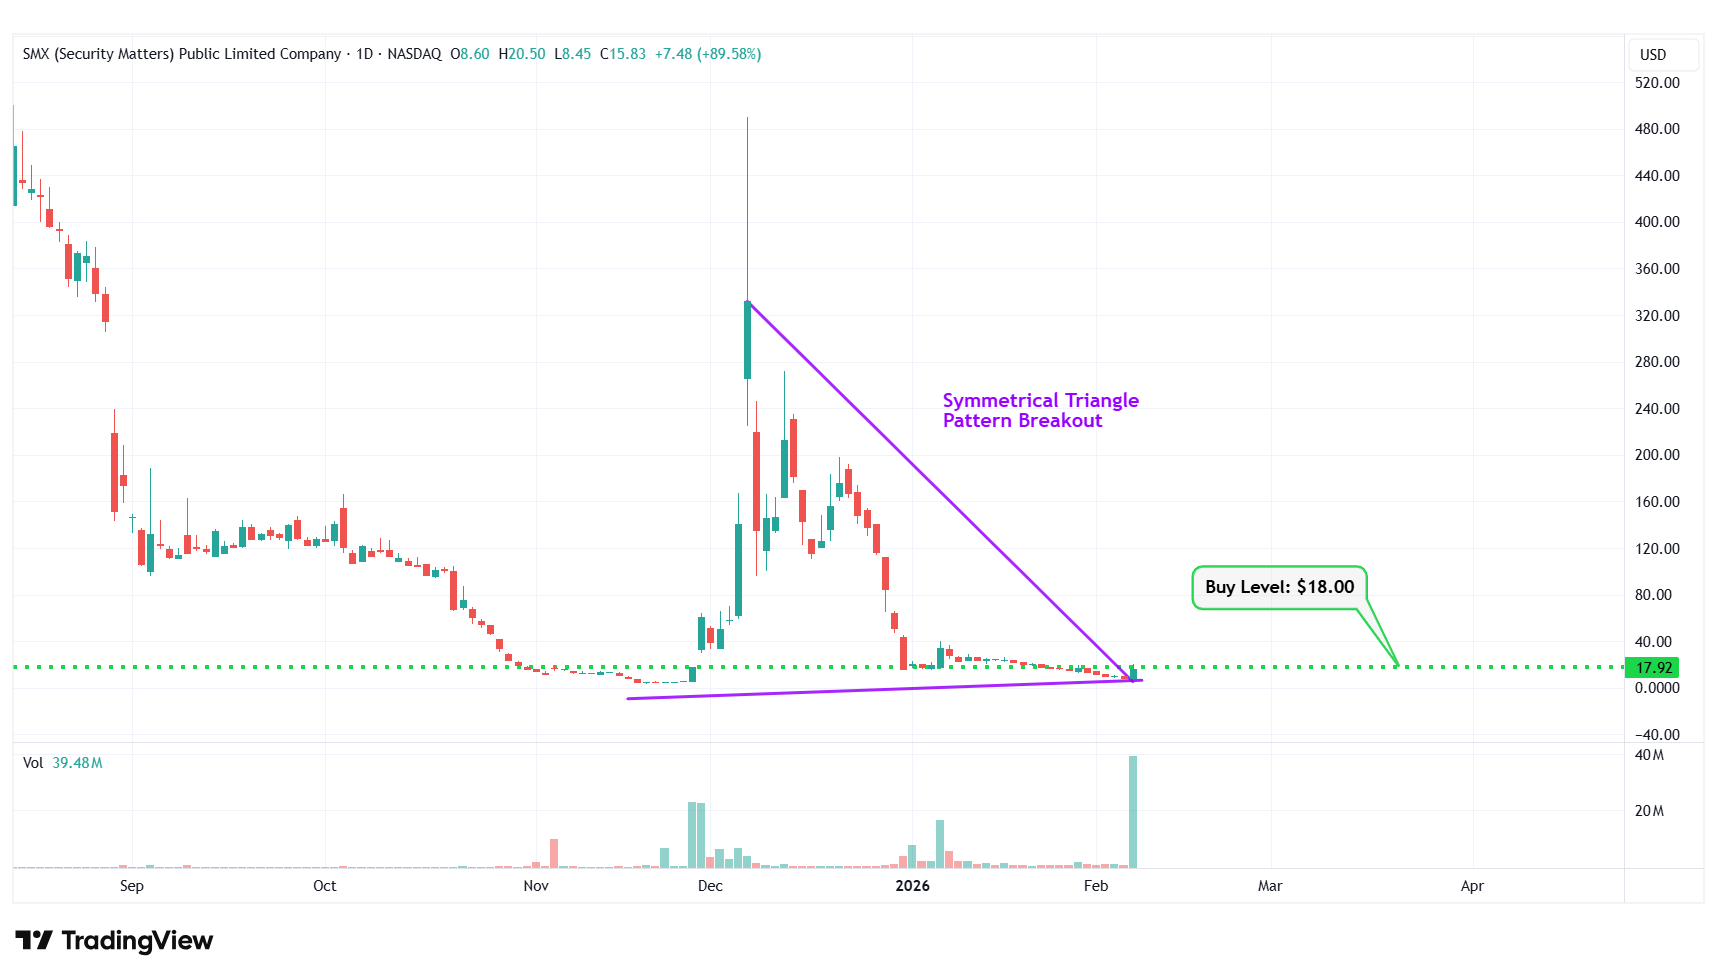
SMX – Symmetrical Triangle Pattern Breakout
#10 NRG Energy Inc. (NYSE: NRG)
Sector: Utilities • Utilities – Independent Power Producers
Reason: Formation of a Falling Wedge Pattern
A falling wedge pattern is formed by joining two downward-sloping, converging trendlines having a contracting range. The pattern appears to be wide at the top and continues to contract as prices fall. A breakout from a falling wedge pattern can indicate either reversal or continuation depending on where the pattern appeared in the trend.
A stock that has broken out of a falling wedge pattern would have gained momentum and would have the potential to move higher.
Buy Level(s): The ideal buy level for NRG is if the stock breaks out of the falling wedge pattern, at a price of around $154.80. This is marked in the chart below as a green color dotted line.
Daily chart – NRG
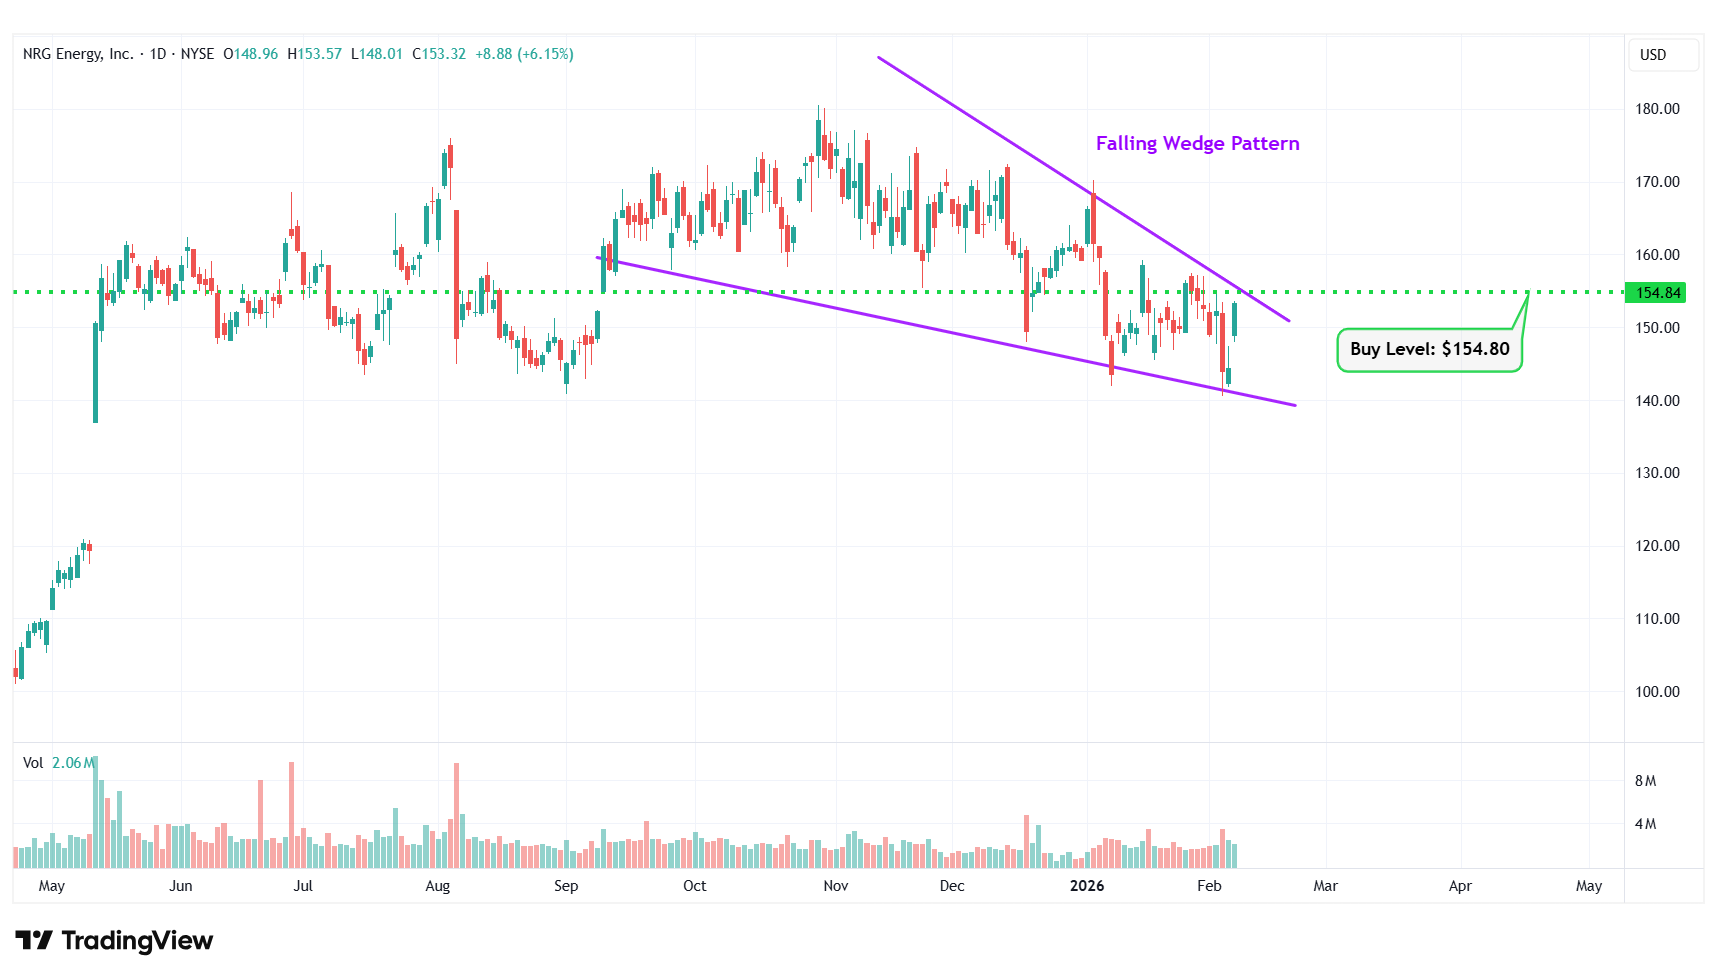
NRG – Falling Wedge Pattern
Happy Trading!
Trades of The Day Research Team
Imagine having 12 new monthly income checks, carrying the potential of up to 21% yields.This is possible because of a tested strategy to get paid out regularly, like a paycheck. For over a decade, I have helped more than 26,000 investors secure 12 new monthly payouts. Meaning, you know exactly how much you'll make every month... Because of some stocks that pay us 8%,13.4%, and even 21.6% yields. See it for yourself here.
Source: Trades of the Day

