Picking a winning trade on a consistent basis is not simply a stroke of luck. It’s the result of calculated screening, planning, and deliberation.
With this in mind, we have started a new weekly series on our top 10 stocks to watch this week — stocks that look poised for a possible breakout in the coming days. Traders should add these stocks to their watchlist now.
The Top 10 Stocks to Watch This Week for Possible Breakouts
| Sl # | Name of the Stock | Stock Ticker | Last Close | Buy Level(s) | Reason |
| 1 | GDS Holdings Limited ADR | NASDAQ: GDS | $38.34 | $39.00 | Symmetrical Triangle Pattern Breakout |
| 2 | Micron Technology Inc. | NASDAQ: MU | $315.42 | $316.80 | Uptrend Channel Breakout |
| 3 | Equinor ASA ADR | NYSE: EQNR | $24.55 | $24.60 | Downtrend Channel Breakout |
| 4 | Patterson-UTI Energy Inc. | NASDAQ: PTEN | $6.47 | $6.90 | Consolidation Area |
| 5 | AST SpaceMobile Inc. | NASDAQ: ASTS | $83.47 | $86.10 | Symmetrical Triangle Pattern |
| 6 |
Sable Offshore Corp |
NYSE: SOC | $11.73 | $12.10 | Downtrend Channel Breakout |
| 7 | Alibaba Group Holding Ltd ADR | NYSE: BABA | $155.74 | $155.90 | Symmetrical Triangle Pattern Breakout |
| 8 | Taiwan Semiconductor Manufacturing ADR | NYSE: TSM | $319.61 | $321.40 | Breakout From Consolidation Area |
| 9 | Redwire Corporation | NYSE: RDW | $9.03 | $9.30 | Falling Wedge Pattern Breakout |
| 10 | UP Fintech Holding Ltd ADR | NASDAQ: TIGR | $10.44 | $10.70 | Symmetrical Triangle Pattern Breakout |
Important: Typically, these trades offer a risk: reward ratio of 1:2 or 1:3 in the next 6 months, which implies 2x to 3x rewards when compared to risks. So, be sure to set your stop-loss levels and target prices accordingly to manage your risk. In addition, these trade ideas are triggered using daily closing prices, not intra-day pricing. So, if you participate in these trades, make sure that you only buy the stock once its daily close is above the recommended price level.
That said, here are the top 10 stocks to watch for a breakout, in no particular order.
#1 GDS Holdings Limited ADR (NASDAQ: GDS)
Sector: Technology • Information Technology Services
Reason: Symmetrical Triangle Pattern Breakout
A symmetrical triangle is a chart pattern formed by two converging trend lines connecting a series of sequential peaks and troughs. These two lines result in the formation of a triangle that appears to be symmetrical.
A symmetrical triangle pattern is usually formed when there is indecision in the price movements and there is uncertainty among the buyers and sellers. This chart pattern represents a period of consolidation before the price breaks out or breaks down. In case a breakout occurs from the upper trend line, it is a strong bullish indication as it signifies the start of a new bullish trend.
Buy Level(s): The stock has currently broken out of a symmetrical triangle pattern. However, the ideal buy level for GDS is if the stock closes above the immediate resistance level of $39.00. This is marked in the chart below as a green color dotted line.
Daily chart – GDS
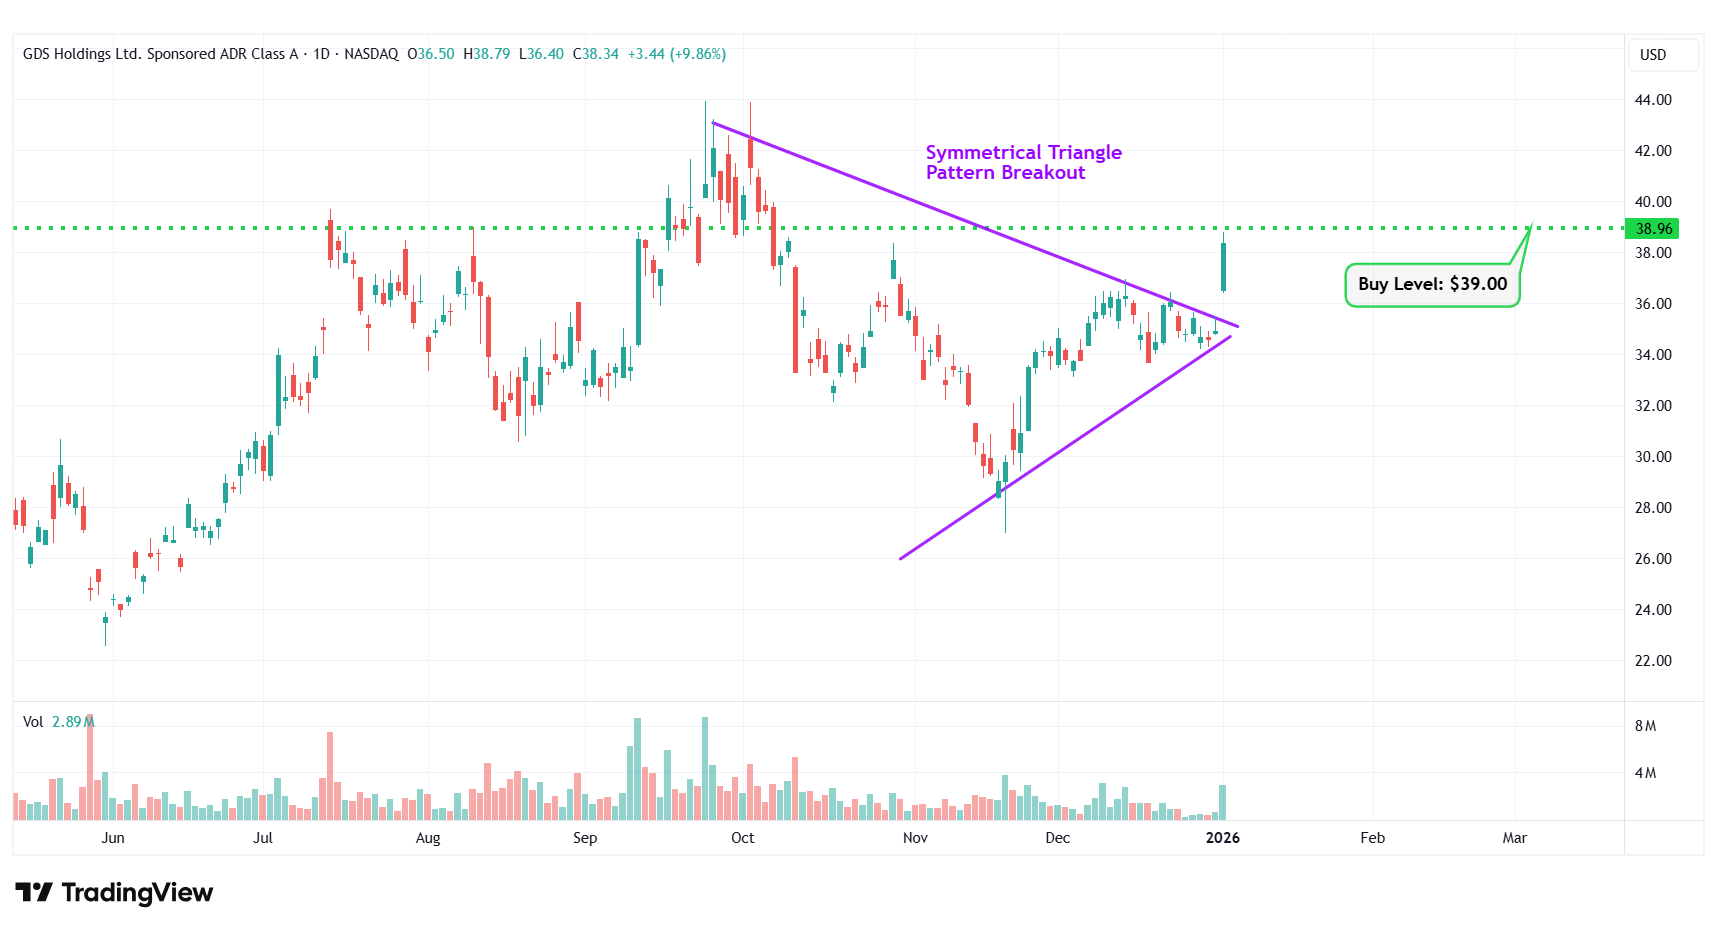
GDS – Symmetrical Triangle Pattern Breakout
#2 Micron Technology Inc. (NASDAQ: MU)
Sector: Technology • Semiconductors
Reason: Breakout From an Uptrend Channel
An uptrend channel or an ascending channel is the price action contained between upward sloping parallel lines. It is formed by a lower trend line that connects the swing lows, and an upper channel line that joins the swing highs. A stock usually trades between the two rails of the uptrend channel before finally breaking out from the upper rail.
Buy Level(s): The stock has currently broken out of the uptrend channel. However, the ideal buy level for MU is if the stock has a daily close above the near-term resistance level of $316.80. This is marked in the chart below as a green color dotted line.
Daily chart – MU
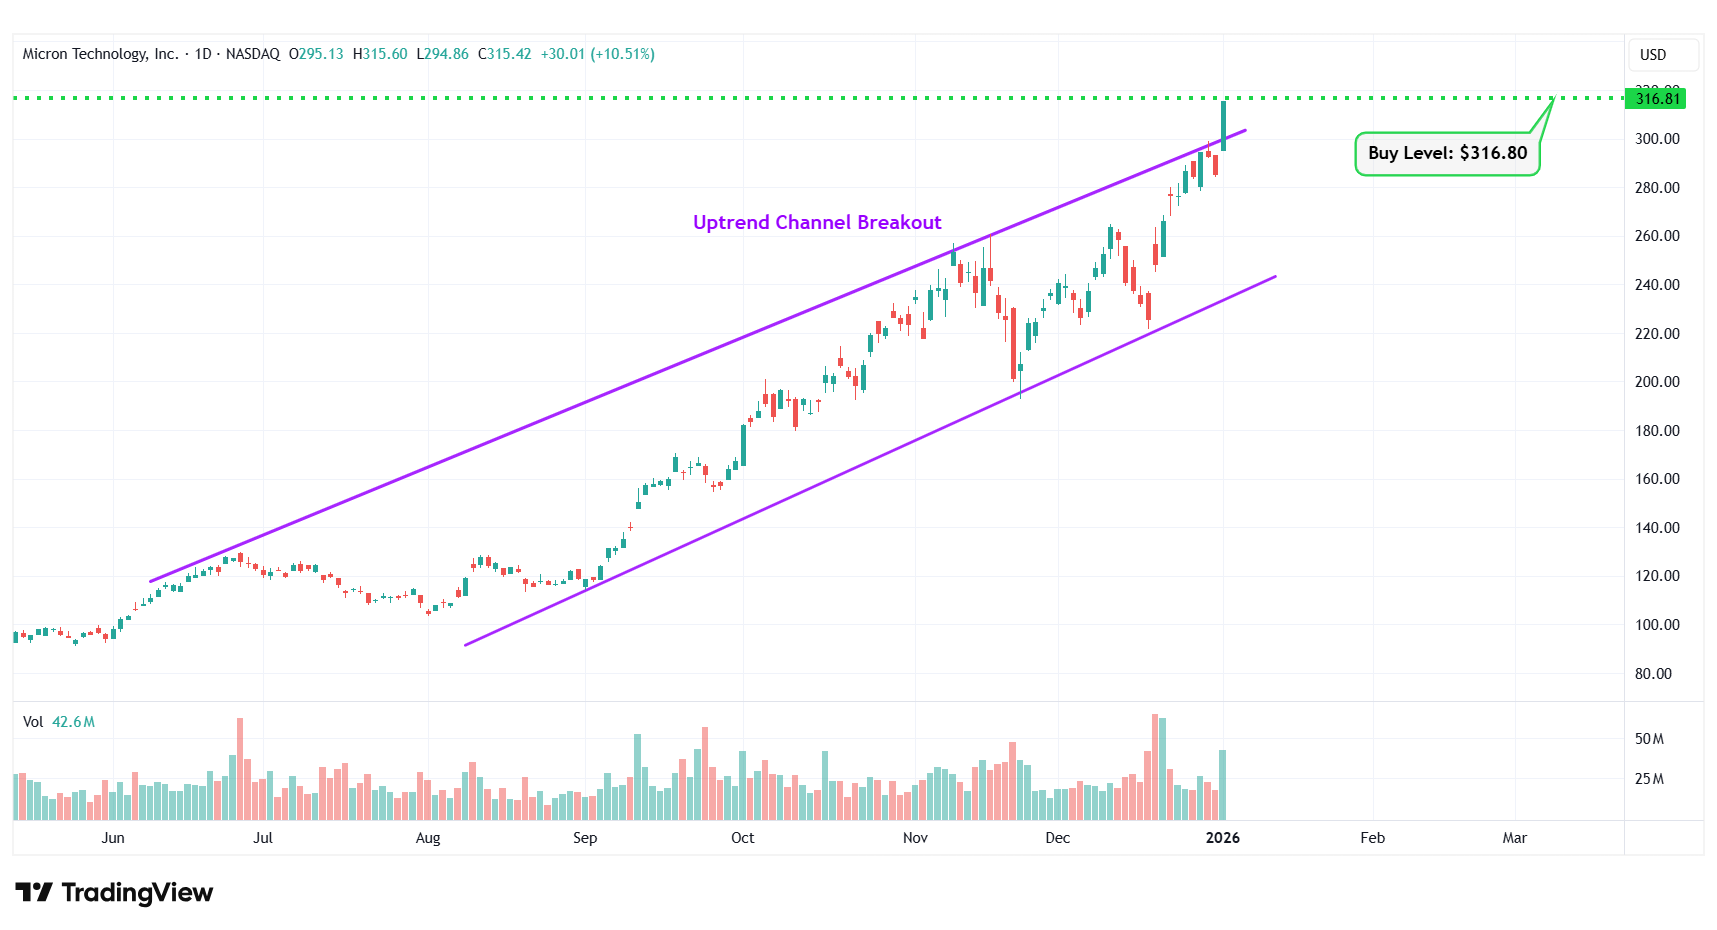
MU – Uptrend Channel Breakout
#3 Equinor ASA ADR (NYSE: EQNR)
Sector: Energy • Oil & Gas Integrated
Reason: Downtrend Channel Breakout
A downtrend or descending channel is the price action contained between downward sloping parallel lines. It is formed by two lines that are drawn by connecting the lower highs and lower lows of a stock’s price. Even though this is typically a bearish pattern, a breakout from the upper rail of this pattern is considered a good bullish indication.
Buy Level(s): The daily chart shows that the stock has currently broken out of a downtrend channel. However, there is a near-term resistance level for the stock. Hence, the ideal buy level for EQNR is if the stock has a daily close above $24.60. This is marked in the chart below as a green color dotted line.
Daily chart – EQNR
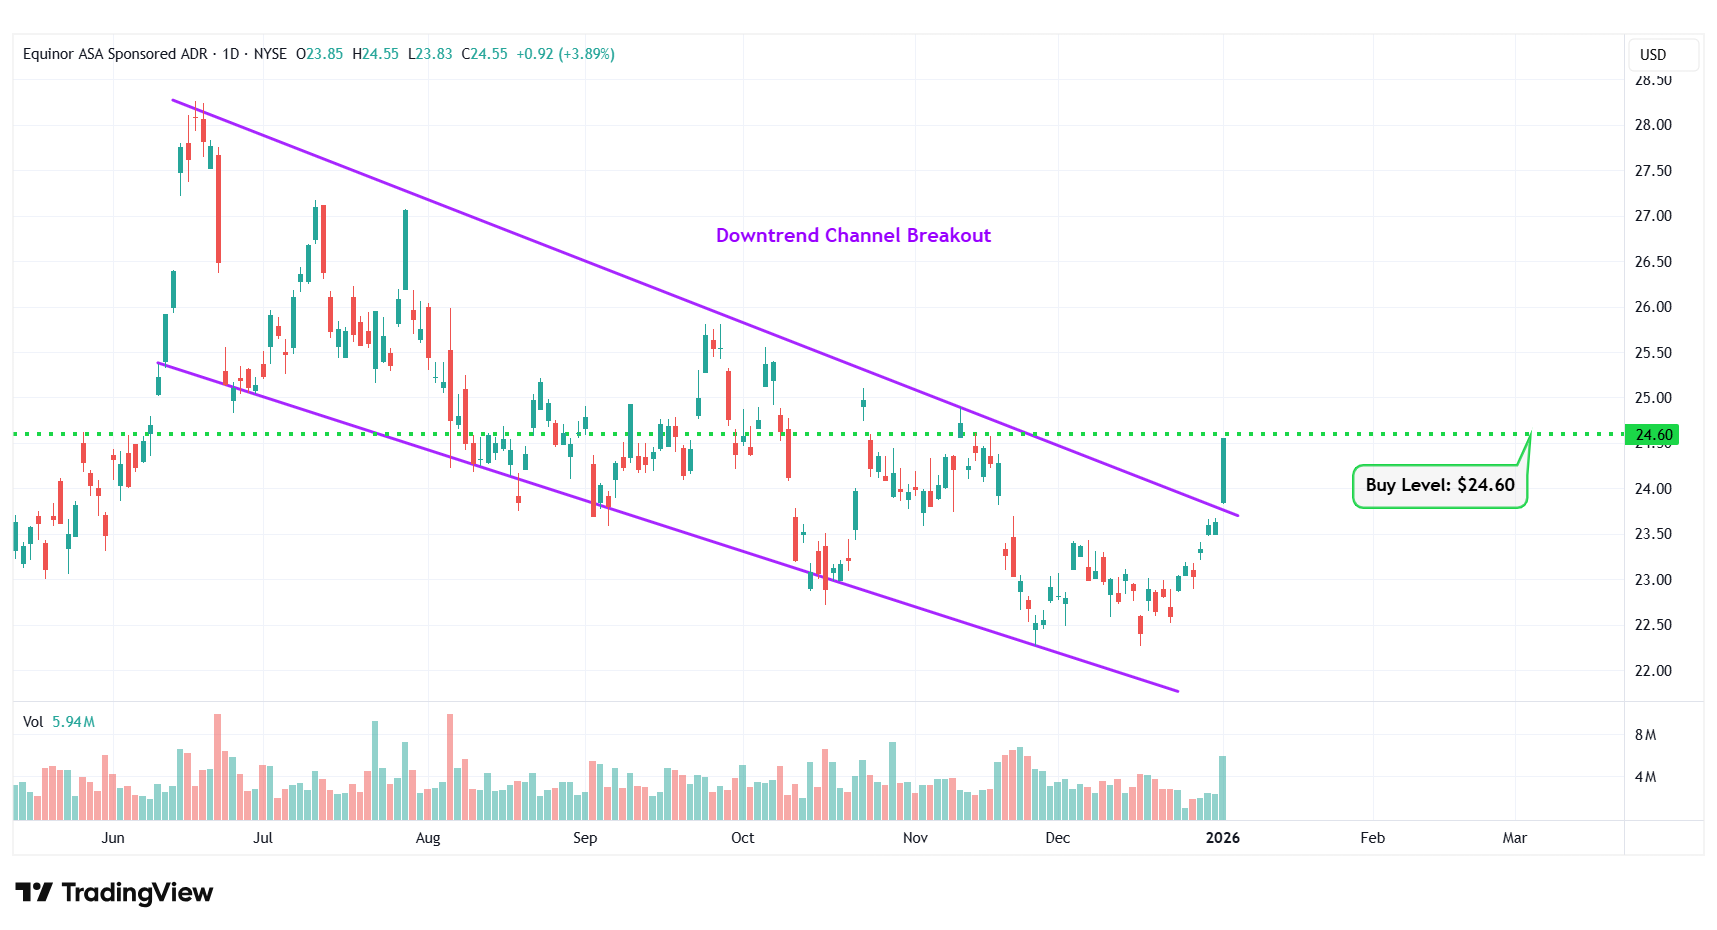
EQNR – Downtrend Channel Breakout
#4 Patterson-UTI Energy Inc. (NASDAQ: PTEN)
Sector: Energy • Oil & Gas Drilling
Reason: Formation of a Consolidation Area in the Daily Chart
A Consolidation Area is a price action contained between two parallel lines. It is formed by a lower line that connects the lows, and an upper line that joins the highs. A stock usually trades between the two lines of the consolidation area before finally breaking out from the upper rail.
Buy Level(s): The ideal buy level for PTEN is above the breakout level of the consolidation area, at around $6.90. This is marked in the chart below as a green color dotted line.
Daily chart – PTEN
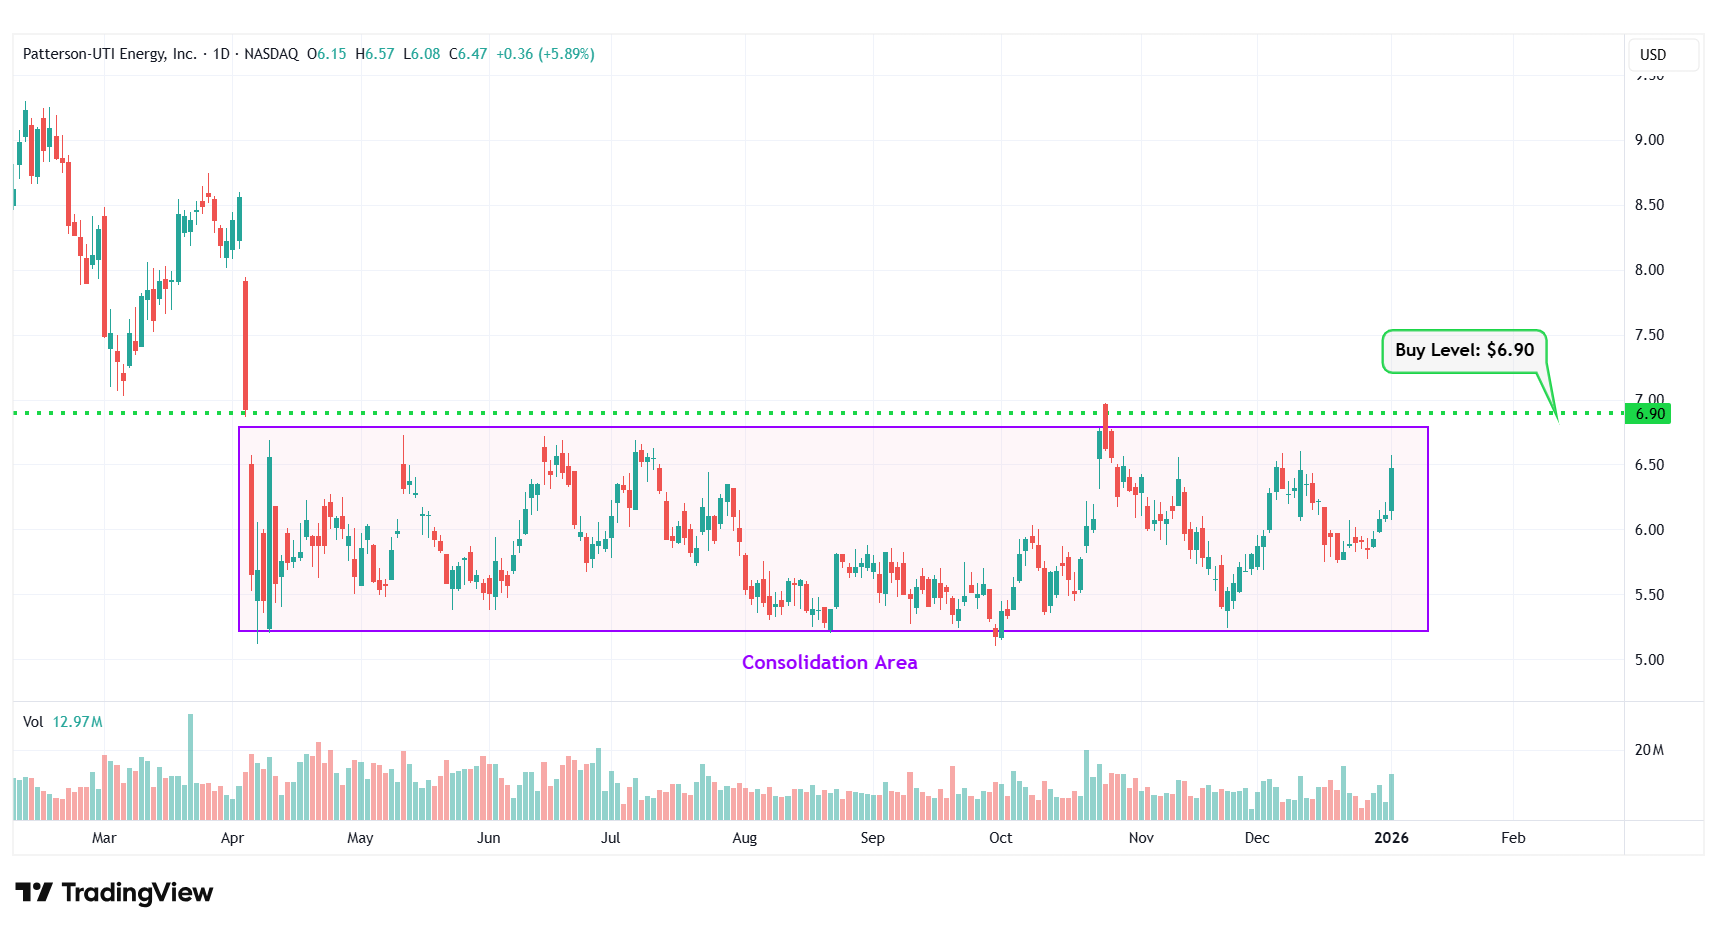
PTEN – Consolidation Area
#5 AST SpaceMobile Inc. (NASDAQ: ASTS)
Sector: Technology • Communication Equipment
Reason: Formation of a Symmetrical Triangle Pattern
A symmetrical triangle is a chart pattern formed by two converging trend lines connecting a series of sequential peaks and troughs. These two lines result in the formation of a triangle that appears to be symmetrical.
A symmetrical triangle pattern is usually formed when there is indecision in the price movements and there is uncertainty among the buyers and sellers. This chart pattern represents a period of consolidation before the price breaks out or breaks down. In case a breakout occurs from the upper trend line, it is a strong bullish indication as it signifies the start of a new bullish trend.
Buy Level(s): The ideal buy level for ASTS is if the stock has a daily close above the breakout level of the symmetrical triangle pattern, at around $86.10. This is marked in the chart below as a green color dotted line.
Daily chart – ASTS
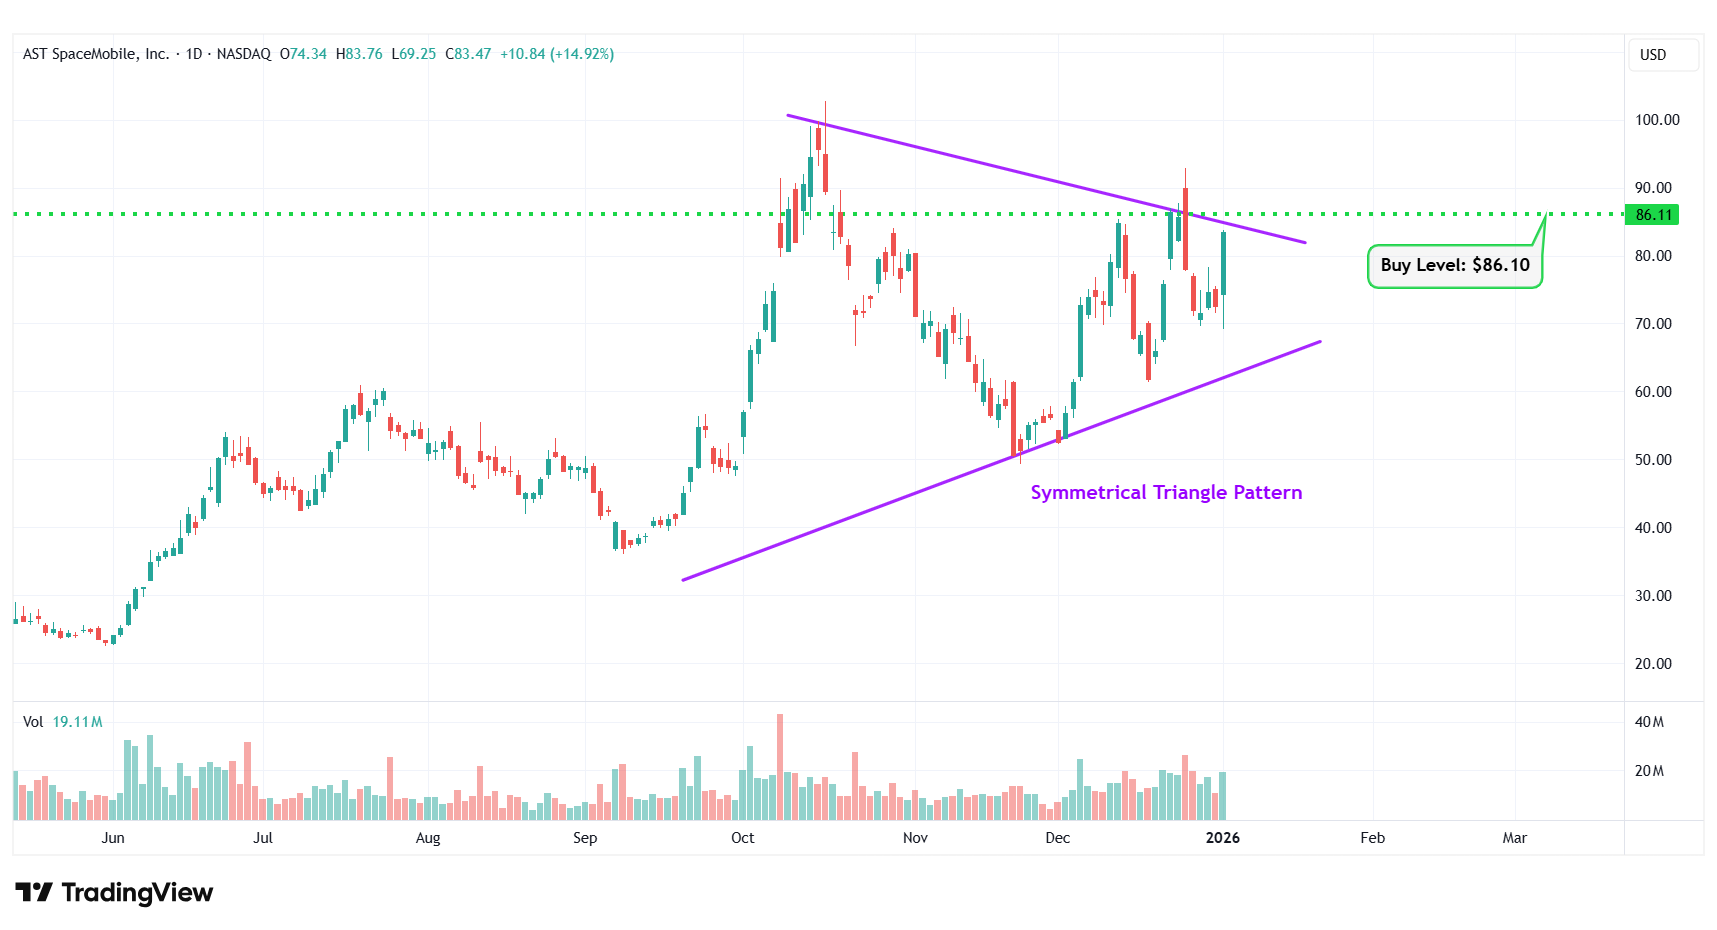
ASTS – Symmetrical Triangle Pattern
#6 Sable Offshore Corp (NYSE: SOC)
Sector: Energy • Oil & Gas Drilling
Reason: Downtrend Channel Breakout
A downtrend or descending channel is the price action contained between downward sloping parallel lines. It is formed by two lines that are drawn by connecting the lower highs and lower lows of a stock’s price. Even though this is typically a bearish pattern, a breakout from the upper rail of this pattern is considered a good bullish indication.
Buy Level(s): The daily chart shows that the stock has currently broken out of a downtrend channel. However, there is a near-term resistance level for the stock. Hence, the ideal buy level for SOC is if the stock has a daily close above $12.10. This is marked in the chart below as a green color dotted line.
Daily chart – SOC
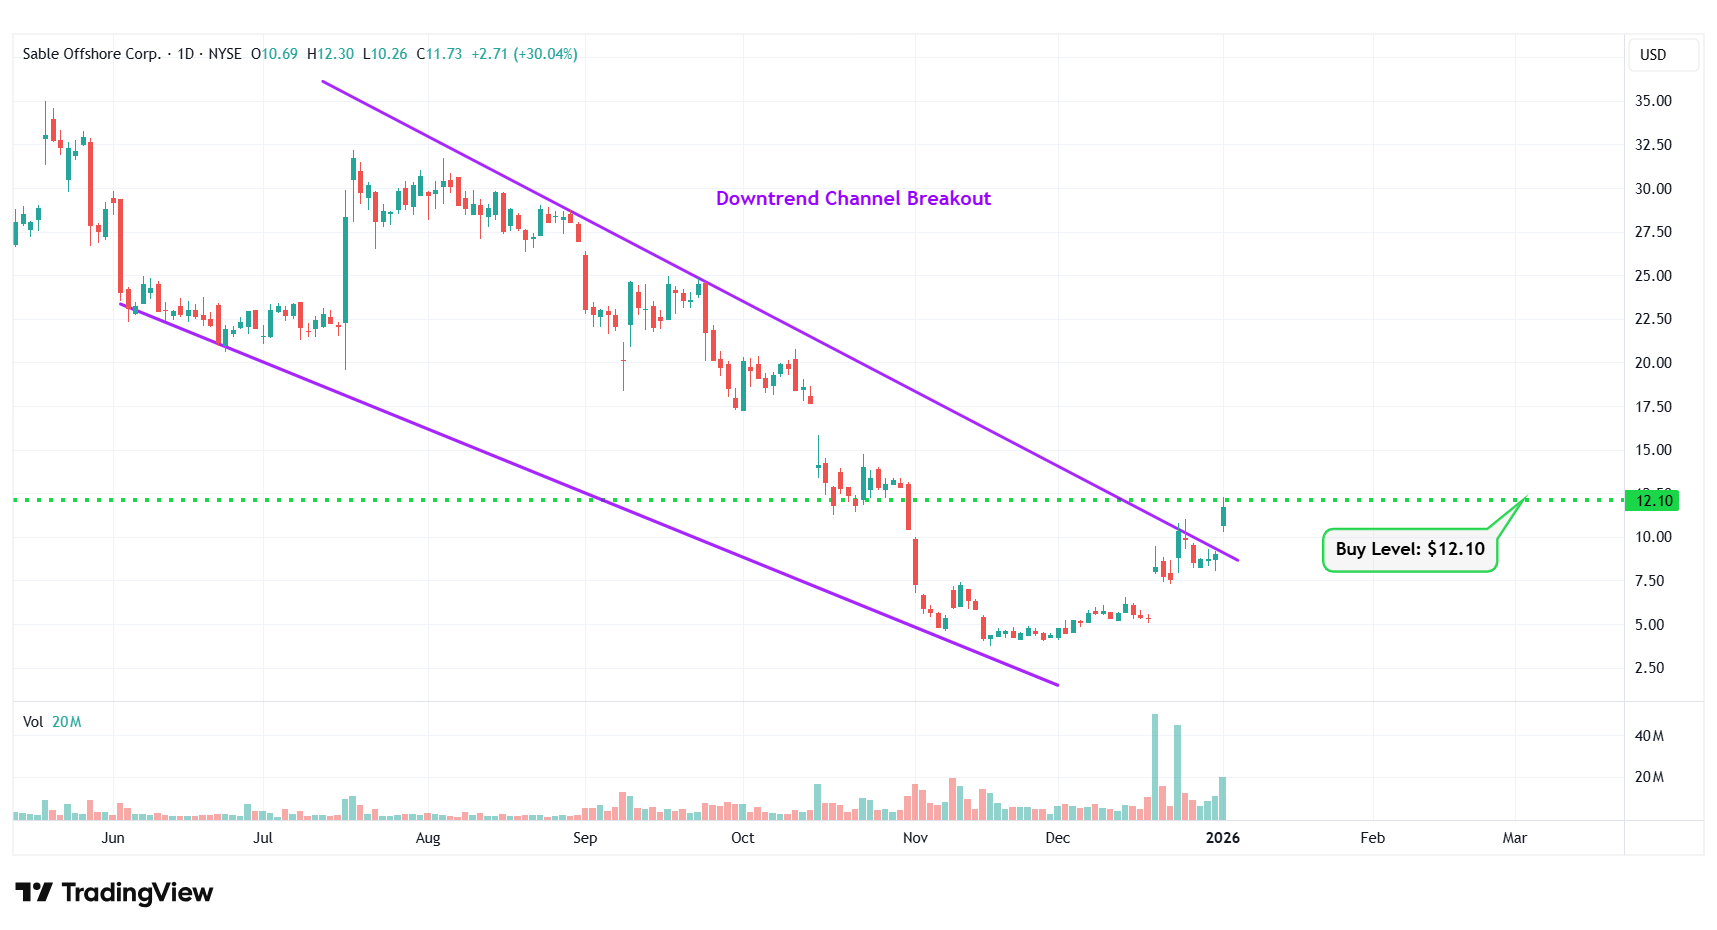
SOC – Downtrend Channel Breakout
#7 Alibaba Group Holding Ltd ADR (NYSE: BABA)
Sector: Consumer Cyclical • Internet Retail
Reason: Symmetrical Triangle Pattern Breakout
A symmetrical triangle is a chart pattern formed by two converging trend lines connecting a series of sequential peaks and troughs. These two lines result in the formation of a triangle that appears to be symmetrical.
A symmetrical triangle pattern is usually formed when there is indecision in the price movements and there is uncertainty among the buyers and sellers. This chart pattern represents a period of consolidation before the price breaks out or breaks down. In case a breakout occurs from the upper trend line, it is a strong bullish indication as it signifies the start of a new bullish trend.
Buy Level(s): The stock has currently broken out of a symmetrical triangle pattern. However, the ideal buy level for BABA is if the stock closes above the immediate resistance level of $155.90. This is marked in the chart below as a green color dotted line.
Daily chart – BABA
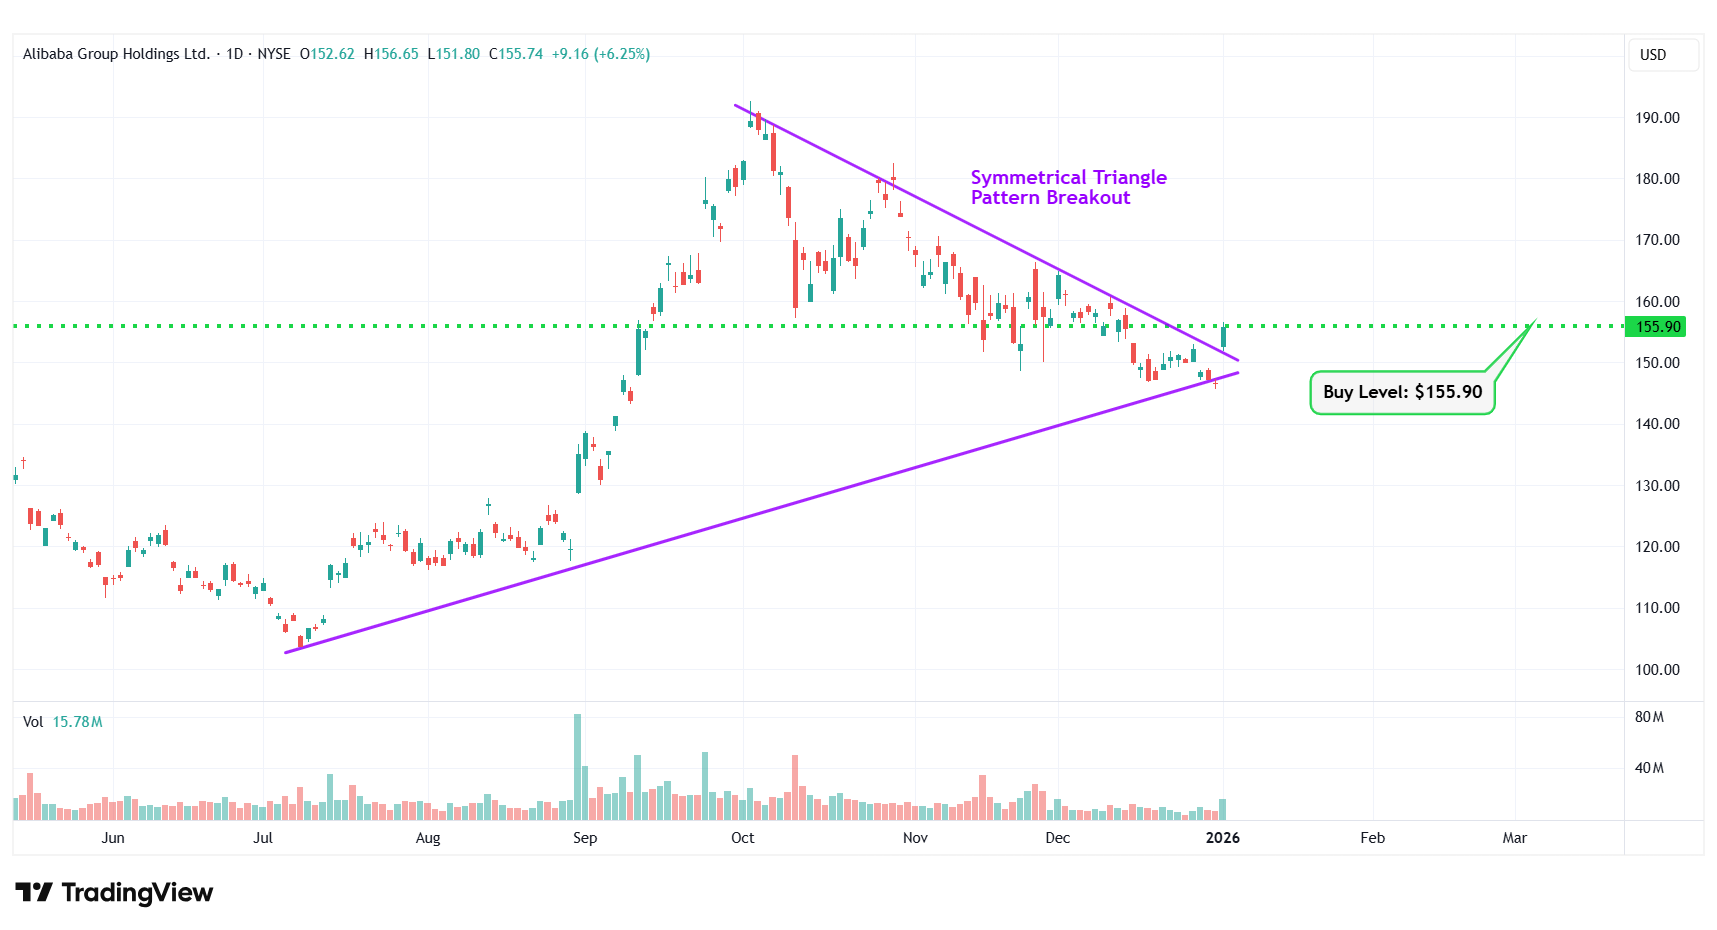
BABA – Symmetrical Triangle Pattern Breakout
#8 Taiwan Semiconductor Manufacturing ADR (NYSE: TSM)
Sector: Technology • Semiconductors
Reason: Breakout From a Consolidation Area in the Daily Chart
A Consolidation Area is a price action contained between two parallel lines. It is formed by a lower line that connects the lows, and an upper line that joins the highs. A stock usually trades between the two lines of the consolidation area before finally breaking out from the upper rail.
Buy Level(s): Although the stock has currently broken out of a consolidation area, the ideal buy level for TSM is above the near-term resistance area, which translates to a price of around $321.40. This is marked in the chart below as a green color dotted line.
Daily chart – TSM
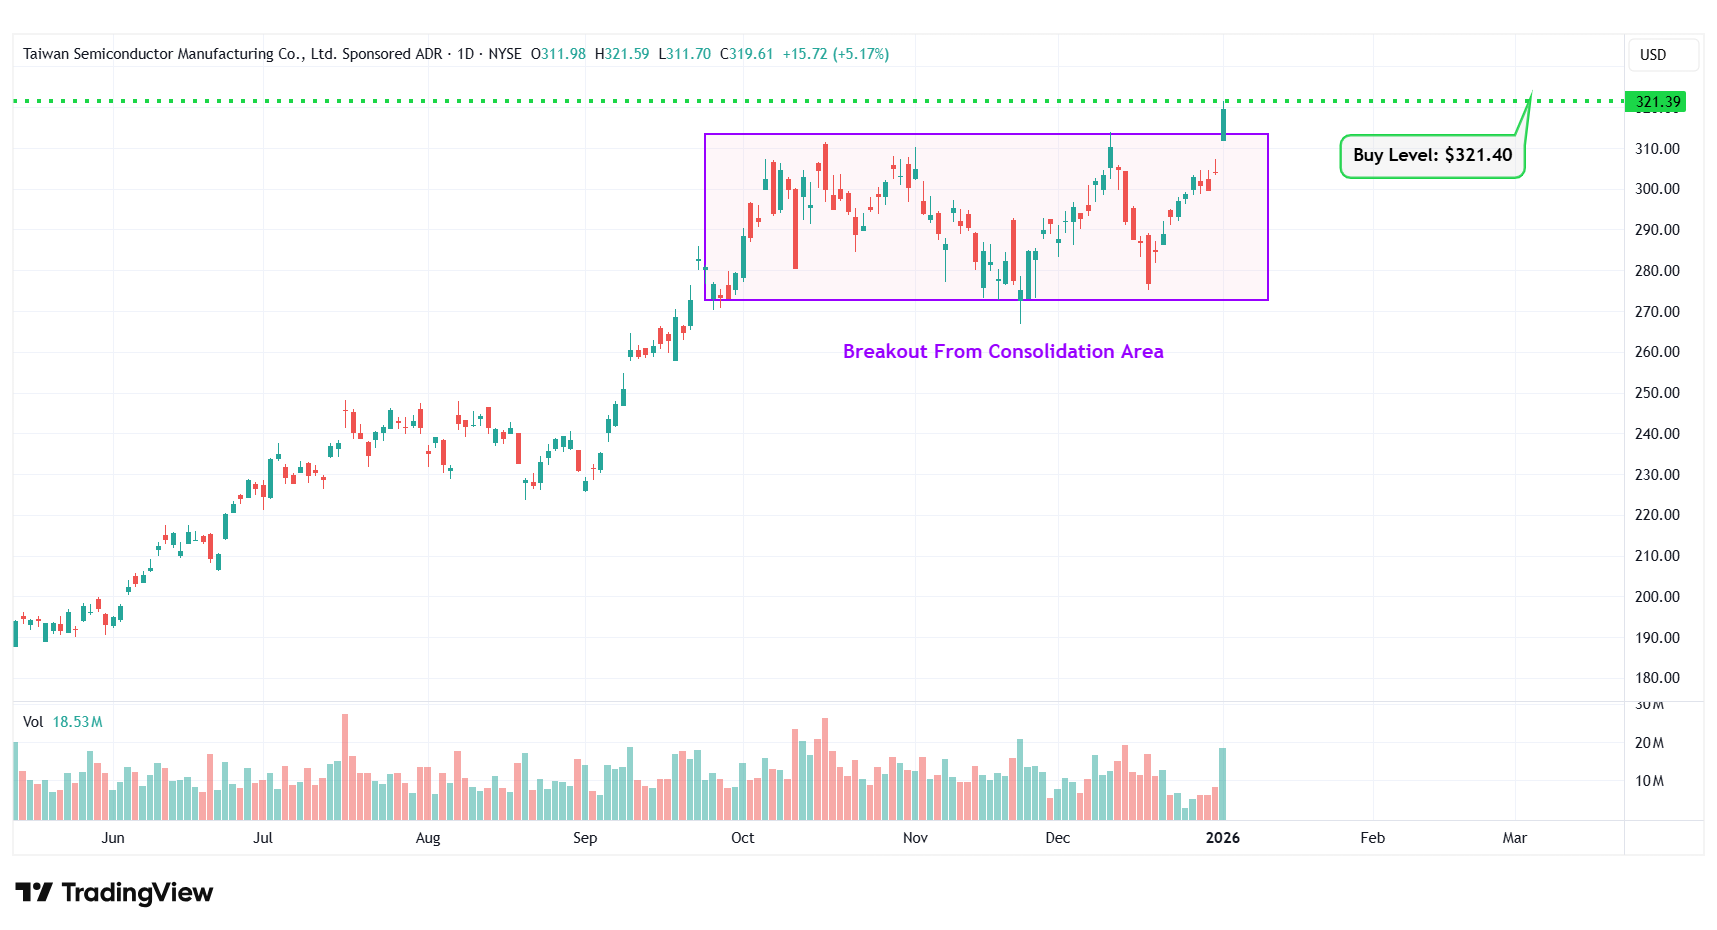
TSM – Breakout From Consolidation Area
#9 Redwire Corporation (NYSE: RDW)
Sector: Industrials • Aerospace & Defense
Reason: Falling Wedge Pattern Breakout
A falling wedge pattern is formed by joining two downward-sloping, converging trendlines having a contracting range. The pattern appears to be wide at the top and continues to contract as prices fall. A breakout from a falling wedge pattern can indicate either reversal or continuation depending on where the pattern appeared in the trend.
A stock that has broken out of a falling wedge pattern would have gained momentum and would have the potential to move higher.
Buy Level(s): The stock has currently broken out of a falling wedge pattern. However, the ideal buy level for RDW is above the nearest resistance level of $9.30. This is marked in the chart below as a green color dotted line.
Daily chart – RDW
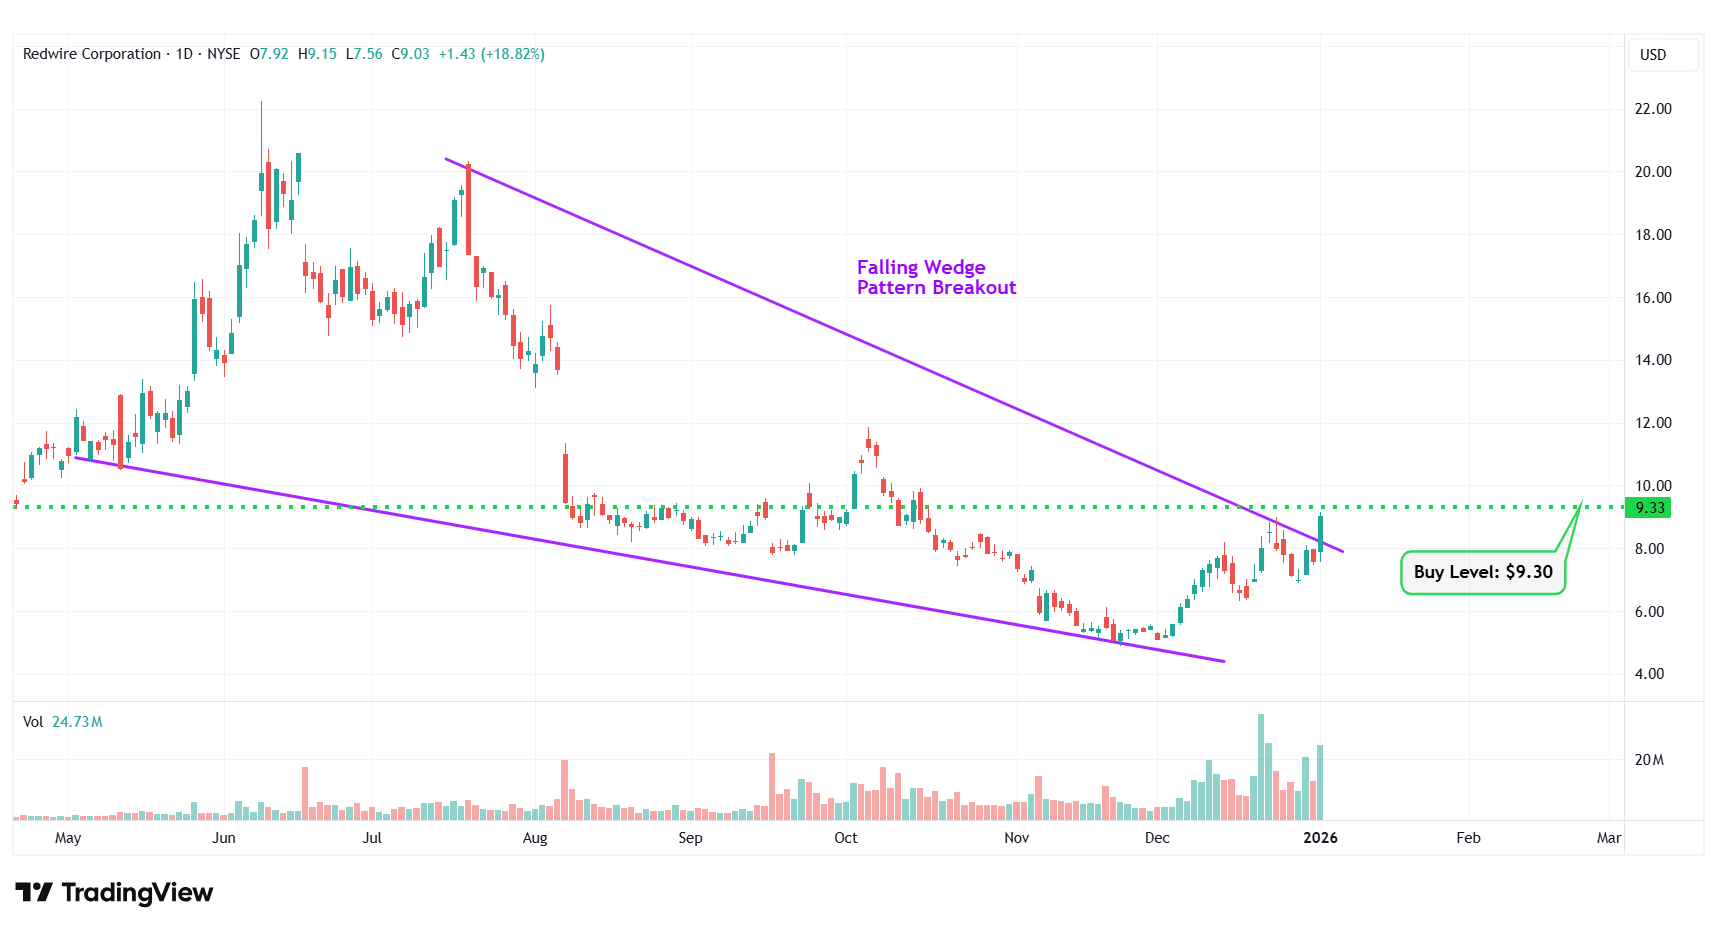
RDW – Falling Wedge Pattern Breakout
#10 UP Fintech Holding Ltd ADR (NASDAQ: TIGR)
Sector: Financial • Capital Markets
Reason: Symmetrical Triangle Pattern Breakout
A symmetrical triangle is a chart pattern formed by two converging trend lines connecting a series of sequential peaks and troughs. These two lines result in the formation of a triangle that appears to be symmetrical.
A symmetrical triangle pattern is usually formed when there is indecision in the price movements and there is uncertainty among the buyers and sellers. This chart pattern represents a period of consolidation before the price breaks out or breaks down. In case a breakout occurs from the upper trend line, it is a strong bullish indication as it signifies the start of a new bullish trend.
Buy Level(s): The stock has currently broken out of a symmetrical triangle pattern. However, the ideal buy level for TIGR is if the stock closes above the immediate resistance level of $10.70. This is marked in the chart below as a green color dotted line.
Daily chart – TIGR
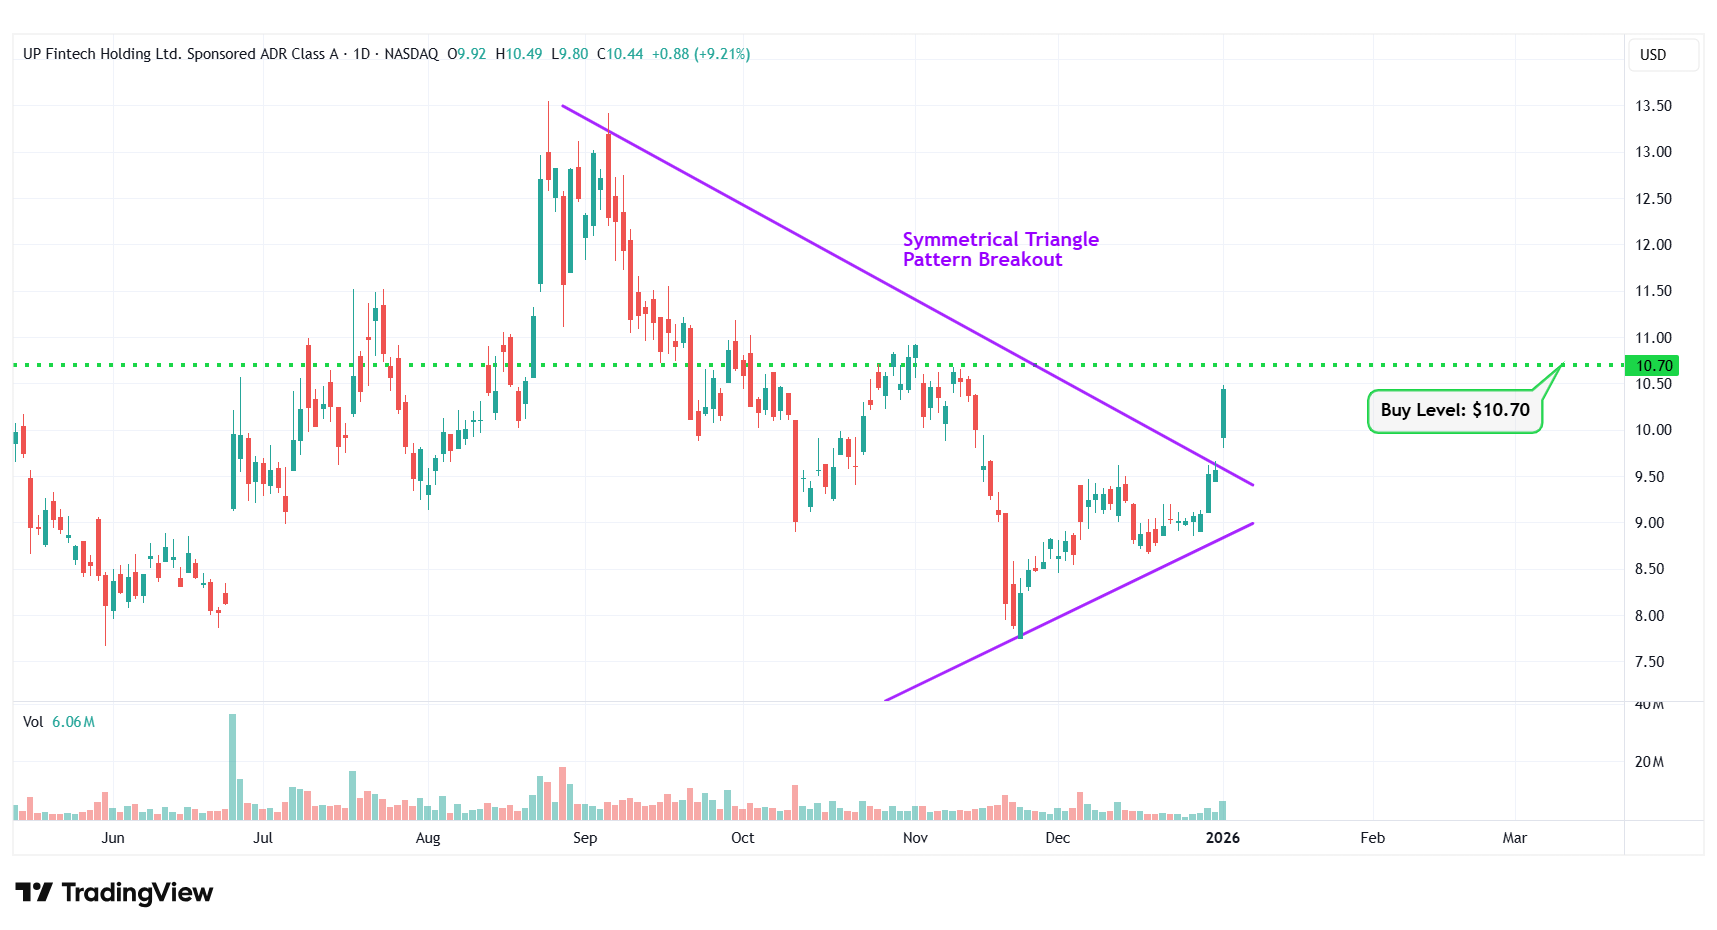
TIGR – Symmetrical Triangle Pattern Breakout
Happy Trading!
Trades of The Day Research Team
To carry out Trump's Executive Order #14196 initiative, the administration will have to partner with a handful of U.S. companies that control the "reserve accounts" sitting on trillions of dollars' worth of untapped natural resources. I've spent months digging into this – and I've identified three companies that have already been granted "emergency status" and fast-track approvals. I believe their shares could skyrocket once new capital starts moving into the sector. See the three stocks that I expect to be the biggest winners as this plan rolls.
Source: Trades of the Day
