Picking a winning trade on a consistent basis is not simply a stroke of luck. It’s the result of calculated screening, planning, and deliberation.
With this in mind, we have started a new weekly series on our top 10 stocks to watch this week — stocks that look poised for a possible breakout in the coming days. Traders should add these stocks to their watchlist now.
The Top 10 Stocks to Watch This Week for Possible Breakouts
| Sl # | Name of the Stock | Stock Ticker | Last Close | Buy Level(s) | Reason |
| 1 | Atlassian Corporation | NASDAQ: TEAM | $169.42 | $171.70 | Falling Wedge Pattern Breakout |
| 2 | Twilio Inc. | NASDAQ: TWLO | $134.88 | $137.60 | Symmetrical Triangle Pattern Breakout |
| 3 | Astera Labs Inc. | NASDAQ: ALAB | $186.68 | $195.00 | Flag Pattern |
| 4 | Corebridge Financial Inc. | NYSE: CRBG | $32.56 | $33.00 | Symmetrical Triangle Pattern |
| 5 | TeraWulf Inc. | NASDAQ: WULF | $15.50 | $16.30 | Uptrend Channel |
| 6 | Bristol-Myers Squibb Co. | NYSE: BMY | $46.07 | $46.50 | Falling Wedge Pattern Breakout |
| 7 | Coinbase Global Inc. | NASDAQ: COIN | $343.78 | $363.80 | Symmetrical Triangle Pattern |
| 8 | Carnival Corp. | NYSE: CCL | $28.83 | $29.50 | Flag Pattern |
| 9 | DXC Technology Co. | NYSE: DXC | $14.20 | $14.90 | Falling Wedge Pattern Breakout |
| 10 | Qualcomm, Inc. | NYSE: QCOM | $180.90 | $182.80 | Uptrend Channel |
Important: Typically, these trades offer a risk: reward ratio of 1:2 or 1:3 in the next 6 months, which implies 2x to 3x rewards when compared to risks. So, be sure to set your stop-loss levels and target prices accordingly to manage your risk. In addition, these trade ideas are triggered using daily closing prices, not intra-day pricing. So, if you participate in these trades, make sure that you only buy the stock once its daily close is above the recommended price level.
That said, here are the top 10 stocks to watch for a breakout, in no particular order.
#1 Atlassian Corporation (NASDAQ: TEAM)
Sector: Technology • Software – Application
Reason: Falling Wedge Pattern Breakout
A falling wedge pattern is formed by joining two downward-sloping, converging trendlines having a contracting range. The pattern appears to be wide at the top and continues to contract as prices fall. A breakout from a falling wedge pattern can indicate either reversal or continuation depending on where the pattern appeared in the trend.
A stock that has broken out of a falling wedge pattern would have gained momentum and would have the potential to move higher.
Buy Level(s): The stock has currently broken out of a falling wedge pattern. However, the ideal buy level for TEAM is above the nearest resistance level of $171.70. This is marked in the chart below as a green color dotted line.
Daily chart – TEAM
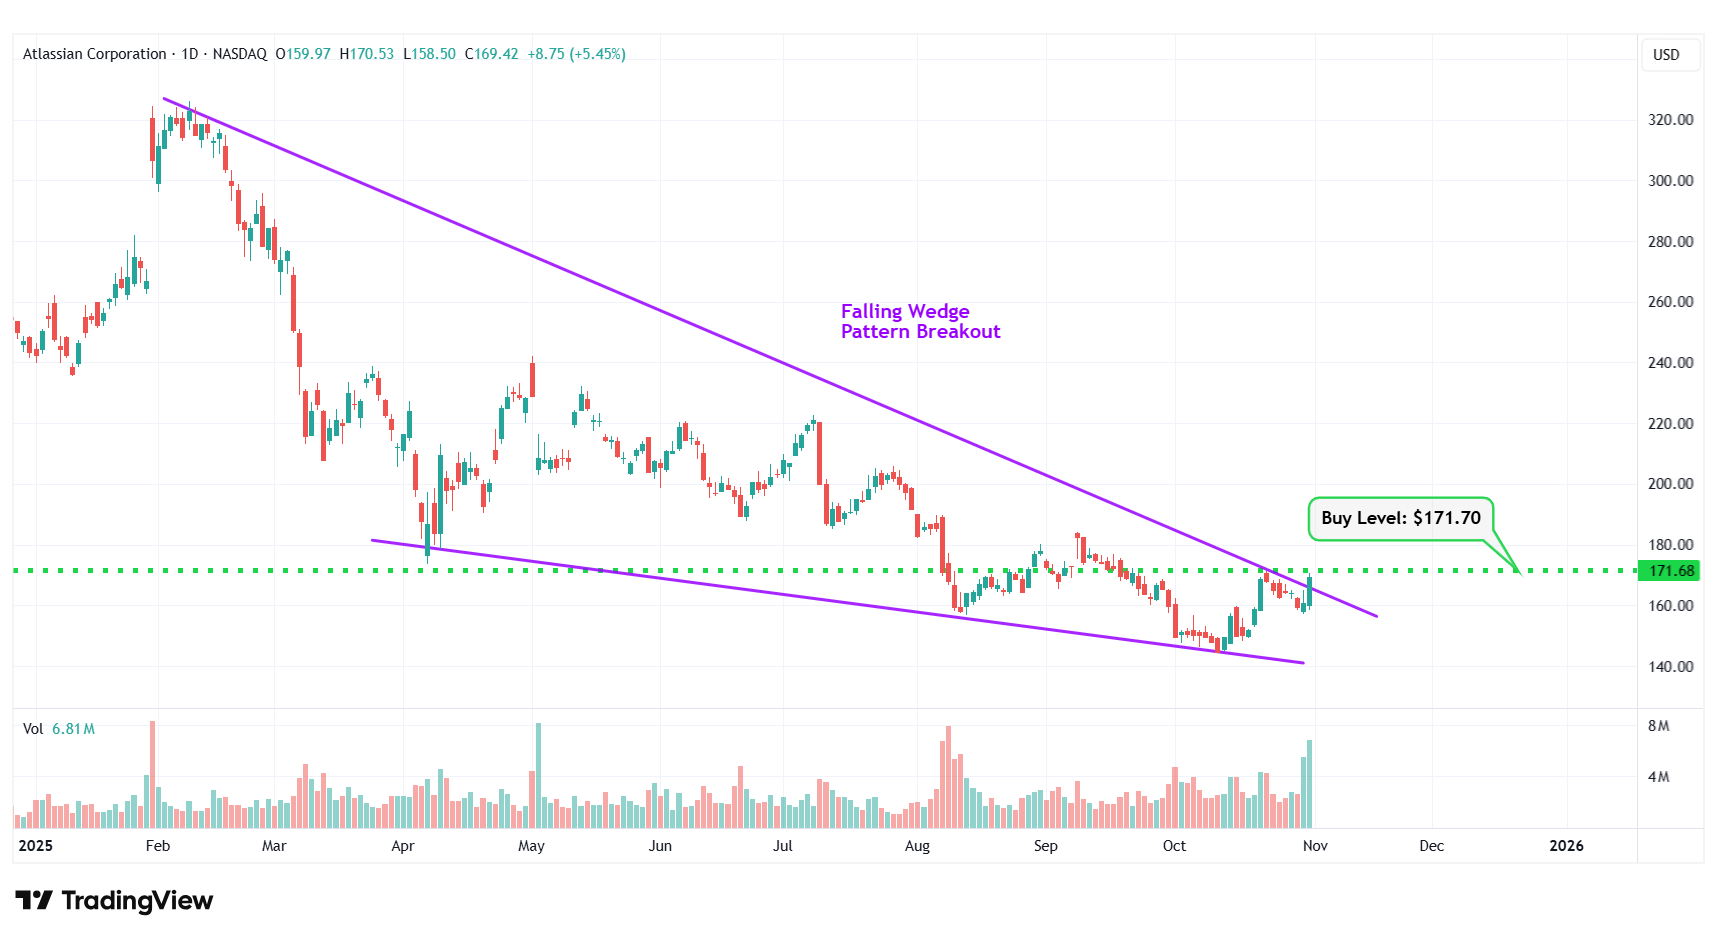
TEAM – Falling Wedge Pattern Breakout
#2 Twilio Inc. (NASDAQ: TWLO)
Sector: Technology • Software – Infrastructure
Reason: Symmetrical Triangle Pattern Breakout
A symmetrical triangle is a chart pattern formed by two converging trend lines connecting a series of sequential peaks and troughs. These two lines result in the formation of a triangle that appears to be symmetrical.
A symmetrical triangle pattern is usually formed when there is indecision in the price movements and there is uncertainty among the buyers and sellers. This chart pattern represents a period of consolidation before the price breaks out or breaks down. In case a breakout occurs from the upper trend line, it is a strong bullish indication as it signifies the start of a new bullish trend.
Buy Level(s): The stock has currently broken out of a symmetrical triangle pattern. However, the ideal buy level for TWLO is if the stock closes above the immediate resistance level of $137.60. This is marked in the chart below as a green color dotted line.
Daily chart – TWLO
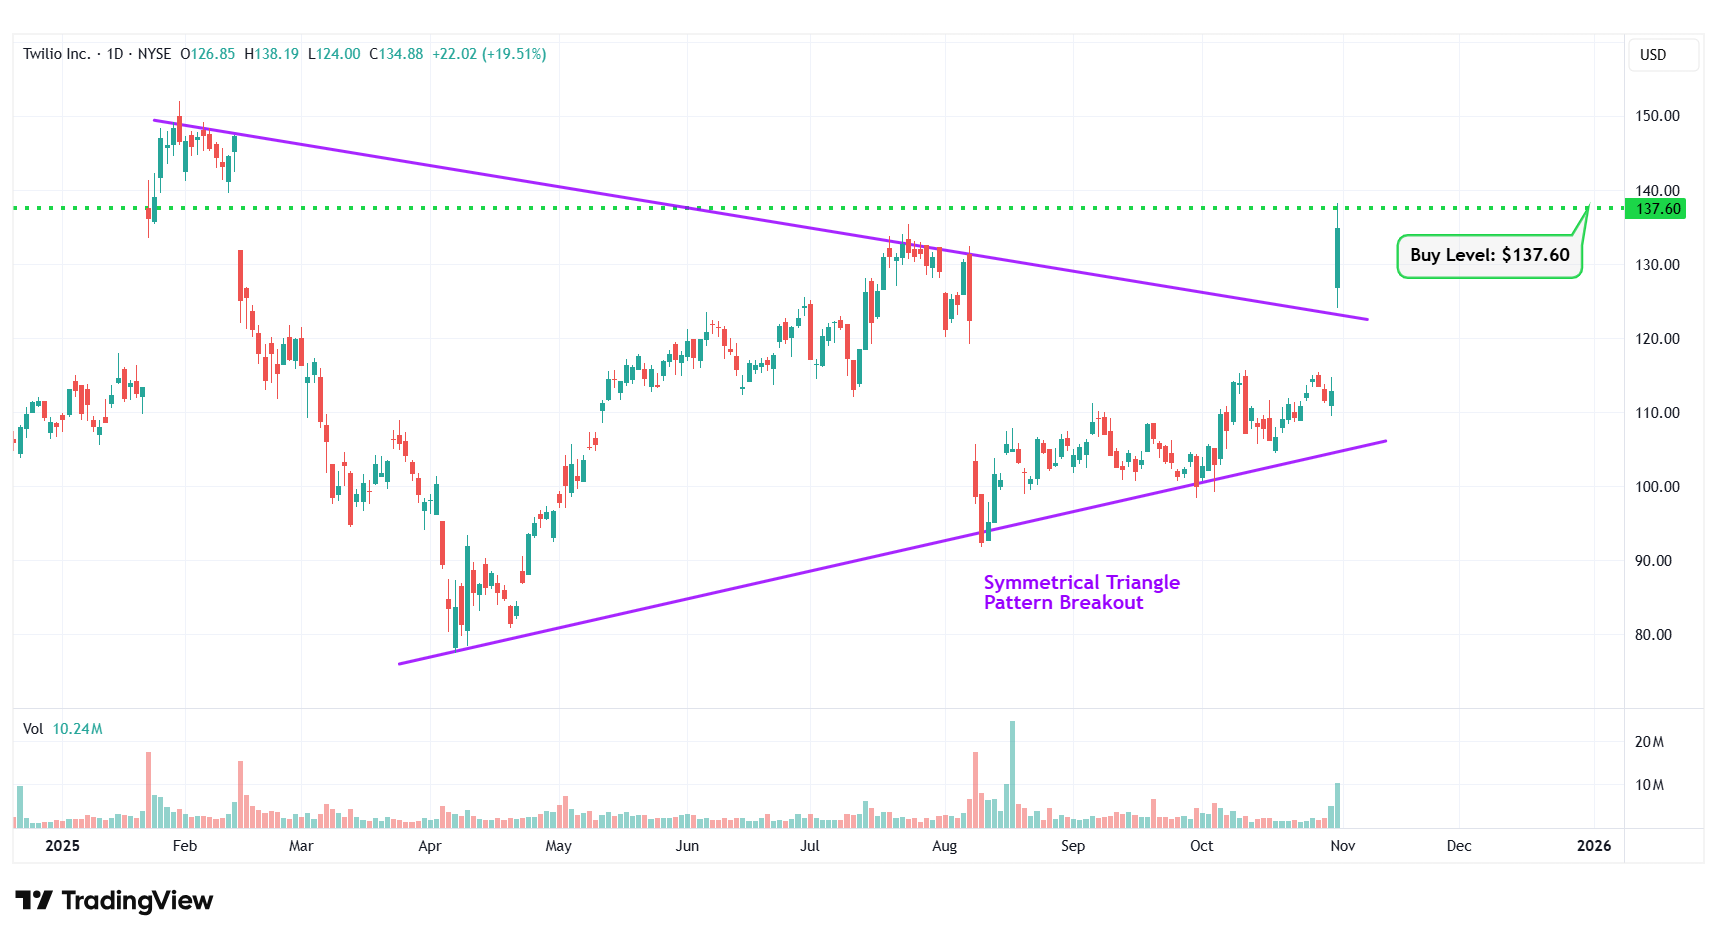
TWLO – Symmetrical Triangle Pattern Breakout
#3 Astera Labs Inc. (NASDAQ: ALAB)
Sector: Technology • Semiconductors
Reason: Formation of a Flag Pattern
A flag pattern is a short-term continuation pattern that marks a small consolidation before the previous move resumes. The pattern is formed when the market consolidates in a narrow range after a sharp move. For a stock in an uptrend, a breakout from this pattern is typically a strong bullish indication.
Buy Level(s): The ideal buy level for ALAB is if the stock breaks out of the flag pattern, at around $195.00. This is marked in the chart below as a green color dotted line.
Daily chart – ALAB
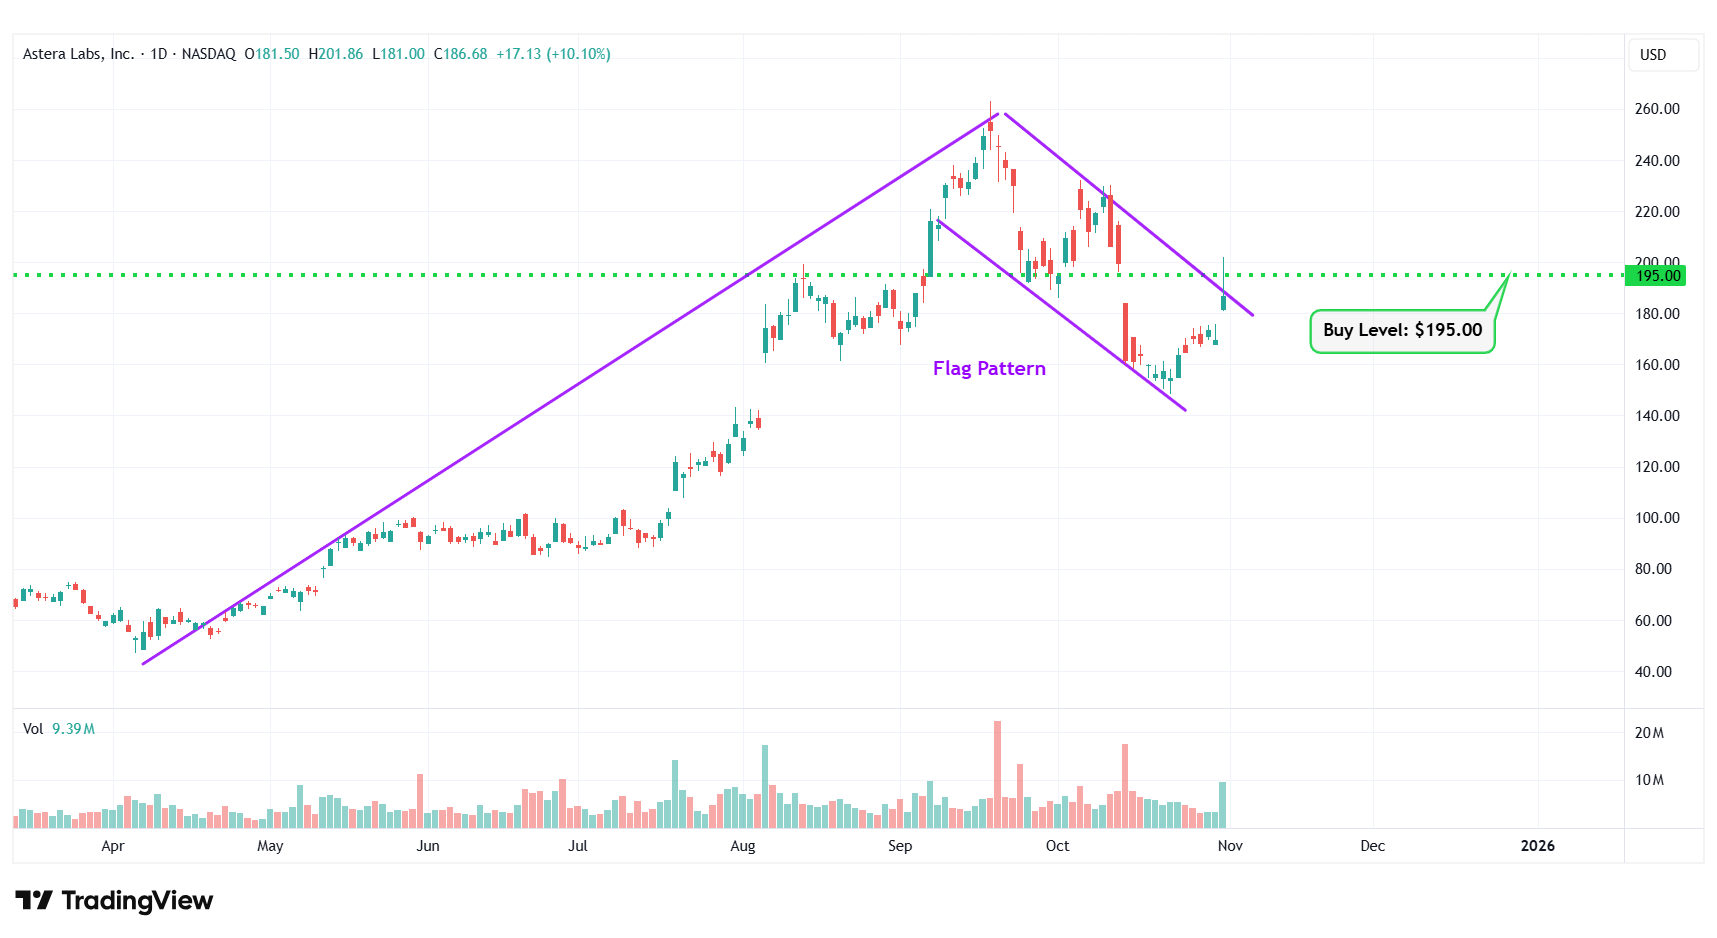
ALAB – Flag Pattern
#4 Corebridge Financial Inc. (NYSE: CRBG)
Sector: Financial • Asset Management
Reason: Formation of a Symmetrical Triangle Pattern
A symmetrical triangle is a chart pattern formed by two converging trend lines connecting a series of sequential peaks and troughs. These two lines result in the formation of a triangle that appears to be symmetrical.
A symmetrical triangle pattern is usually formed when there is indecision in the price movements and there is uncertainty among the buyers and sellers. This chart pattern represents a period of consolidation before the price breaks out or breaks down. In case a breakout occurs from the upper trend line, it is a strong bullish indication as it signifies the start of a new bullish trend.
Buy Level(s): The ideal buy level for CRBG is if the stock has a daily close above the breakout level of the symmetrical triangle pattern, at around $33.00. This is marked in the chart below as a green color dotted line.
Daily chart – CRBG
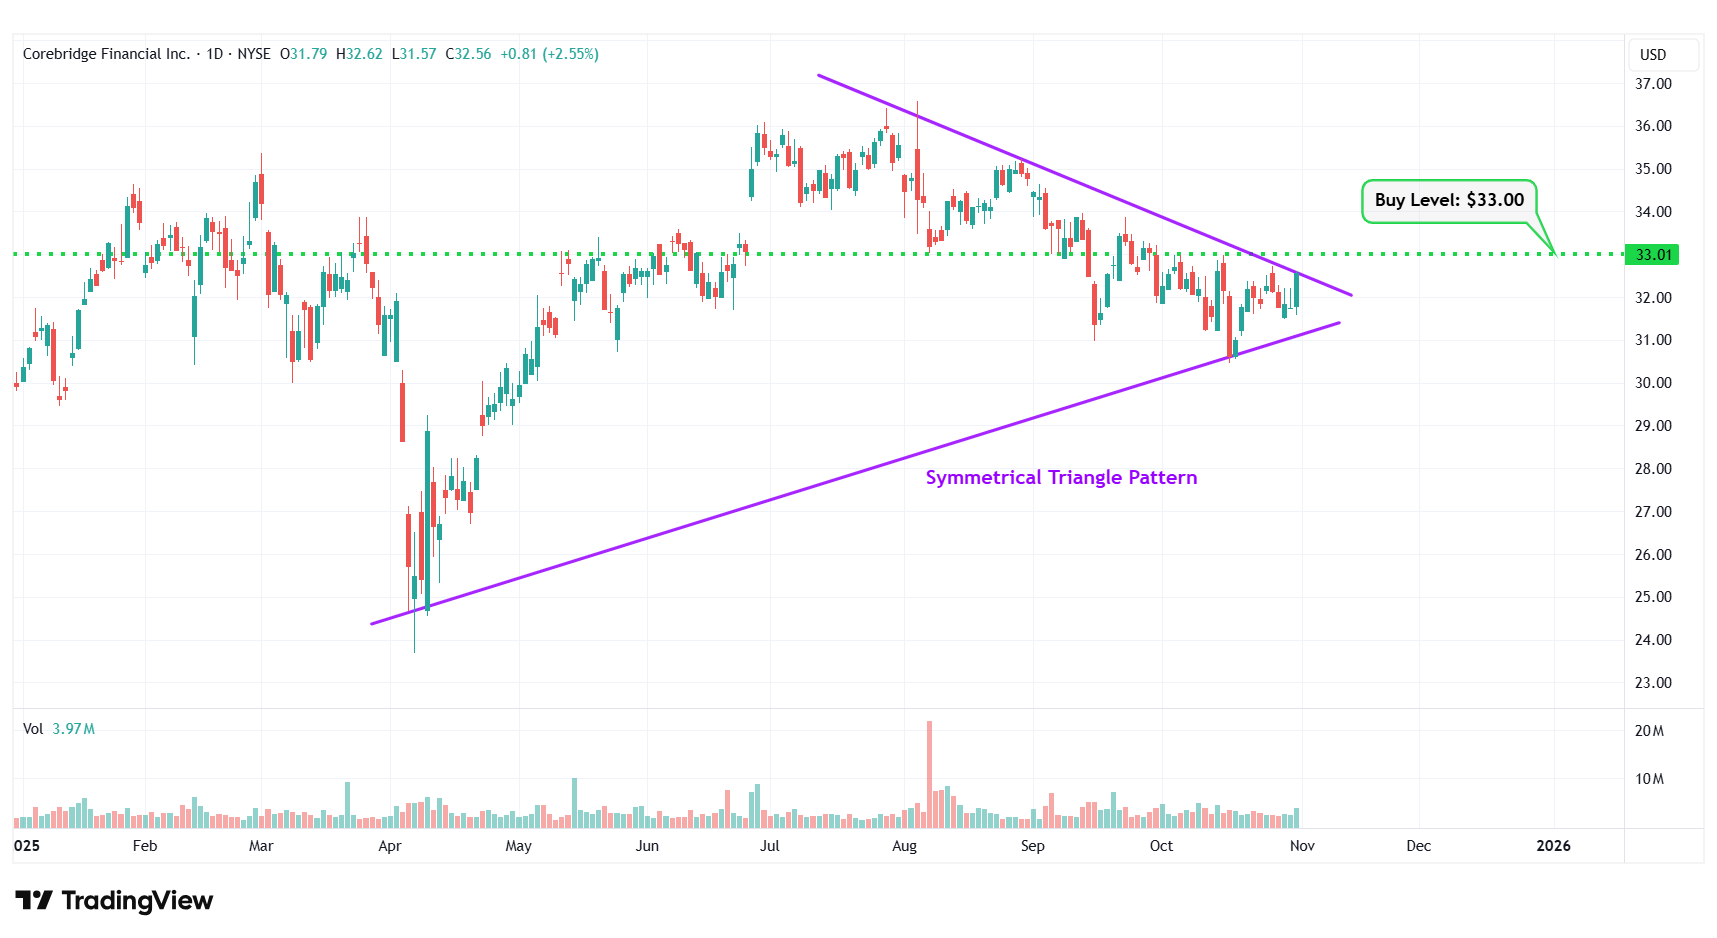
CRBG – Symmetrical Triangle Pattern
#5 TeraWulf Inc. (NASDAQ: WULF)
Sector: Financial • Capital Markets
Reason: Formation of an Uptrend Channel
An uptrend channel or an ascending channel is the price action contained between upward sloping parallel lines. It is formed by a lower trend line that connects the swing lows, and an upper channel line that joins the swing highs. A stock usually trades between the two rails of the uptrend channel before finally breaking out from the upper rail.
Buy Level(s): The ideal buy level for WULF is if the stock breaks out of the uptrend channel and has a daily close above $16.30. This is marked in the chart below as a green color dotted line.
Daily chart – WULF
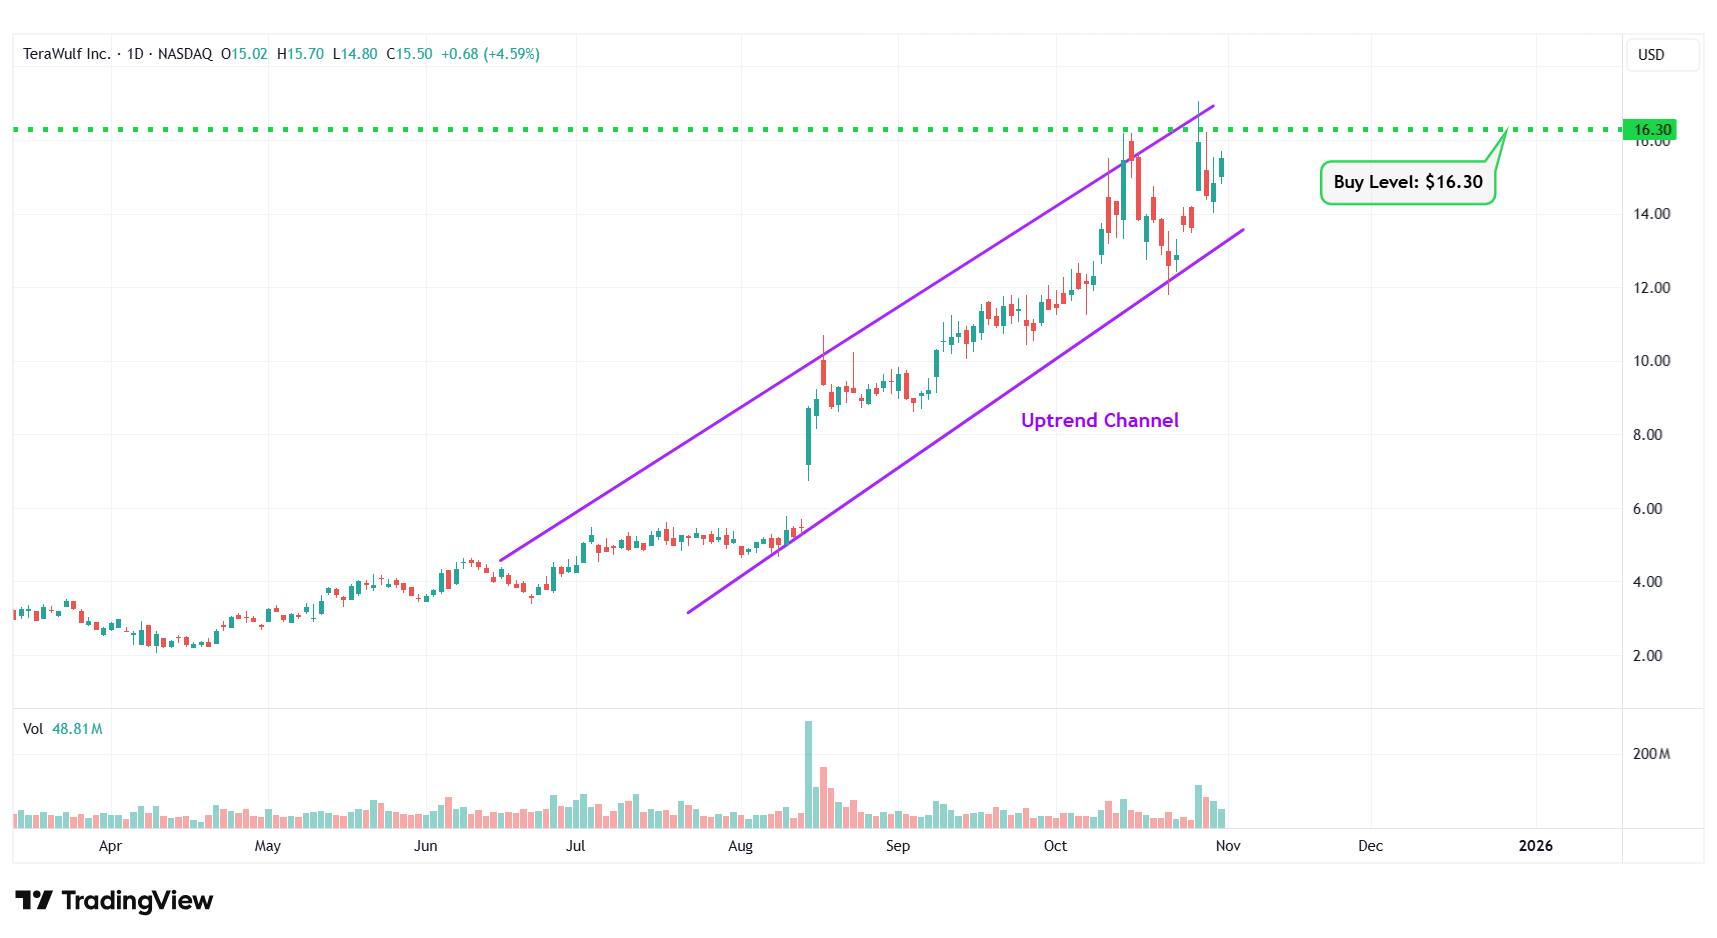
WULF – Uptrend Channel
#6 Bristol-Myers Squibb Co. (NYSE: BMY)
Sector: Healthcare • Drug Manufacturers – General
Reason: Falling Wedge Pattern Breakout
A falling wedge pattern is formed by joining two downward-sloping, converging trendlines having a contracting range. The pattern appears to be wide at the top and continues to contract as prices fall. A breakout from a falling wedge pattern can indicate either reversal or continuation depending on where the pattern appeared in the trend.
A stock that has broken out of a falling wedge pattern would have gained momentum and would have the potential to move higher.
Buy Level(s): The stock has currently broken out of a falling wedge pattern. However, the ideal buy level for BMY is above the nearest resistance level of $46.50. This is marked in the chart below as a green color dotted line.
Daily chart – BMY
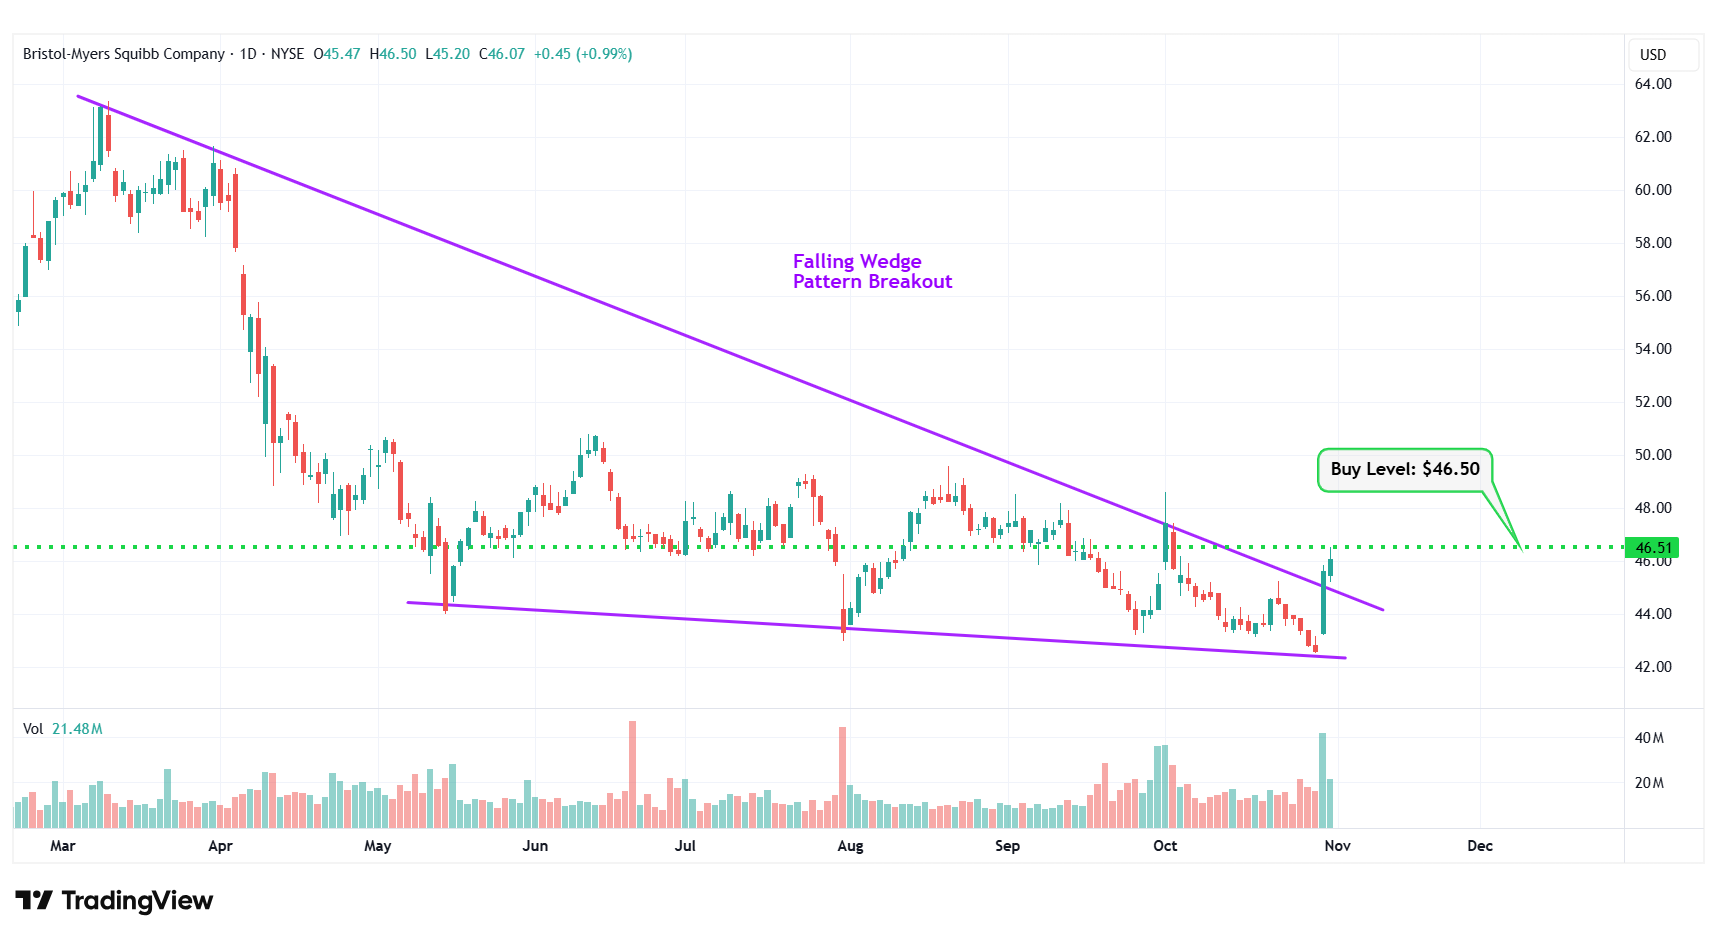
BMY – Falling Wedge Pattern Breakout
#7 Coinbase Global Inc. (NASDAQ: COIN)
Sector: Financial • Financial Data & Stock Exchanges
Reason: Formation of a Symmetrical Triangle Pattern
A symmetrical triangle is a chart pattern formed by two converging trend lines connecting a series of sequential peaks and troughs. These two lines result in the formation of a triangle that appears to be symmetrical.
A symmetrical triangle pattern is usually formed when there is indecision in the price movements and there is uncertainty among the buyers and sellers. This chart pattern represents a period of consolidation before the price breaks out or breaks down. In case a breakout occurs from the upper trend line, it is a strong bullish indication as it signifies the start of a new bullish trend.
Buy Level(s): The ideal buy level for COIN is if the stock has a daily close above the breakout level of the symmetrical triangle pattern, at around $363.80. This is marked in the chart below as a green color dotted line.
Daily chart – COIN
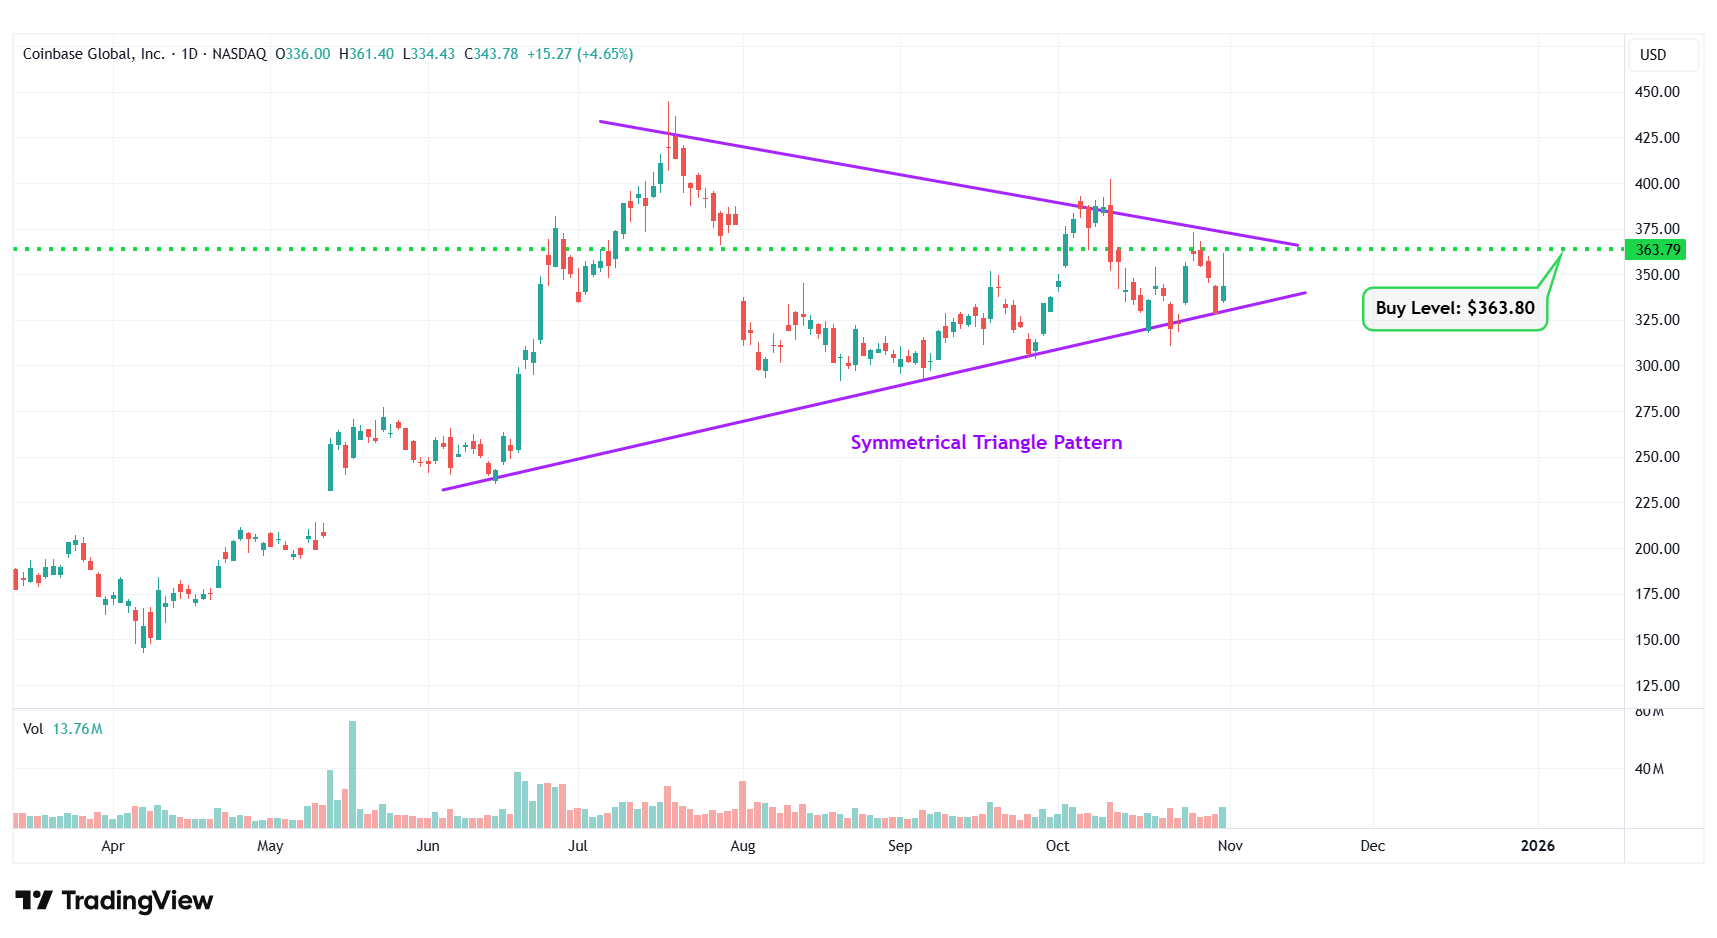
COIN – Symmetrical Triangle Pattern
#8 Carnival Corp. (NYSE: CCL)
Sector: Consumer Cyclical • Travel Services
Reason: Formation of a Flag Pattern
A flag pattern is a short-term continuation pattern that marks a small consolidation before the previous move resumes. The pattern is formed when the market consolidates in a narrow range after a sharp move. For a stock in an uptrend, a breakout from this pattern is typically a strong bullish indication.
Buy Level(s): The ideal buy level for CCL is if the stock breaks out of the flag pattern, at around $29.50. This is marked in the chart below as a green color dotted line.
Daily chart – CCL
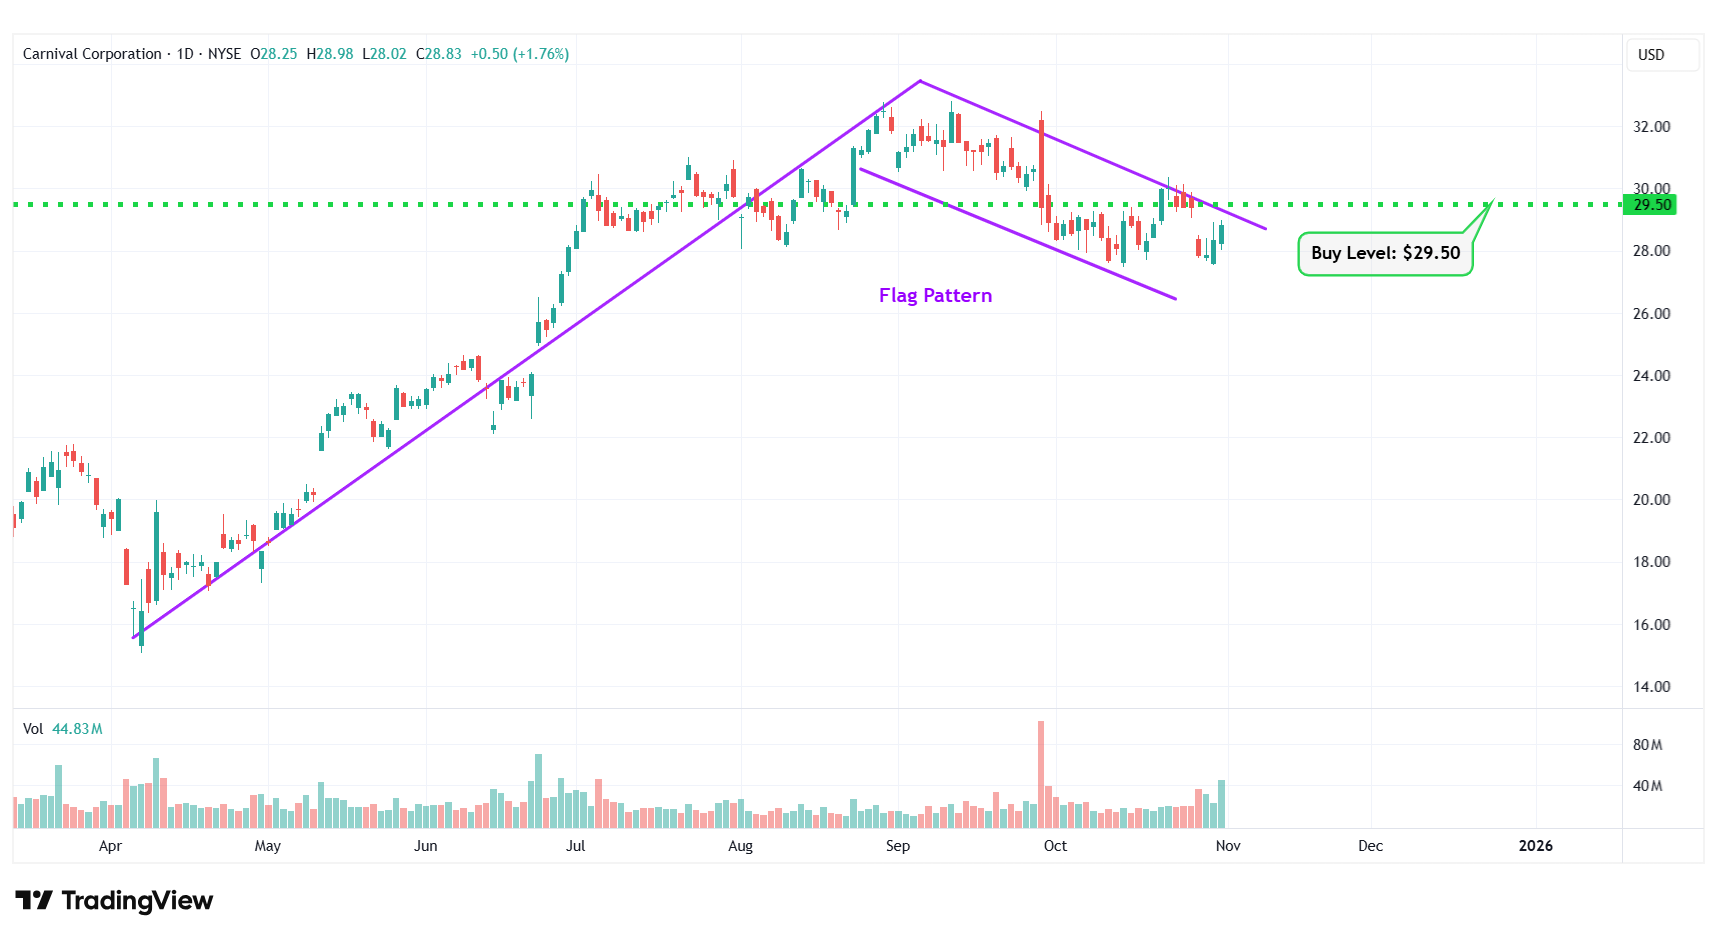
CCL – Flag Pattern
#9 DXC Technology Co. (NYSE: DXC)
Sector: Technology • Information Technology Services
Reason: Falling Wedge Pattern Breakout
A falling wedge pattern is formed by joining two downward-sloping, converging trendlines having a contracting range. The pattern appears to be wide at the top and continues to contract as prices fall. A breakout from a falling wedge pattern can indicate either reversal or continuation depending on where the pattern appeared in the trend.
A stock that has broken out of a falling wedge pattern would have gained momentum and would have the potential to move higher.
Buy Level(s): The stock has currently broken out of a falling wedge pattern. However, the ideal buy level for DXC is above the nearest resistance level of $14.90. This is marked in the chart below as a green color dotted line.
Daily chart – DXC
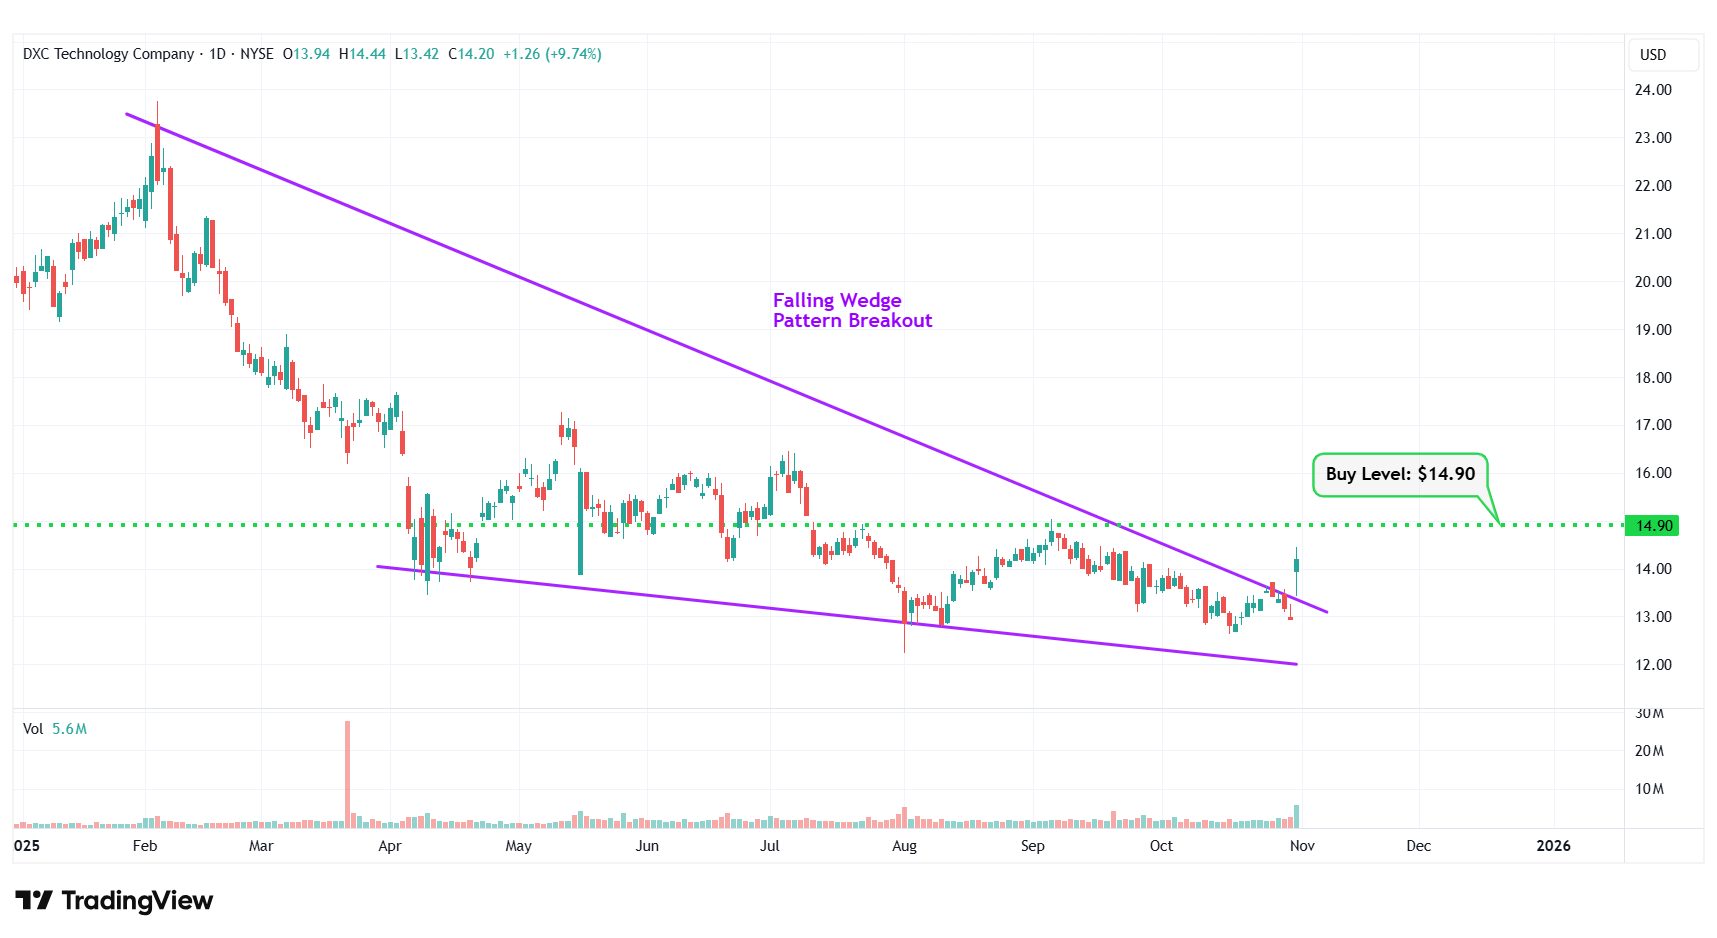
DXC – Falling Wedge Pattern Breakout
#10 Qualcomm, Inc. (NYSE: QCOM)
Sector: Technology • Semiconductors
Reason: Formation of an Uptrend Channel
An uptrend channel or an ascending channel is the price action contained between upward sloping parallel lines. It is formed by a lower trend line that connects the swing lows, and an upper channel line that joins the swing highs. A stock usually trades between the two rails of the uptrend channel before finally breaking out from the upper rail.
Buy Level(s): The ideal buy level for QCOM is if the stock breaks out of the uptrend channel and has a daily close above $182.80. This is marked in the chart below as a green color dotted line.
Daily chart – QCOM
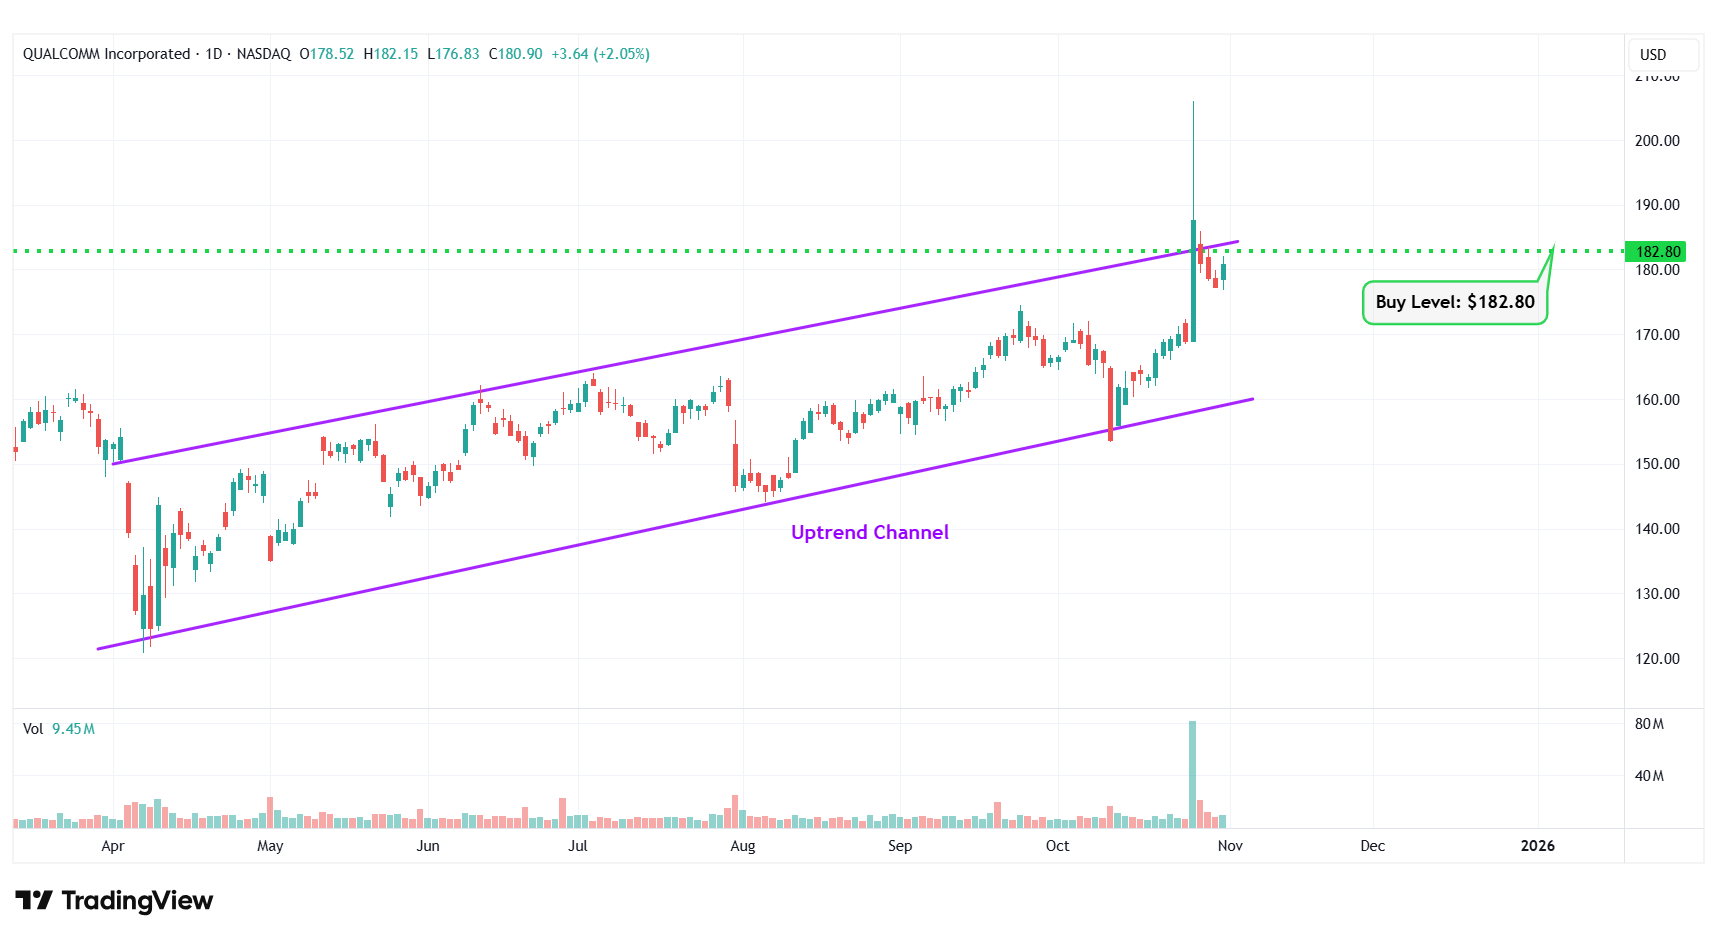
QCOM – Uptrend Channel
Happy Trading!
Trades of The Day Research Team
Legendary fund manager Louis Navellier – a man Forbes calls "the king of quants" – is going "ALL-IN" on this game-changing AI technology. He says, "This is the culmination of everything you've been reading about AI for the last 60 years."Get the details...
Source: Trades of the Day
