Picking a winning trade on a consistent basis is not simply a stroke of luck. It’s the result of calculated screening, planning, and deliberation.
With this in mind, we have started a new weekly series on our top 10 stocks to watch this week — stocks that look poised for a possible breakout in the coming days. Traders should add these stocks to their watchlist now.
The Top 10 Stocks to Watch This Week for Possible Breakouts
| Sl # | Name of the Stock | Stock Ticker | Last Close | Buy Level(s) | Reason |
| 1 | Albertsons Companies Inc. | NYSE: ACI | $19.74 | $19.90 | Falling Wedge Pattern Breakout |
| 2 | Gilead Sciences, Inc. | NASDAQ: GILD | $122.81 | $124.80 | Uptrend Channel |
| 3 | Keurig Dr Pepper Inc. | NASDAQ: KDP | $28.03 | $28.50 | Falling Wedge Pattern Breakout |
| 4 | Praxis Precision Medicines Inc. | NASDAQ: PRAX | $189.99 | $201.00 | Breakout From Consolidation Area |
| 5 | Trump Media & Technology Group Corp | NASDAQ: DJT | $16.18 | $17.20 | Falling Wedge Pattern |
| 6 | Hologic, Inc. | NASDAQ: HOLX | $69.85 | $70.00 | Symmetrical Triangle Pattern Breakout |
| 7 | Ford Motor Co | NYSE: F | $11.92 | $12.50 | Uptrend Channel |
| 8 | Gap, Inc. | NYSE: GAP | $21.60 | $24.30 | Symmetrical Triangle Pattern |
| 9 | Figs Inc. | NYSE: FIGS | $7.86 | $8.15 | Uptrend Channel |
| 10 | Coca-Cola Co | NYSE: KO | $68.44 | $69.10 | Falling Wedge Pattern |
Important: Typically, these trades offer a risk: reward ratio of 1:2 or 1:3 in the next 6 months, which implies 2x to 3x rewards when compared to risks. So, be sure to set your stop-loss levels and target prices accordingly to manage your risk. In addition, these trade ideas are triggered using daily closing prices, not intra-day pricing. So, if you participate in these trades, make sure that you only buy the stock once its daily close is above the recommended price level.
That said, here are the top 10 stocks to watch for a breakout, in no particular order.
#1 Albertsons Companies Inc. (NYSE: ACI)
Sector: Consumer Defensive • Grocery Stores
Reason: Falling Wedge Pattern Breakout
A falling wedge pattern is formed by joining two downward-sloping, converging trendlines having a contracting range. The pattern appears to be wide at the top and continues to contract as prices fall. A breakout from a falling wedge pattern can indicate either reversal or continuation depending on where the pattern appeared in the trend.
A stock that has broken out of a falling wedge pattern would have gained momentum and would have the potential to move higher.
Buy Level(s): The stock has currently broken out of a falling wedge pattern. However, the ideal buy level for ACI is above the nearest resistance level of $19.90. This is marked in the chart below as a green color dotted line.
Daily chart – ACI
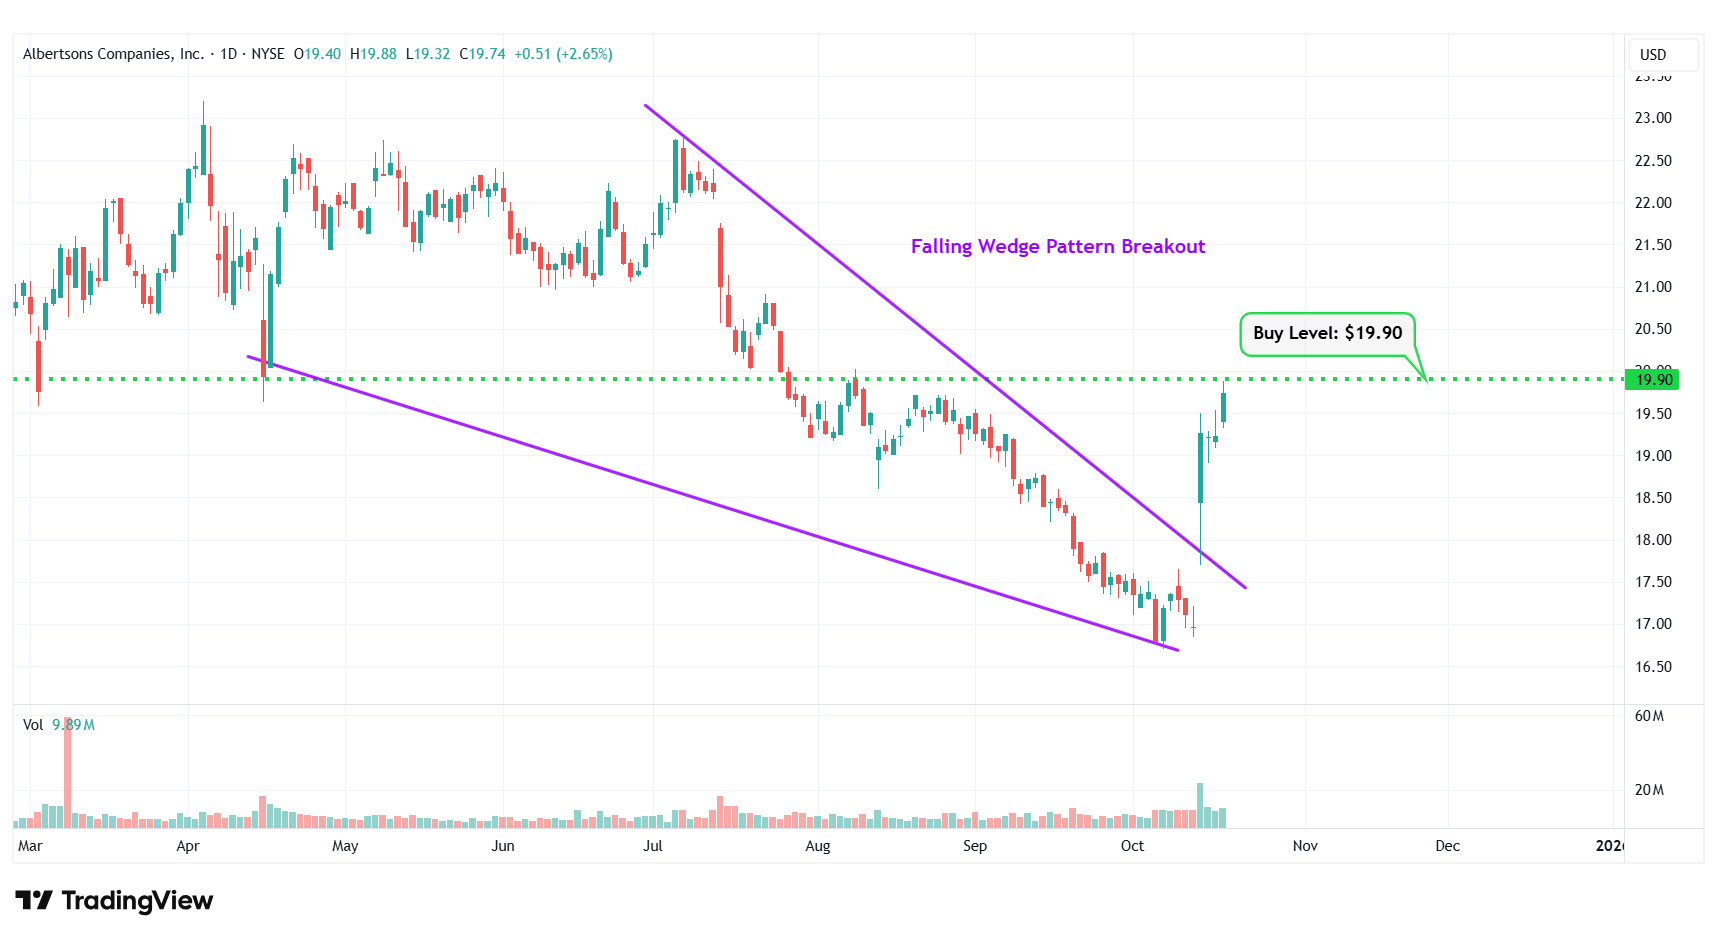
ACI – Falling Wedge Pattern Breakout
#2 Gilead Sciences, Inc. (NASDAQ: GILD)
Sector: Healthcare • Drug Manufacturers – General
Reason: Formation of an Uptrend Channel
An uptrend channel or an ascending channel is the price action contained between upward sloping parallel lines. It is formed by a lower trend line that connects the swing lows, and an upper channel line that joins the swing highs. A stock usually trades between the two rails of the uptrend channel before finally breaking out from the upper rail.
Buy Level(s): The ideal buy level for GILD is if the stock breaks out of the uptrend channel and has a daily close above $124.80. This is marked in the chart below as a green color dotted line.
Daily chart – GILD
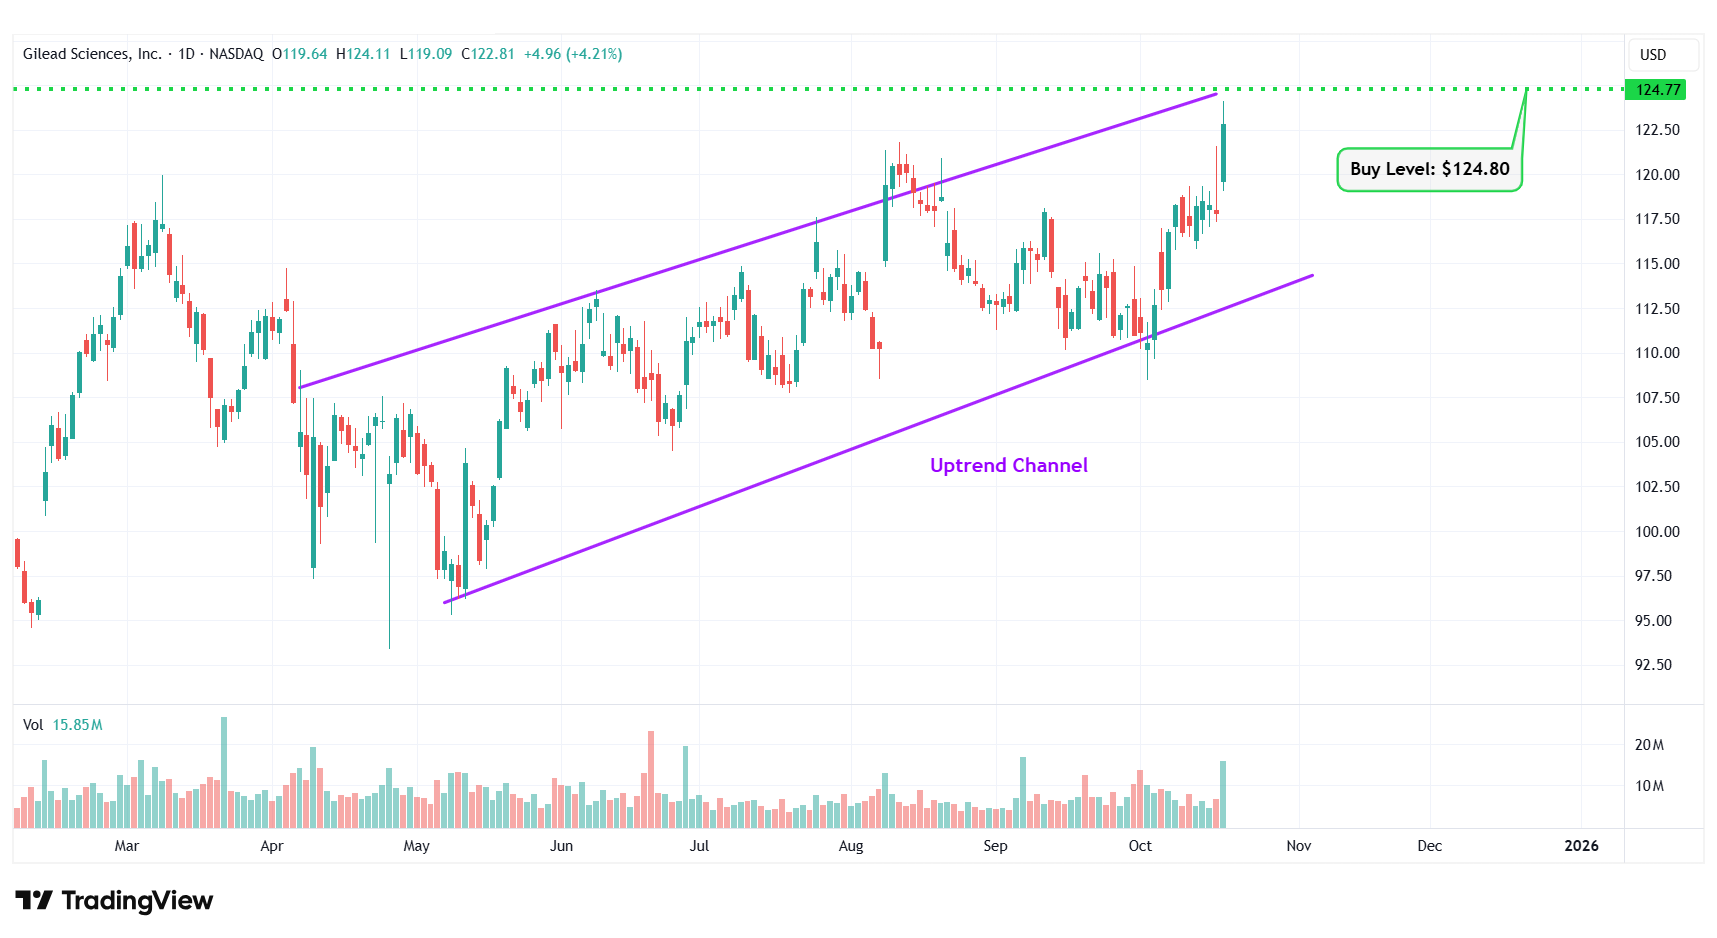
GILD – Uptrend Channel
#3 Keurig Dr Pepper Inc. (NASDAQ: KDP)
Sector: Consumer Defensive • Beverages – Non-Alcoholic
Reason: Falling Wedge Pattern Breakout
A falling wedge pattern is formed by joining two downward-sloping, converging trendlines having a contracting range. The pattern appears to be wide at the top and continues to contract as prices fall. A breakout from a falling wedge pattern can indicate either reversal or continuation depending on where the pattern appeared in the trend.
A stock that has broken out of a falling wedge pattern would have gained momentum and would have the potential to move higher.
Buy Level(s): The stock has currently broken out of a falling wedge pattern. However, the ideal buy level for KDP is above the nearest resistance level of $28.50. This is marked in the chart below as a green color dotted line.
Daily chart – KDP
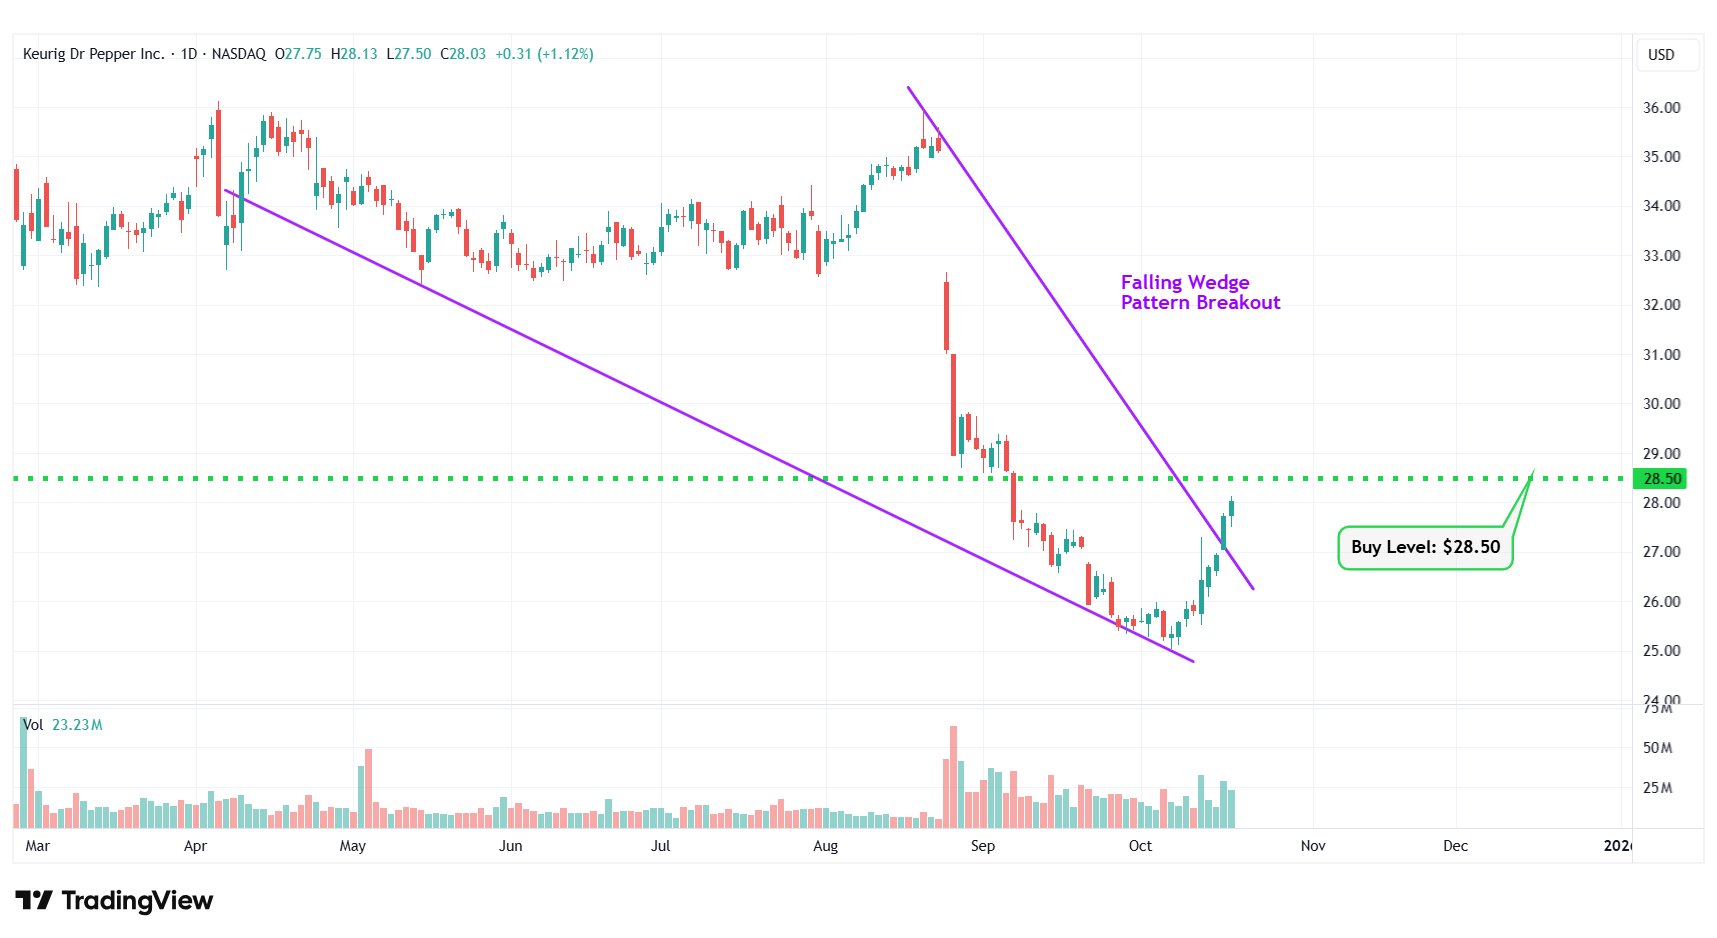
KDP – Falling Wedge Pattern Breakout
#4 Praxis Precision Medicines Inc. (NASDAQ: PRAX)
Sector: Healthcare • Biotechnology
Reason: Breakout From a Consolidation Area in the Daily Chart
A Consolidation Area is a price action contained between two parallel lines. It is formed by a lower line that connects the lows, and an upper line that joins the highs. A stock usually trades between the two lines of the consolidation area before finally breaking out from the upper rail.
Buy Level(s): Although the stock has currently broken out of a consolidation area, the ideal buy level for PRAX is above the near-term resistance area, which translates to a price of around $201.00. This is marked in the chart below as a green color dotted line.
Daily chart – PRAX
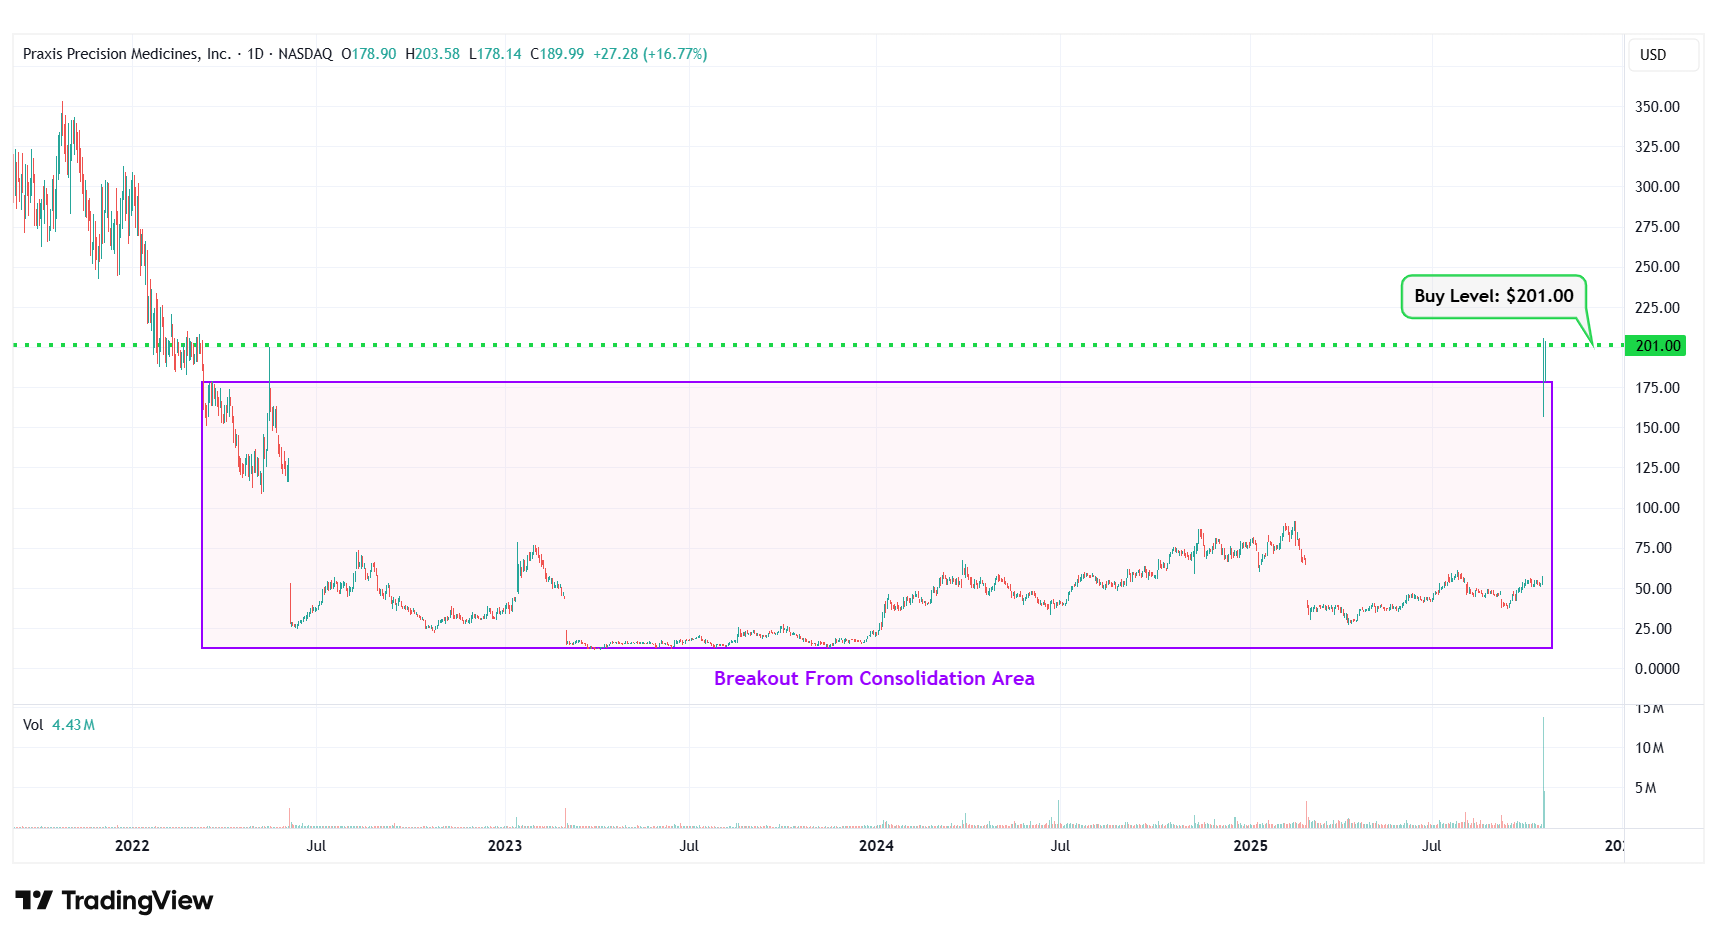
PRAX – Breakout From Consolidation Area
#5 Trump Media & Technology Group Corp (NASDAQ: DJT)
Sector: Communication Services • Internet Content & Information
Reason: Formation of a Falling Wedge Pattern
A falling wedge pattern is formed by joining two downward-sloping, converging trendlines having a contracting range. The pattern appears to be wide at the top and continues to contract as prices fall. A breakout from a falling wedge pattern can indicate either reversal or continuation depending on where the pattern appeared in the trend.
A stock that has broken out of a falling wedge pattern would have gained momentum and would have the potential to move higher.
Buy Level(s): The ideal buy level for DJT is if the stock breaks out of the falling wedge pattern, at a price of around $17.20. This is marked in the chart below as a green color dotted line.
Daily chart – DJT
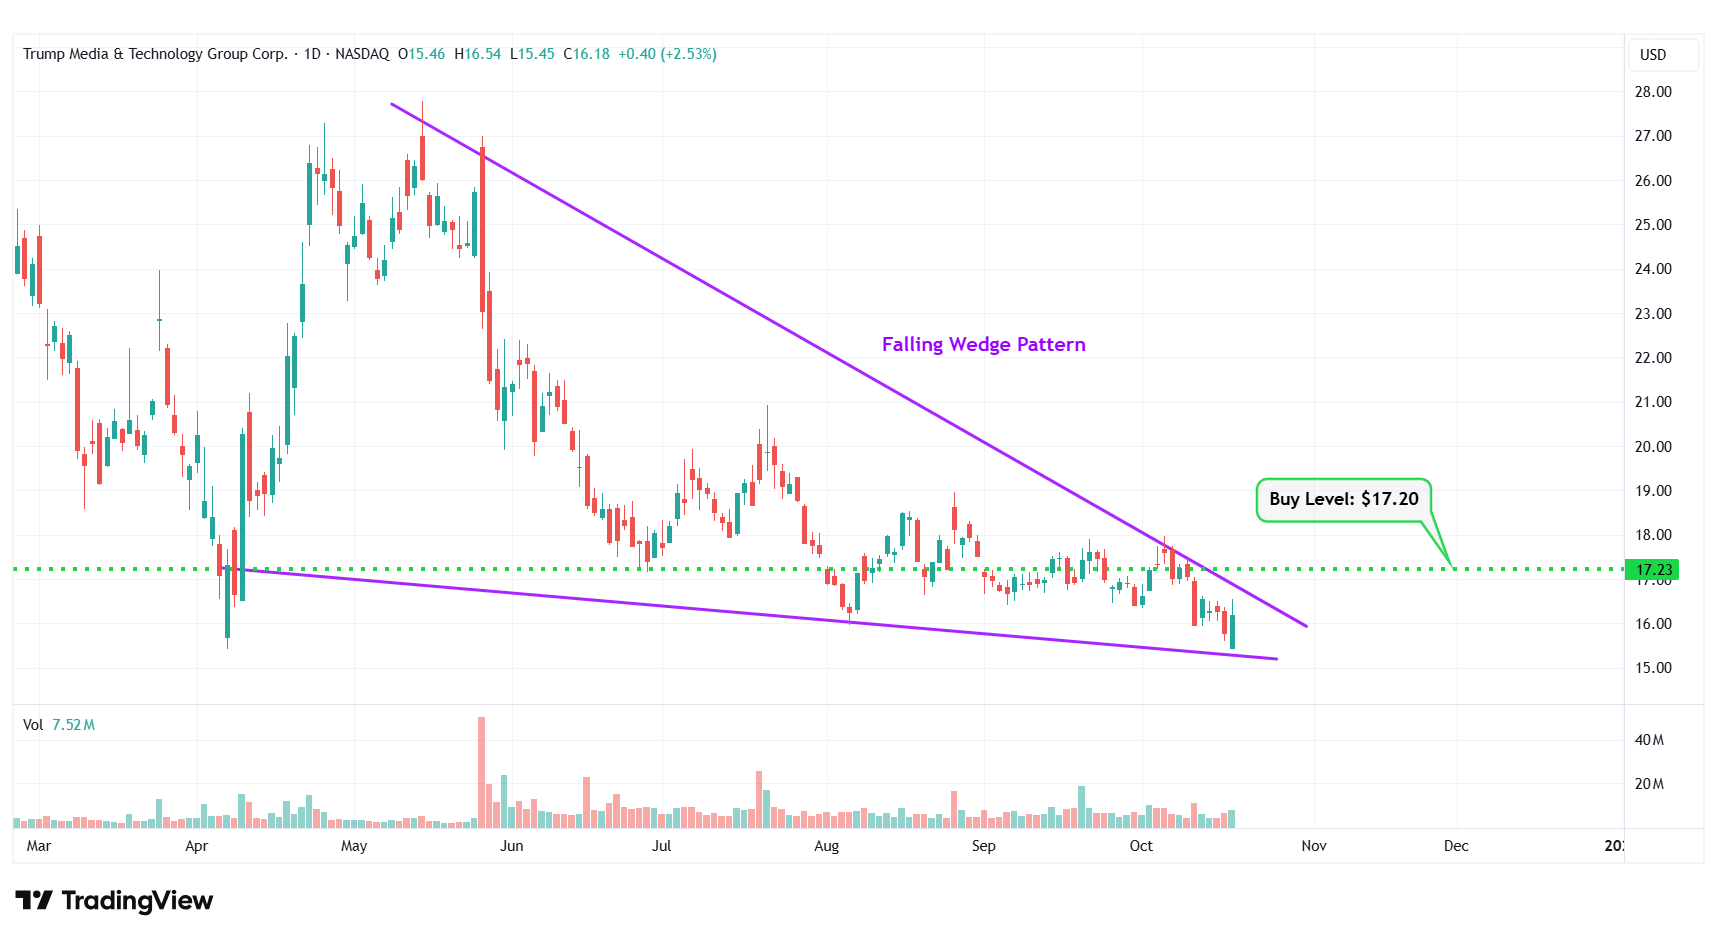
DJT – Falling Wedge Pattern
#6 Hologic, Inc. (NASDAQ: HOLX)
Sector: Healthcare • Medical Instruments & Supplies
Reason: Symmetrical Triangle Pattern Breakout
A symmetrical triangle is a chart pattern formed by two converging trend lines connecting a series of sequential peaks and troughs. These two lines result in the formation of a triangle that appears to be symmetrical.
A symmetrical triangle pattern is usually formed when there is indecision in the price movements and there is uncertainty among the buyers and sellers. This chart pattern represents a period of consolidation before the price breaks out or breaks down. In case a breakout occurs from the upper trend line, it is a strong bullish indication as it signifies the start of a new bullish trend.
Buy Level(s): The stock has currently broken out of a symmetrical triangle pattern. However, the ideal buy level for HOLX is if the stock closes above the immediate resistance level of $70.00. This is marked in the chart below as a green color dotted line.
Daily chart – HOLX
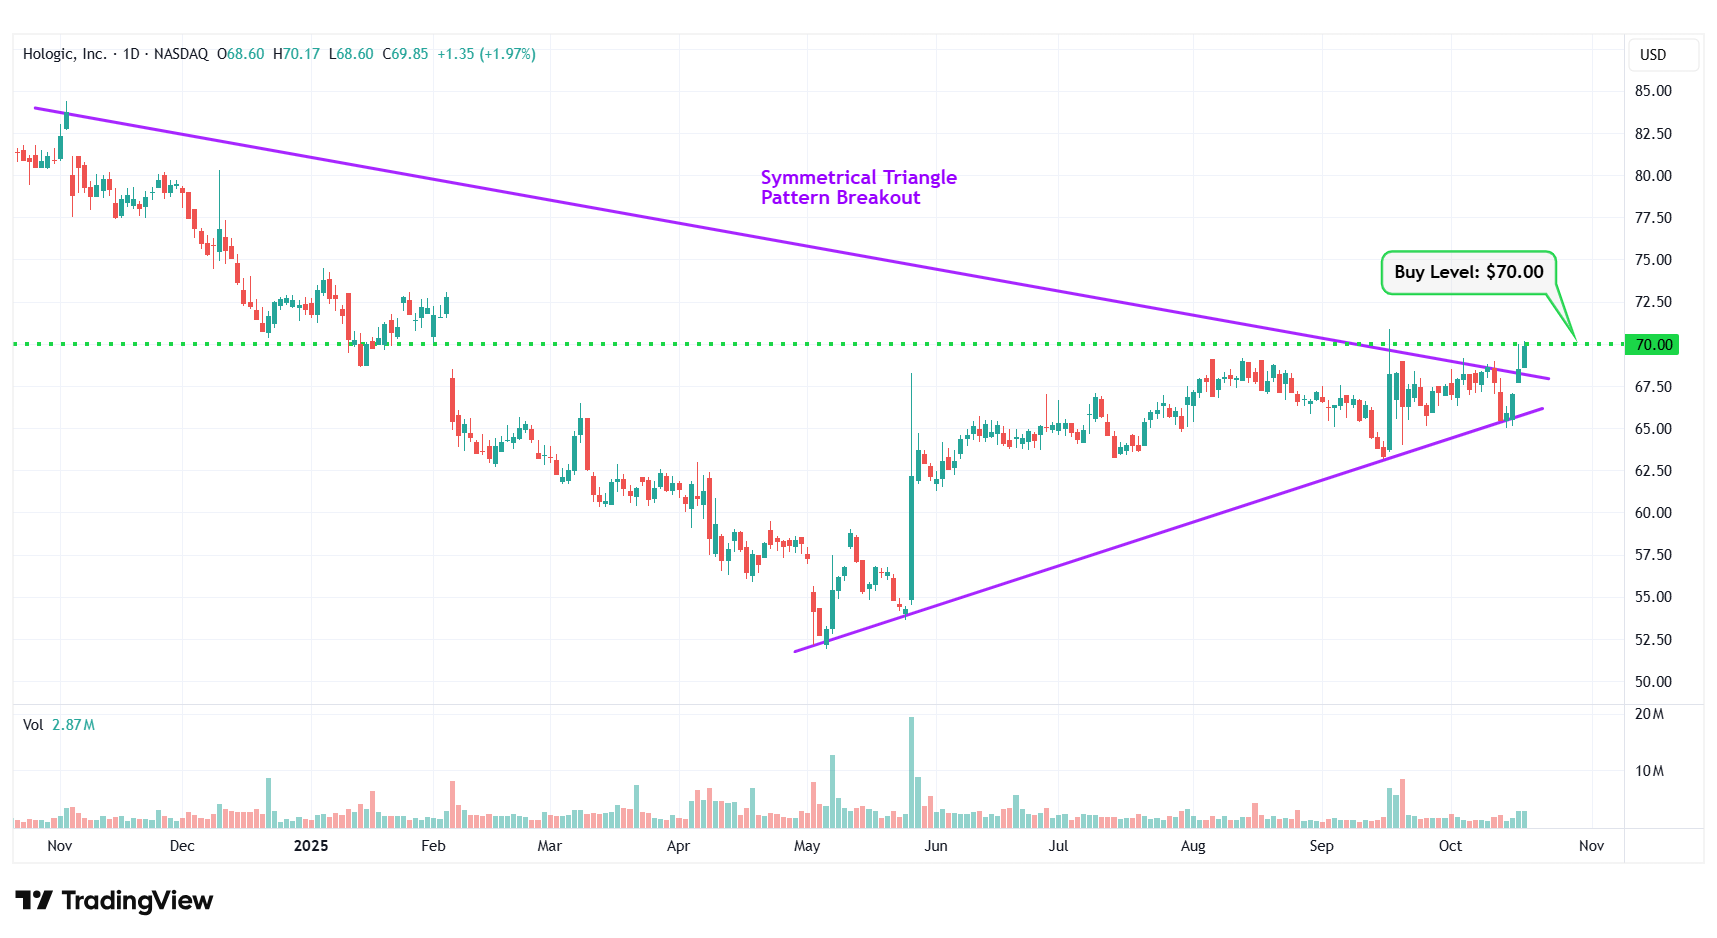
HOLX – Symmetrical Triangle Pattern Breakout
#7 Ford Motor Co (NYSE: F)
Sector: Consumer Cyclical • Auto Manufacturers
Reason: Formation of an Uptrend Channel
An uptrend channel or an ascending channel is the price action contained between upward sloping parallel lines. It is formed by a lower trend line that connects the swing lows, and an upper channel line that joins the swing highs. A stock usually trades between the two rails of the uptrend channel before finally breaking out from the upper rail.
Buy Level(s): The ideal buy level for F is if the stock breaks out of the uptrend channel and has a daily close above $12.50. This is marked in the chart below as a green color dotted line.
Daily chart – F
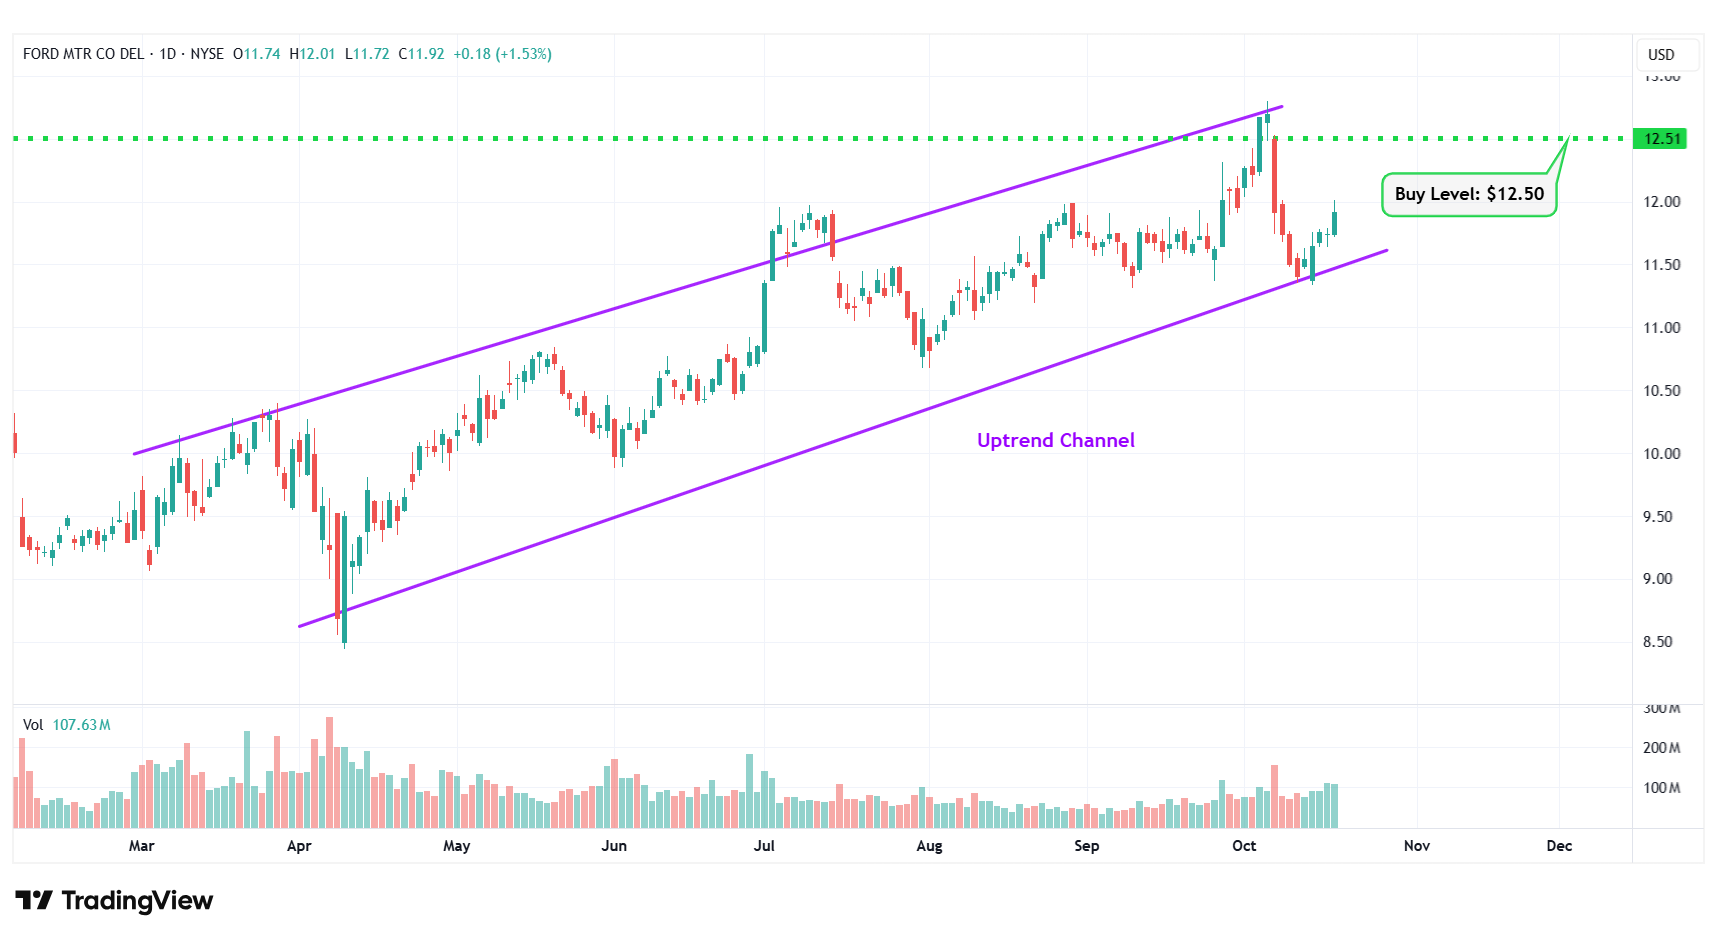
F – Uptrend Channel
#8 Gap, Inc. (NYSE: GAP)
Sector: Consumer Cyclical • Apparel Retail
Reason: Formation of a Symmetrical Triangle Pattern
A symmetrical triangle is a chart pattern formed by two converging trend lines connecting a series of sequential peaks and troughs. These two lines result in the formation of a triangle that appears to be symmetrical.
A symmetrical triangle pattern is usually formed when there is indecision in the price movements and there is uncertainty among the buyers and sellers. This chart pattern represents a period of consolidation before the price breaks out or breaks down. In case a breakout occurs from the upper trend line, it is a strong bullish indication as it signifies the start of a new bullish trend.
Buy Level(s): The ideal buy level for GAP is if the stock has a daily close above the breakout level of the symmetrical triangle pattern, at around $24.30. This is marked in the chart below as a green color dotted line.
Daily chart – GAP
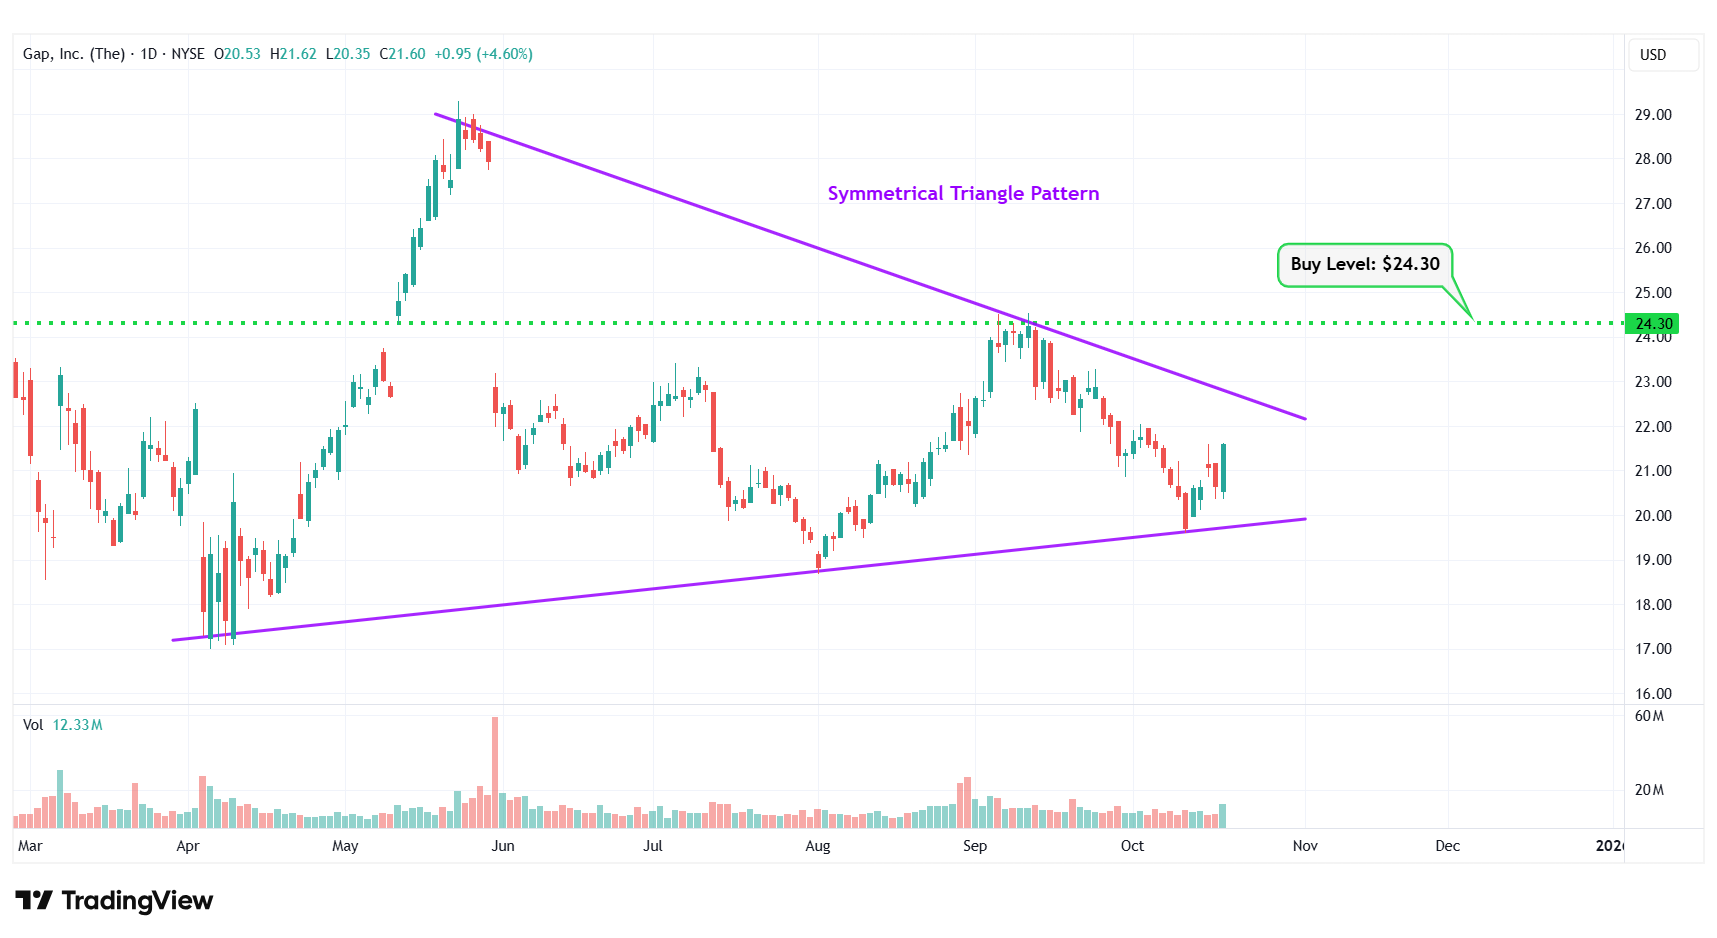
GAP – Symmetrical Triangle Pattern
#9 Figs Inc. (NYSE: FIGS)
Sector: Consumer Cyclical • Apparel Manufacturing
Reason: Formation of an Uptrend Channel
An uptrend channel or an ascending channel is the price action contained between upward sloping parallel lines. It is formed by a lower trend line that connects the swing lows, and an upper channel line that joins the swing highs. A stock usually trades between the two rails of the uptrend channel before finally breaking out from the upper rail.
Buy Level(s): The ideal buy level for FIGS is if the stock breaks out of the uptrend channel and has a daily close above $8.15. This is marked in the chart below as a green color dotted line.
Daily chart – FIGS
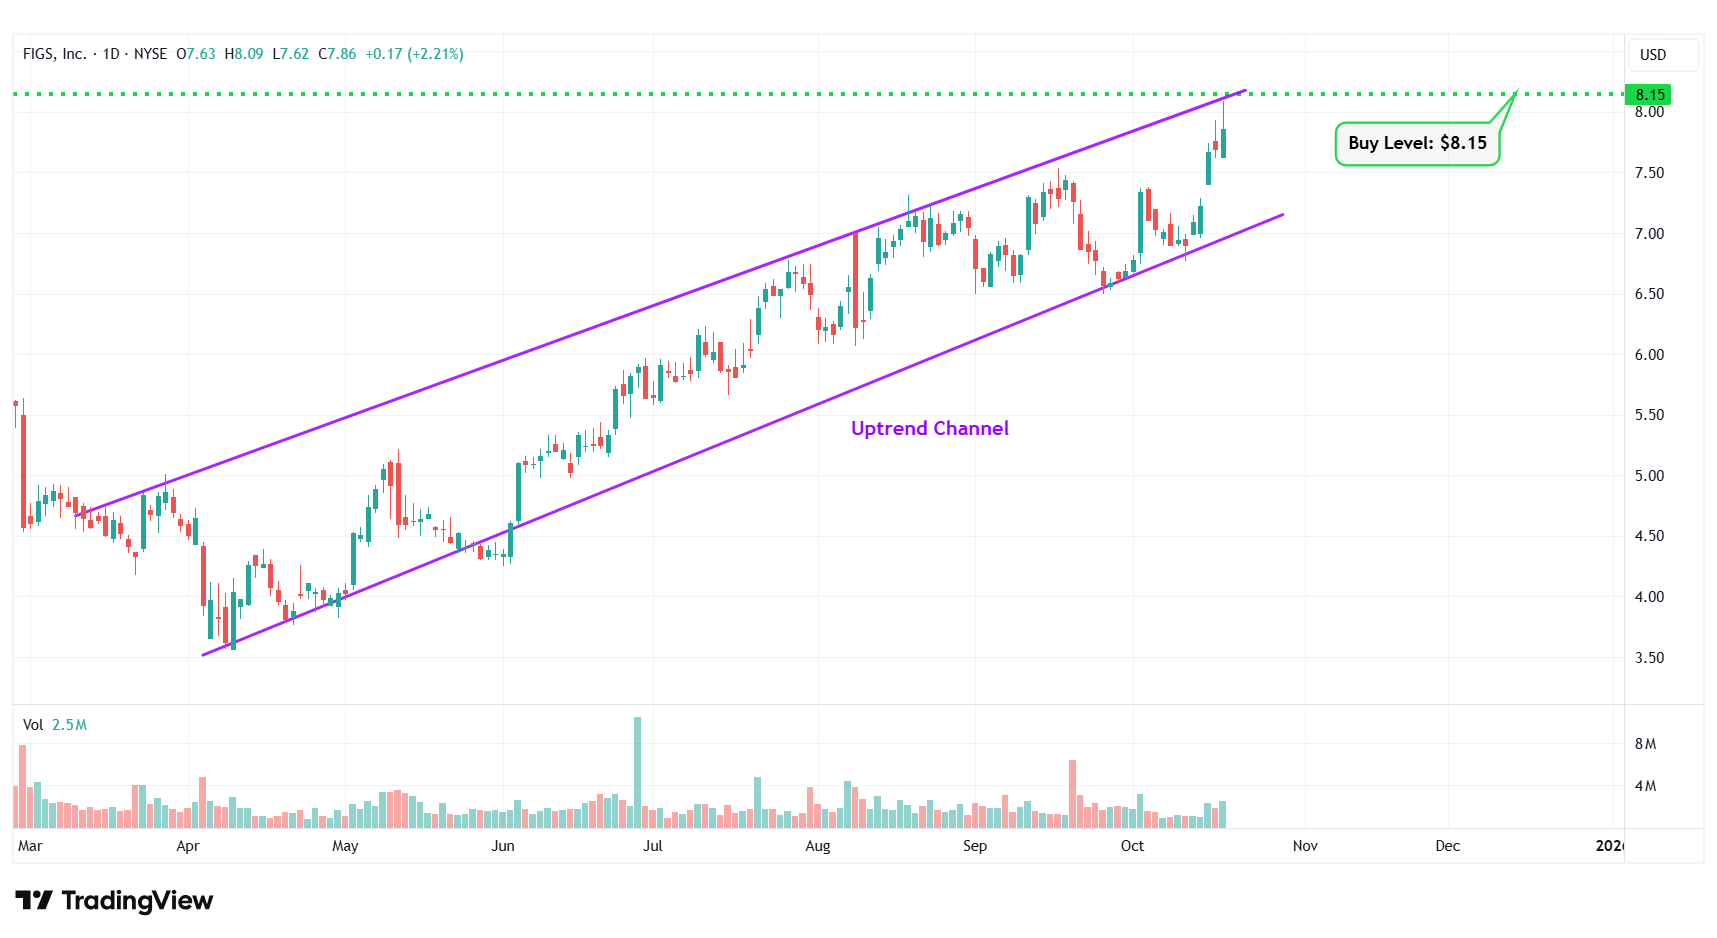
FIGS – Uptrend Channel
#10 Coca-Cola Co (NYSE: KO)
Sector: Consumer Defensive • Beverages – Non-Alcoholic
Reason: Formation of a Falling Wedge Pattern
A falling wedge pattern is formed by joining two downward-sloping, converging trendlines having a contracting range. The pattern appears to be wide at the top and continues to contract as prices fall. A breakout from a falling wedge pattern can indicate either reversal or continuation depending on where the pattern appeared in the trend.
A stock that has broken out of a falling wedge pattern would have gained momentum and would have the potential to move higher.
Buy Level(s): The ideal buy level for KO is if the stock breaks out of the falling wedge pattern, at a price of around $69.10. This is marked in the chart below as a green color dotted line.
Daily chart – KO
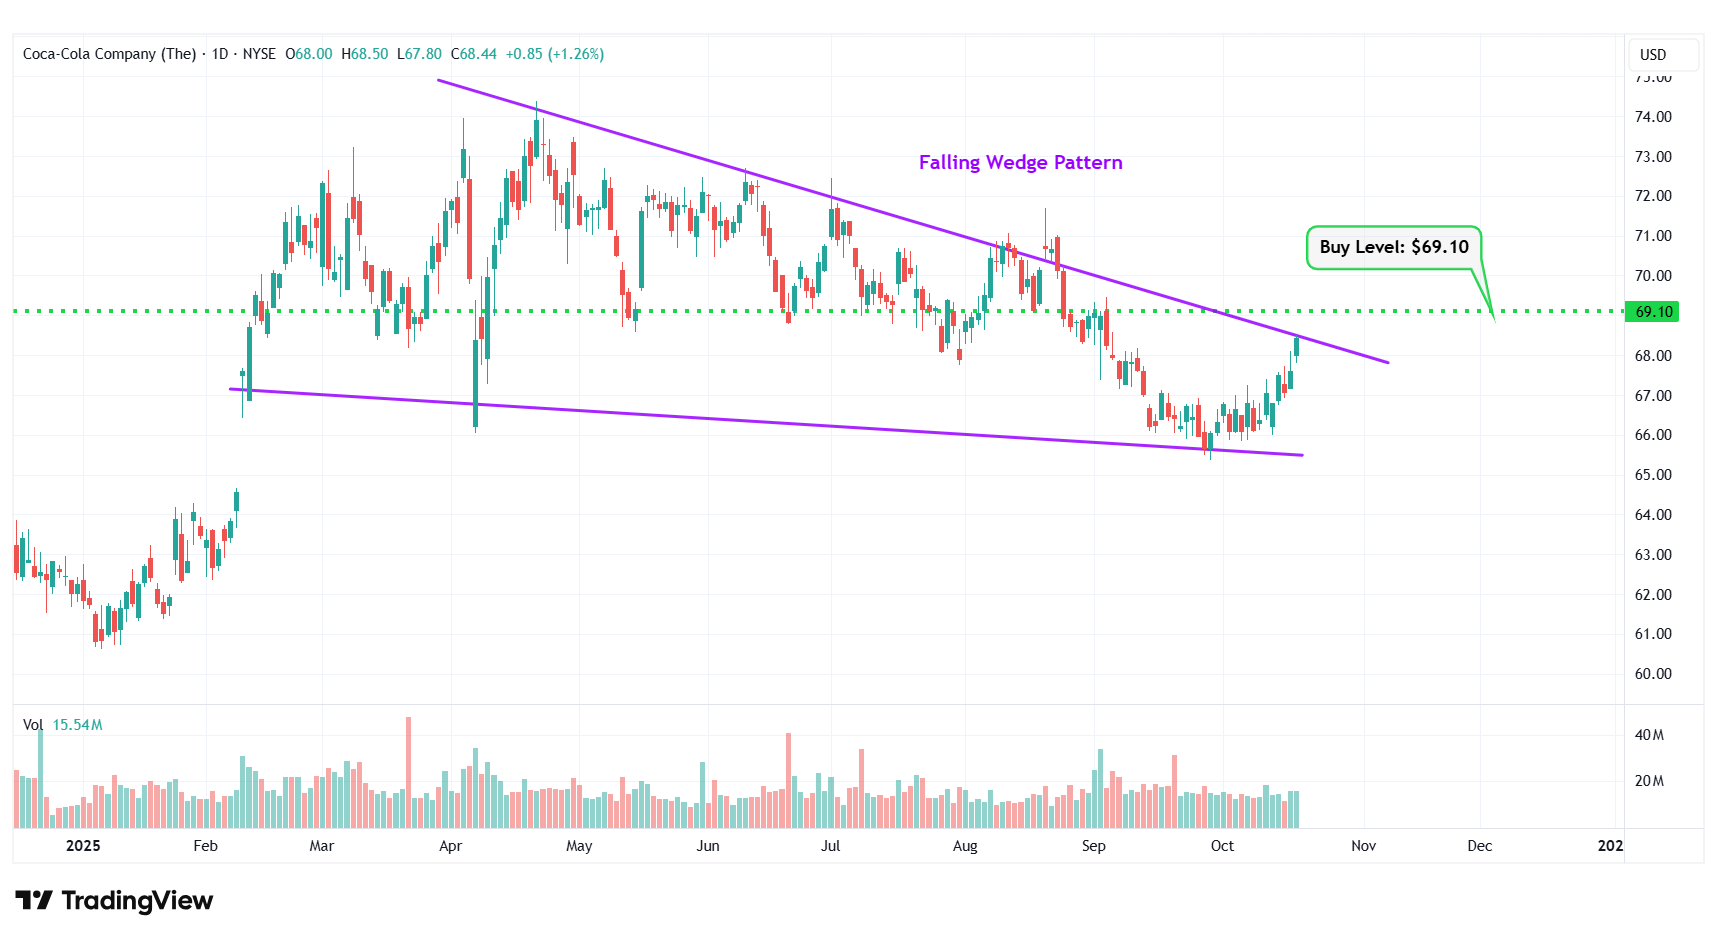
KO – Falling Wedge Pattern
Happy Trading!
Trades of The Day Research Team
The old way of investing in tech giants is over. A NEW strategy unlocks 146X more income on the SAME underlying stocks (like Meta, Apple, and Amazon) -- WITHOUT options trading. Click here to uncover the NEW MAG-7 alternative.
Source: Trades of the Day
