Picking a winning trade on a consistent basis is not simply a stroke of luck. It’s the result of calculated screening, planning, and deliberation.
With this in mind, we have started a new weekly series on our top 10 stocks to watch this week — stocks that look poised for a possible breakout in the coming days. Traders should add these stocks to their watchlist now.
The Top 10 Stocks to Watch This Week for Possible Breakouts
| Sl # | Name of the Stock | Stock Ticker | Last Close | Buy Level(s) | Reason |
| 1 | A-Mark Precious Metals Inc. | NASDAQ: AMRK | $26.98 | $27.30 | Symmetrical Triangle Pattern Breakout |
| 2 | Jamf Holding Corp | NASDAQ: JAMF | $10.60 | $10.80 | Downtrend Channel |
| 3 | Rigetti Computing Inc. | NASDAQ: RGTI | $19.09 | $19.50 | Symmetrical Triangle Pattern Breakout |
| 4 | Alcoa Corp. | NYSE: AA | $33.24 | $33.50 | Symmetrical Triangle Pattern Breakout |
| 5 | Microsoft Corporation | NASDAQ: MSFT | $509.90 | $512.00 | Flag Pattern Breakout |
| 6 | Serve Robotics Inc. | NASDAQ: SERV | $12.13 | $13.00 | Symmetrical Triangle Pattern Breakout |
| 7 | Grab Holdings Limited | NASDAQ: GRAB | $6.00 | $6.10 | Symmetrical Triangle Pattern Breakout |
| 8 | Rocket Lab Corp | NASDAQ: RKLB | $53.34 | $53.90 | Flag Pattern Breakout |
| 9 | QuantaSing Group Ltd ADR | NASDAQ: QSG | $11.70 | $12.10 | Symmetrical Triangle Pattern Breakout |
| 10 | Apple Inc. | NASDAQ: AAPL | $234.07 | $242.30 | Symmetrical Triangle Pattern |
Important: Typically, these trades offer a risk: reward ratio of 1:2 or 1:3 in the next 6 months, which implies 2x to 3x rewards when compared to risks. So, be sure to set your stop-loss levels and target prices accordingly to manage your risk. In addition, these trade ideas are triggered using daily closing prices, not intra-day pricing. So, if you participate in these trades, make sure that you only buy the stock once its daily close is above the recommended price level.
That said, here are the top 10 stocks to watch for a breakout, in no particular order.
#1 A-Mark Precious Metals Inc. (NASDAQ: AMRK)
Sector: Financial • Capital Markets
Reason: Symmetrical Triangle Pattern Breakout
A symmetrical triangle is a chart pattern formed by two converging trend lines connecting a series of sequential peaks and troughs. These two lines result in the formation of a triangle that appears to be symmetrical.
A symmetrical triangle pattern is usually formed when there is indecision in the price movements and there is uncertainty among the buyers and sellers. This chart pattern represents a period of consolidation before the price breaks out or breaks down. In case a breakout occurs from the upper trend line, it is a strong bullish indication as it signifies the start of a new bullish trend.
Buy Level(s): The stock has currently broken out of a symmetrical triangle pattern. However, the ideal buy level for AMRK is if the stock closes above the immediate resistance level of $27.30. This is marked in the chart below as a green color dotted line.
Daily chart – AMRK
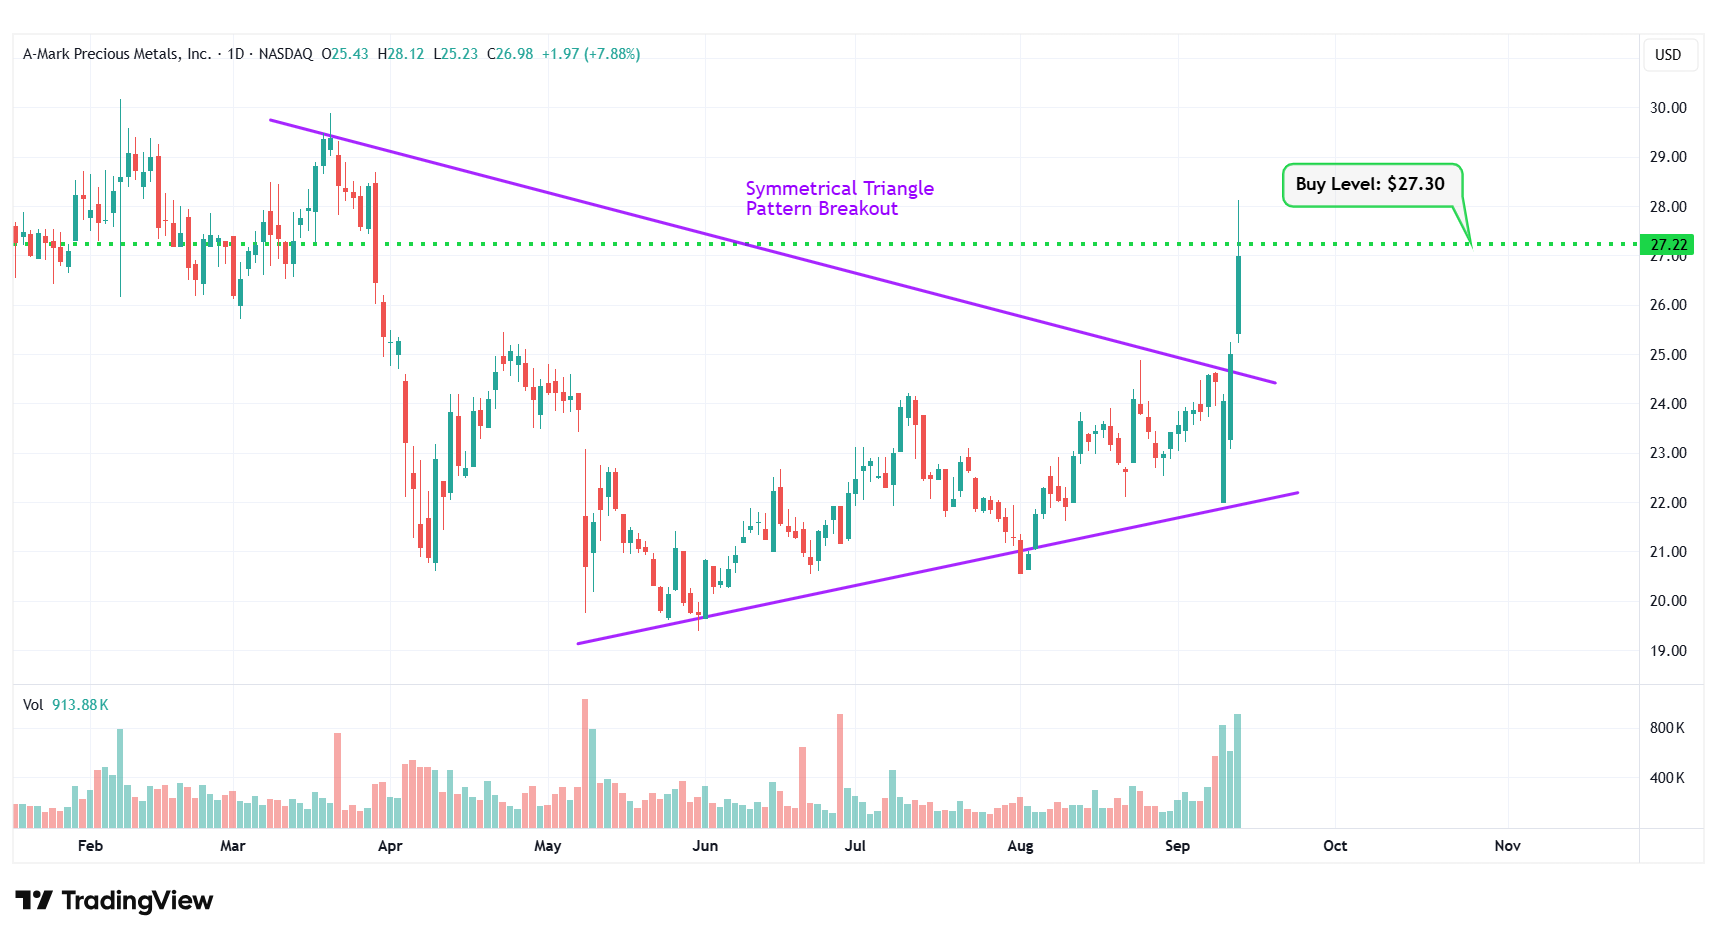
AMRK – Symmetrical Triangle Pattern Breakout
#2 Jamf Holding Corp (NASDAQ: JAMF)
Sector: Technology • Software – Application
Reason: Formation of a Downtrend Channel
A downtrend or descending channel is the price action contained between downward sloping parallel lines. It is formed by two lines that are drawn by connecting the lower highs and lower lows of a stock’s price. Even though this is typically a bearish pattern, a breakout from the upper rail of this pattern is considered a good bullish indication.
Buy Level(s): The daily chart shows that the stock is currently forming a downtrend channel. The ideal buy level for JAMF is if the stock breaks out of the downtrend channel and has a daily close above $10.80. This is marked in the chart below as a green color dotted line.
Daily chart – JAMF
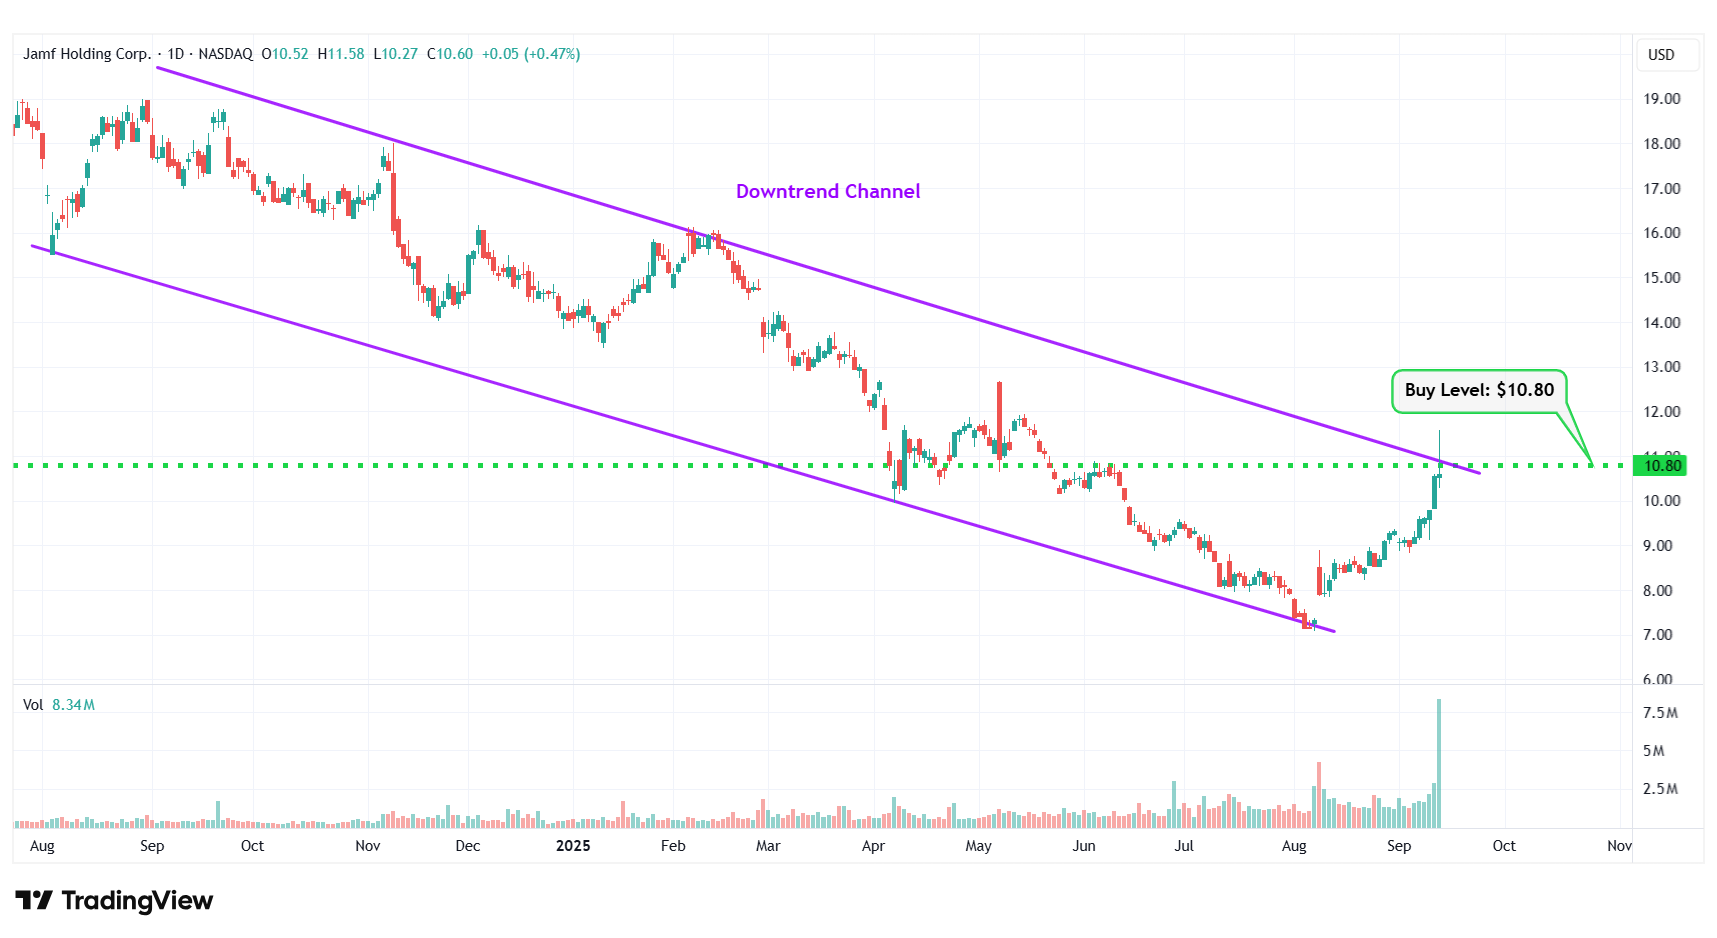
JAMF – Downtrend Channel
#3 Rigetti Computing Inc. (NASDAQ: RGTI)
Sector: Technology • Computer Hardware
Reason: Symmetrical Triangle Pattern Breakout
A symmetrical triangle is a chart pattern formed by two converging trend lines connecting a series of sequential peaks and troughs. These two lines result in the formation of a triangle that appears to be symmetrical.
A symmetrical triangle pattern is usually formed when there is indecision in the price movements and there is uncertainty among the buyers and sellers. This chart pattern represents a period of consolidation before the price breaks out or breaks down. In case a breakout occurs from the upper trend line, it is a strong bullish indication as it signifies the start of a new bullish trend.
Buy Level(s): The stock has currently broken out of a symmetrical triangle pattern. However, the ideal buy level for RGTI is if the stock closes above the immediate resistance level of $19.50. This is marked in the chart below as a green color dotted line.
Daily chart – RGTI
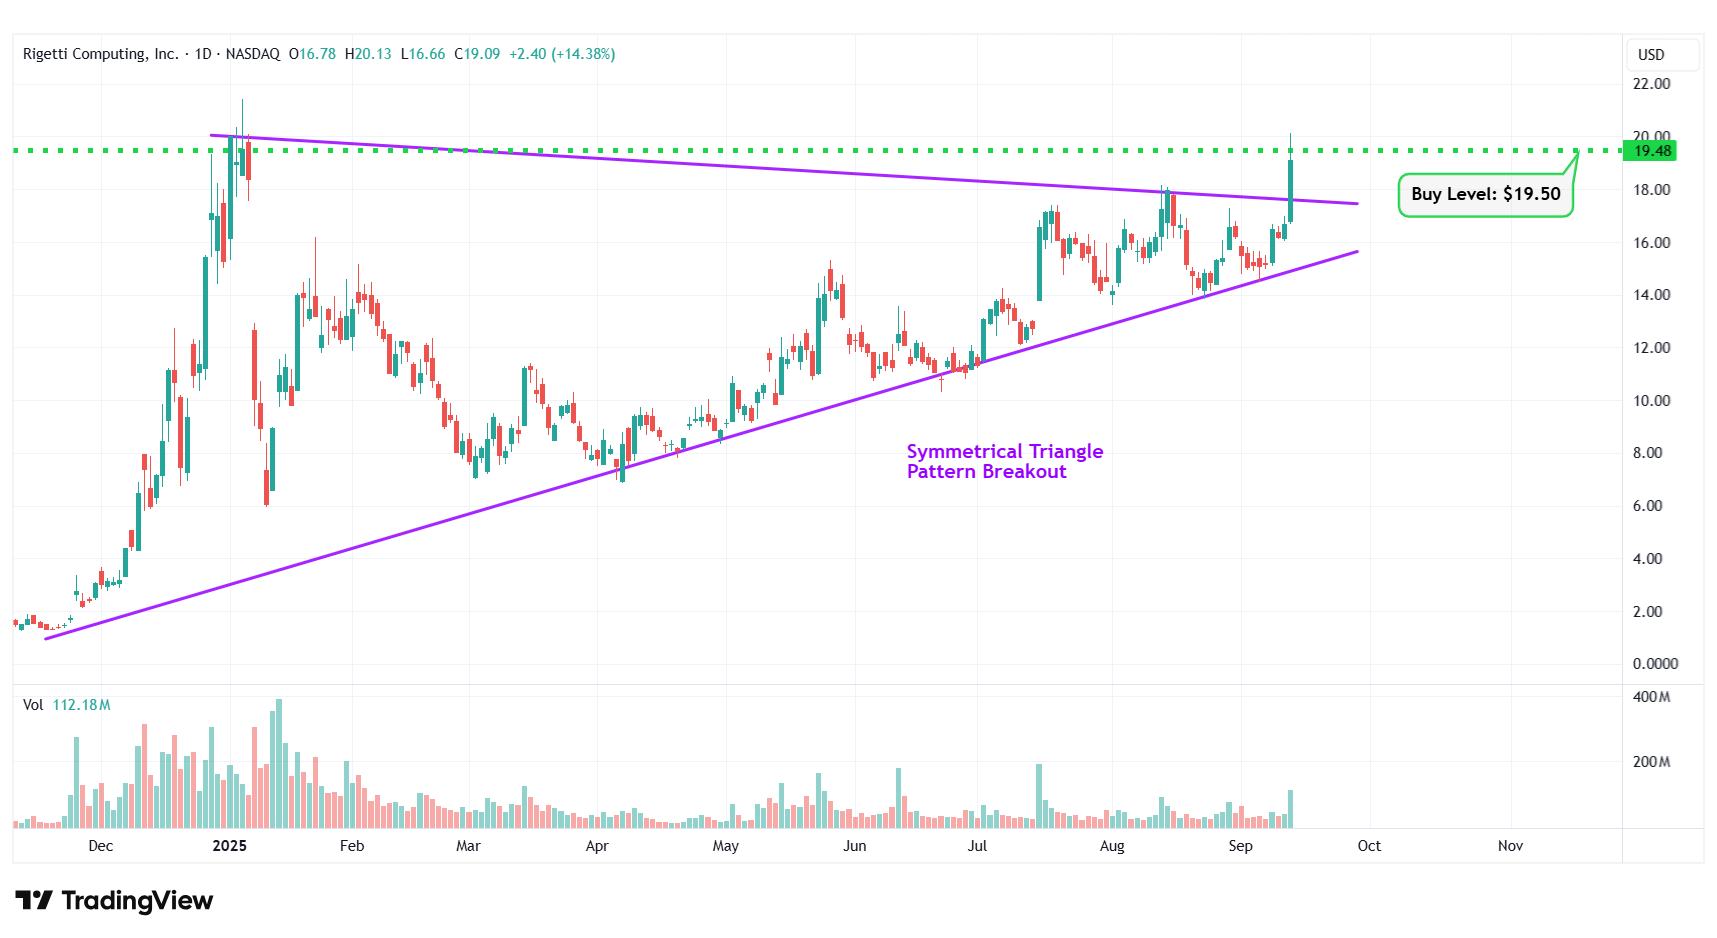
RGTI – Symmetrical Triangle Pattern Breakout
#4 Alcoa Corp. (NYSE: AA)
Sector: Basic Materials • Aluminum
Reason: Symmetrical Triangle Pattern Breakout
A symmetrical triangle is a chart pattern formed by two converging trend lines connecting a series of sequential peaks and troughs. These two lines result in the formation of a triangle that appears to be symmetrical.
A symmetrical triangle pattern is usually formed when there is indecision in the price movements and there is uncertainty among the buyers and sellers. This chart pattern represents a period of consolidation before the price breaks out or breaks down. In case a breakout occurs from the upper trend line, it is a strong bullish indication as it signifies the start of a new bullish trend.
Buy Level(s): The stock has currently broken out of a symmetrical triangle pattern. However, the ideal buy level for AA is if the stock closes above the immediate resistance level of $33.50. This is marked in the chart below as a green color dotted line.
Daily chart – AA
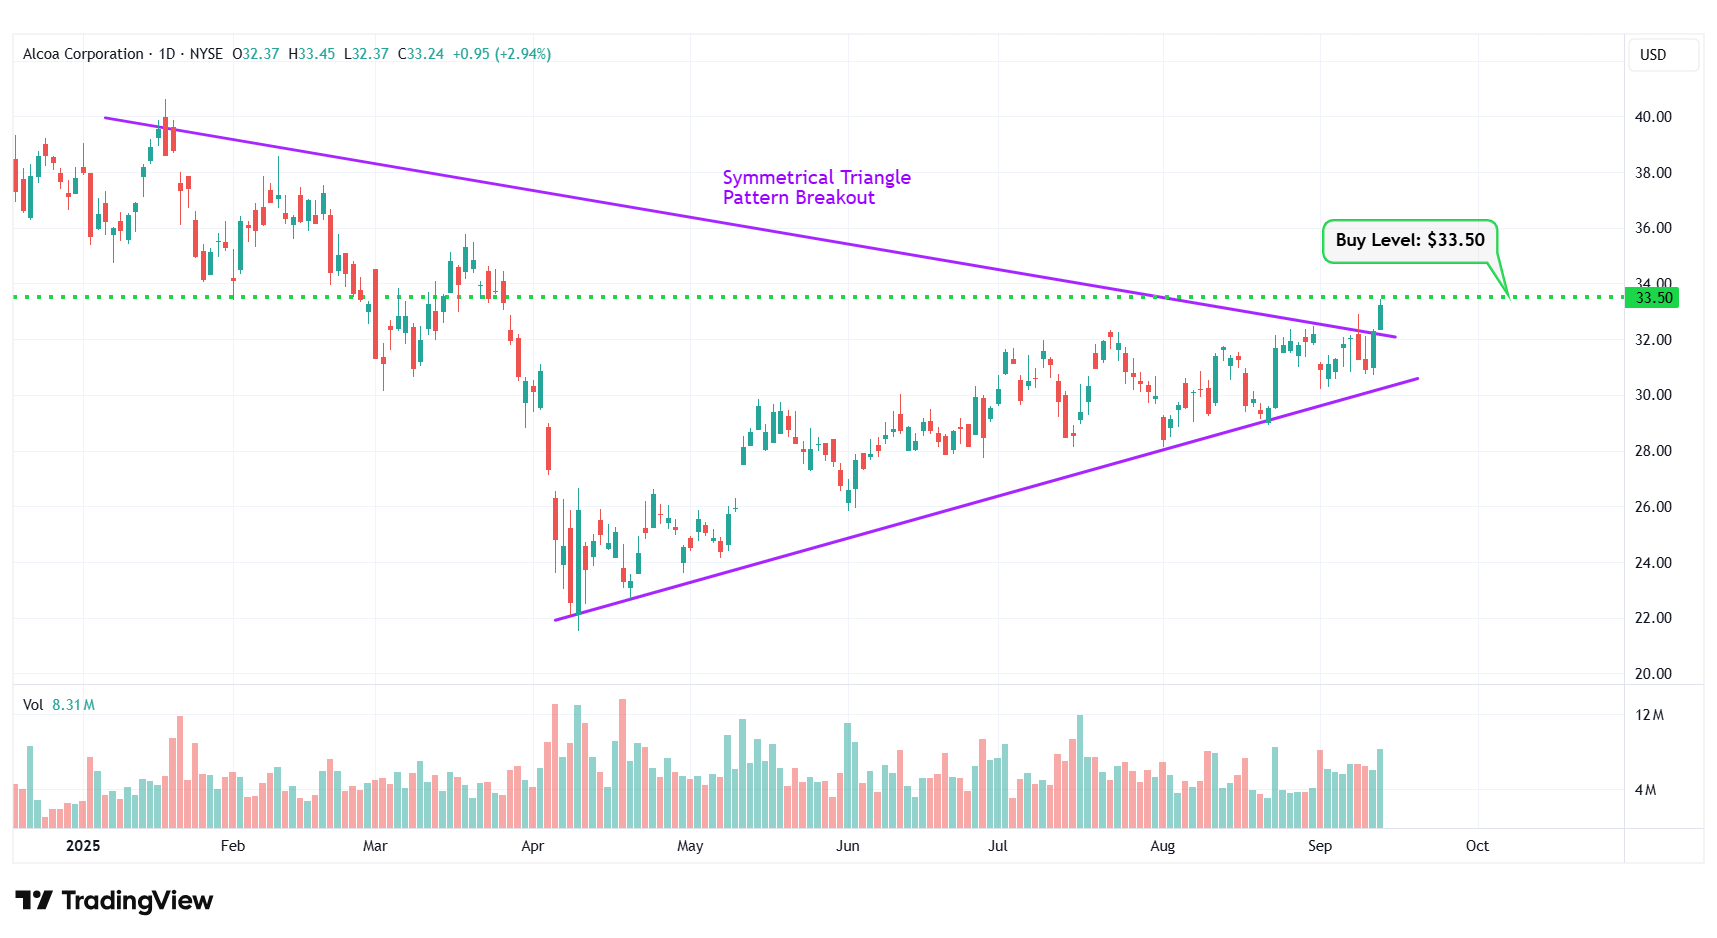
AA – Symmetrical Triangle Pattern Breakout
#5 Microsoft Corporation (NASDAQ: MSFT)
Sector: Technology • Software – Infrastructure
Reason: Breakout From a Flag Pattern
A flag pattern is a short-term continuation pattern that marks a small consolidation before the previous move resumes. The pattern is formed when the market consolidates in a narrow range after a sharp move. For a stock in an uptrend, a breakout from this pattern is typically a strong bullish indication.
Buy Level(s): Although the stock has currently broken out of the flag pattern, the ideal buy level for MSFT is above the near-term resistance level of $512.00. This is marked in the chart below as a green color dotted line.
Daily chart – MSFT
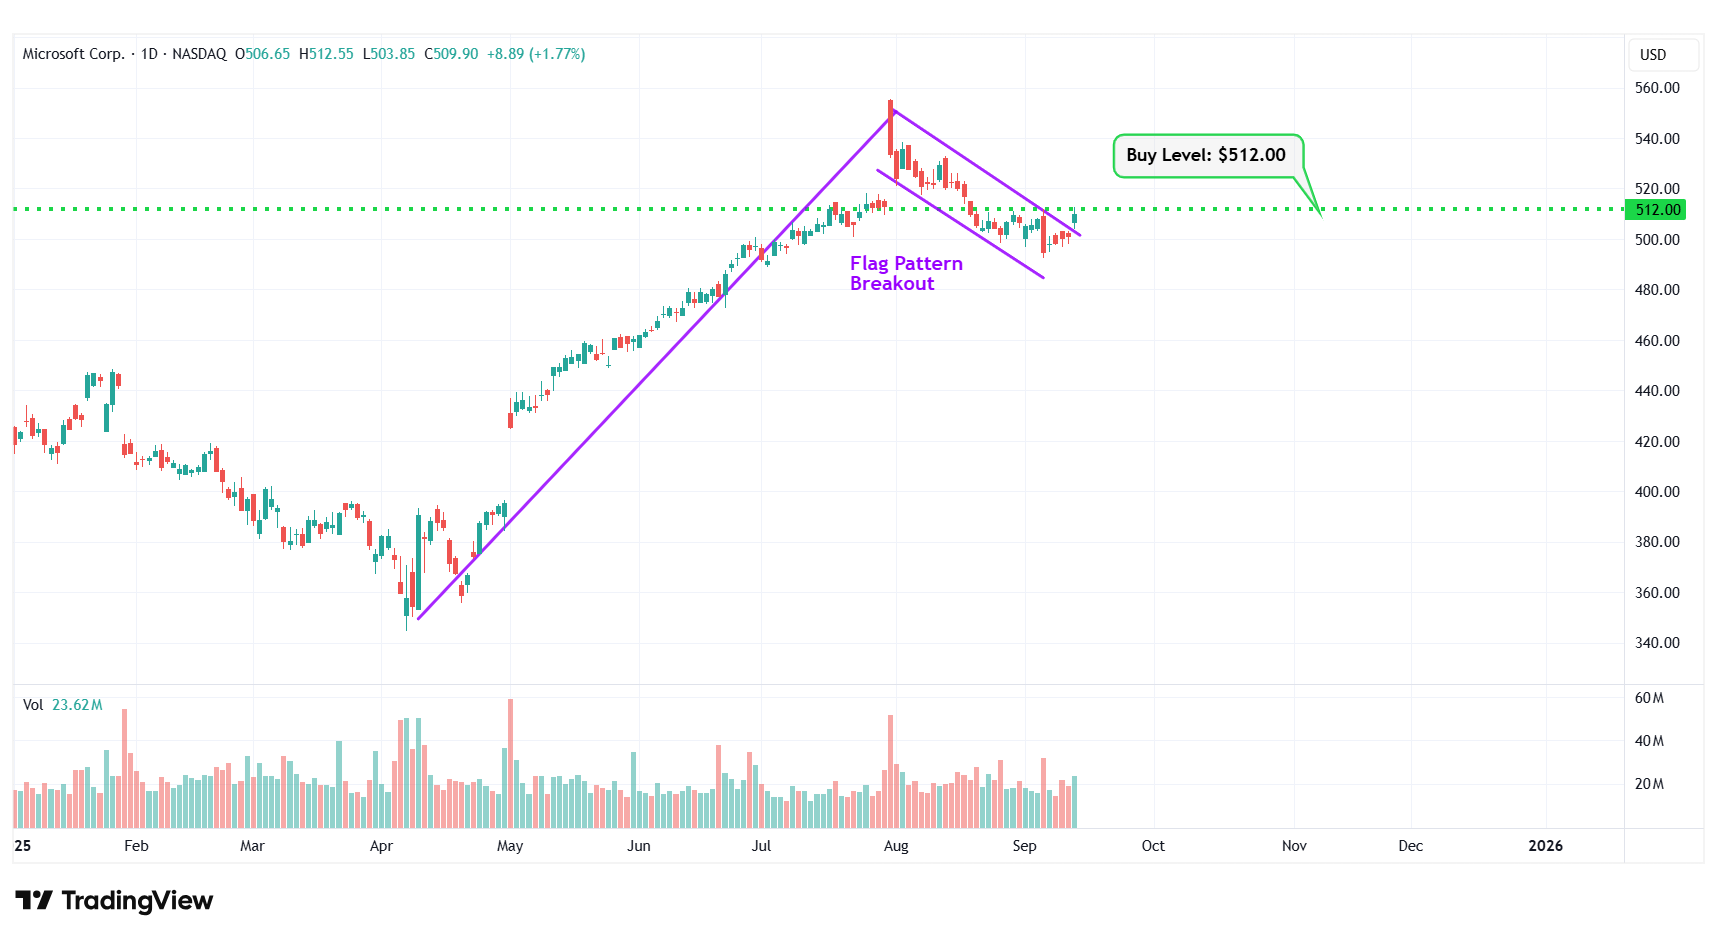
MSFT – Flag Pattern Breakout
#6 Serve Robotics Inc. (NASDAQ: SERV)
Sector: Industrials • Specialty Industrial Machinery
Reason: Symmetrical Triangle Pattern Breakout
A symmetrical triangle is a chart pattern formed by two converging trend lines connecting a series of sequential peaks and troughs. These two lines result in the formation of a triangle that appears to be symmetrical.
A symmetrical triangle pattern is usually formed when there is indecision in the price movements and there is uncertainty among the buyers and sellers. This chart pattern represents a period of consolidation before the price breaks out or breaks down. In case a breakout occurs from the upper trend line, it is a strong bullish indication as it signifies the start of a new bullish trend.
Buy Level(s): The stock has currently broken out of a symmetrical triangle pattern. However, the ideal buy level for SERV is if the stock closes above the immediate resistance level of $13.00. This is marked in the chart below as a green color dotted line.
Daily chart – SERV
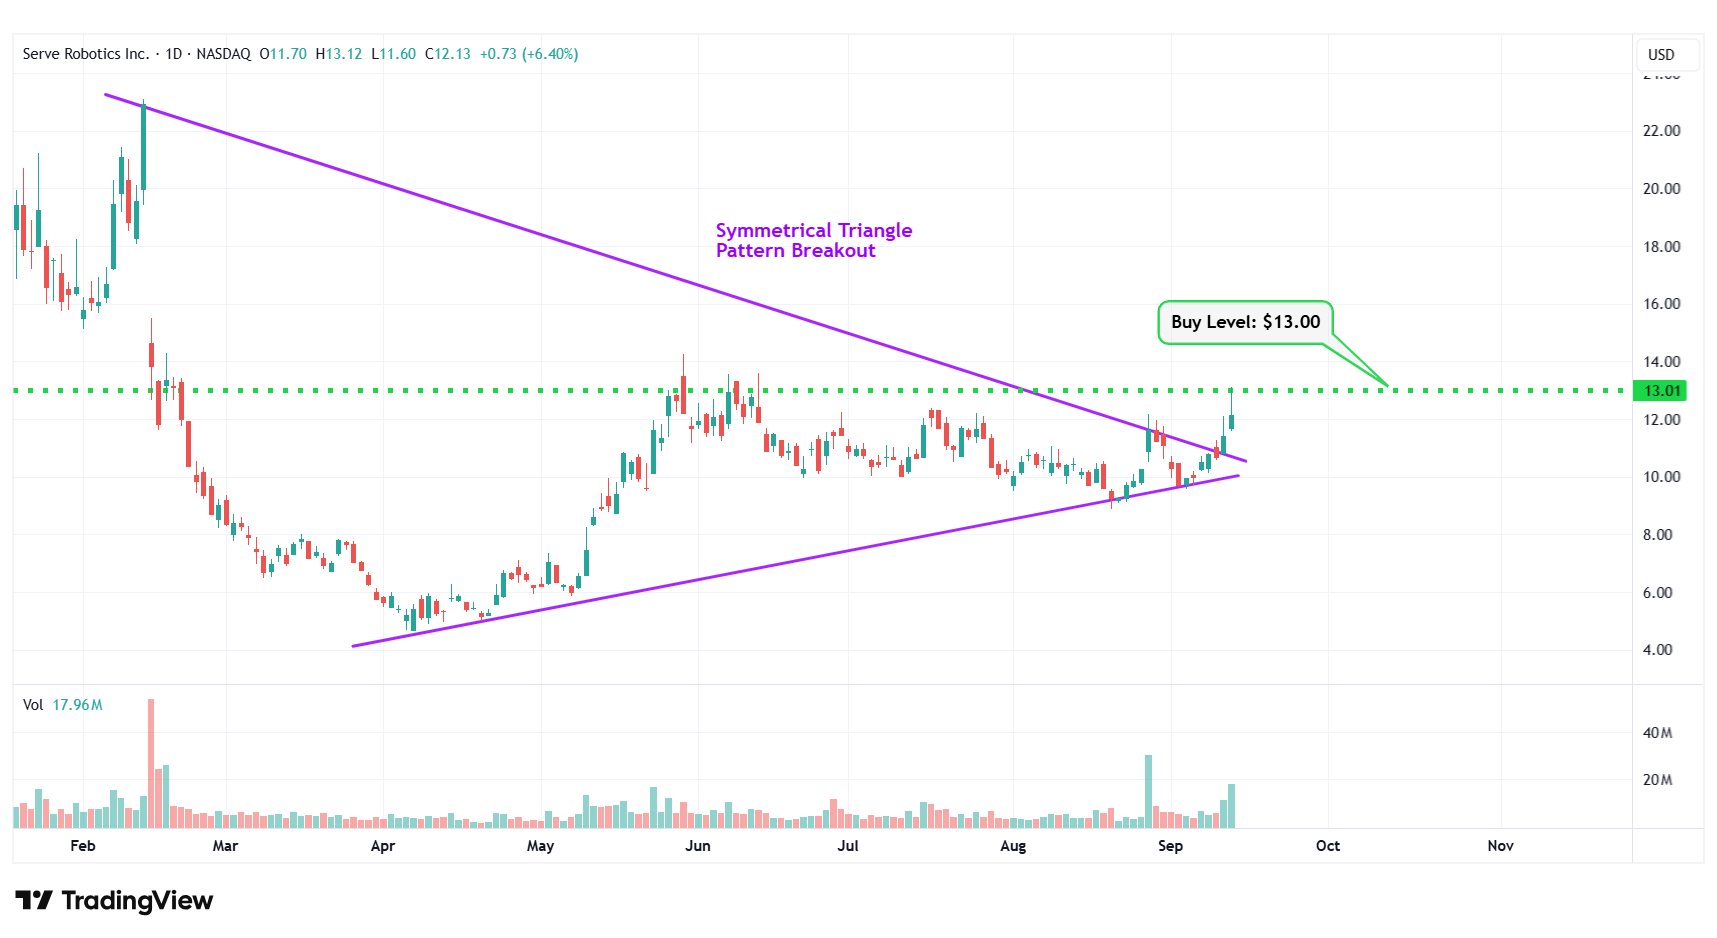
SERV – Symmetrical Triangle Pattern Breakout
#7 Grab Holdings Limited (NASDAQ: GRAB)
Sector: Technology • Software – Application
Reason: Symmetrical Triangle Pattern Breakout
A symmetrical triangle is a chart pattern formed by two converging trend lines connecting a series of sequential peaks and troughs. These two lines result in the formation of a triangle that appears to be symmetrical.
A symmetrical triangle pattern is usually formed when there is indecision in the price movements and there is uncertainty among the buyers and sellers. This chart pattern represents a period of consolidation before the price breaks out or breaks down. In case a breakout occurs from the upper trend line, it is a strong bullish indication as it signifies the start of a new bullish trend.
Buy Level(s): The stock has currently broken out of a symmetrical triangle pattern. However, the ideal buy level for GRAB is if the stock closes above the immediate resistance level of $6.10. This is marked in the chart below as a green color dotted line.
Daily chart – GRAB
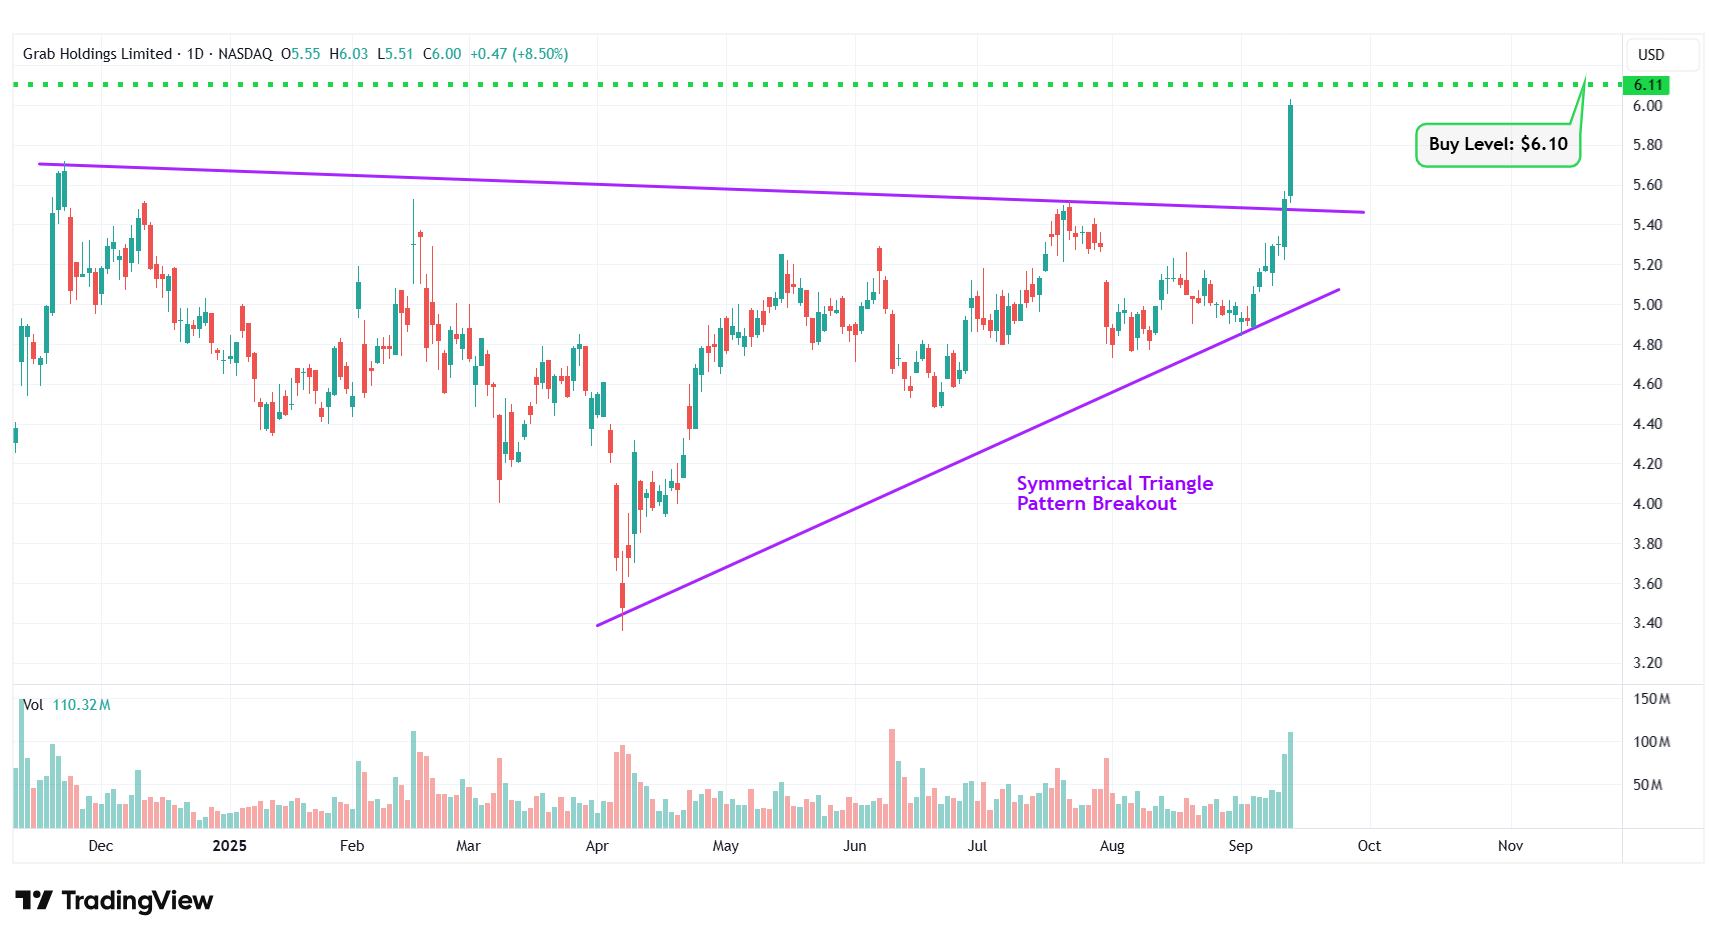
GRAB – Symmetrical Triangle Pattern Breakout
#8 Rocket Lab Corp (NASDAQ: RKLB)
Sector: Industrials • Aerospace & Defense
Reason: Breakout From a Flag Pattern
A flag pattern is a short-term continuation pattern that marks a small consolidation before the previous move resumes. The pattern is formed when the market consolidates in a narrow range after a sharp move. For a stock in an uptrend, a breakout from this pattern is typically a strong bullish indication.
Buy Level(s): Although the stock has currently broken out of the flag pattern, the ideal buy level for RKLB is above the near-term resistance level of $53.90. This is marked in the chart below as a green color dotted line.
Daily chart – RKLB
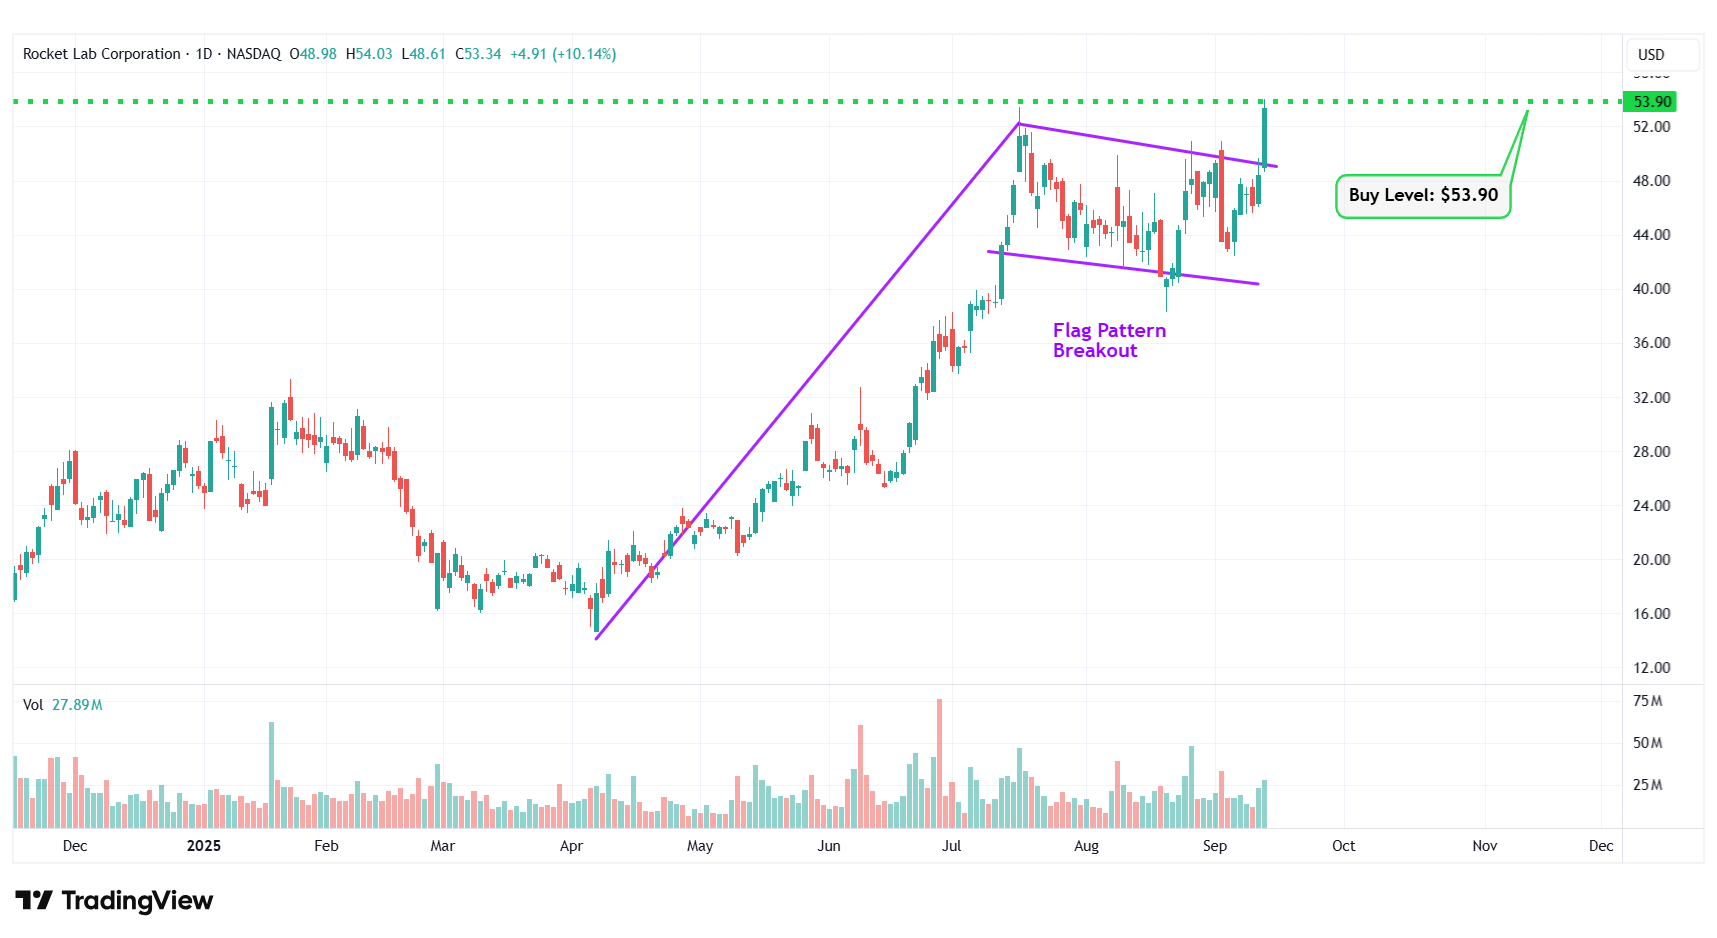
RKLB – Flag Pattern Breakout
#9 QuantaSing Group Ltd ADR (NASDAQ: QSG)
Sector: Consumer Defensive • Education & Training Services
Reason: Symmetrical Triangle Pattern Breakout
A symmetrical triangle is a chart pattern formed by two converging trend lines connecting a series of sequential peaks and troughs. These two lines result in the formation of a triangle that appears to be symmetrical.
A symmetrical triangle pattern is usually formed when there is indecision in the price movements and there is uncertainty among the buyers and sellers. This chart pattern represents a period of consolidation before the price breaks out or breaks down. In case a breakout occurs from the upper trend line, it is a strong bullish indication as it signifies the start of a new bullish trend.
Buy Level(s): The stock has currently broken out of a symmetrical triangle pattern. However, the ideal buy level for QSG is if the stock closes above the immediate resistance level of $12.10. This is marked in the chart below as a green color dotted line.
Daily chart – QSG
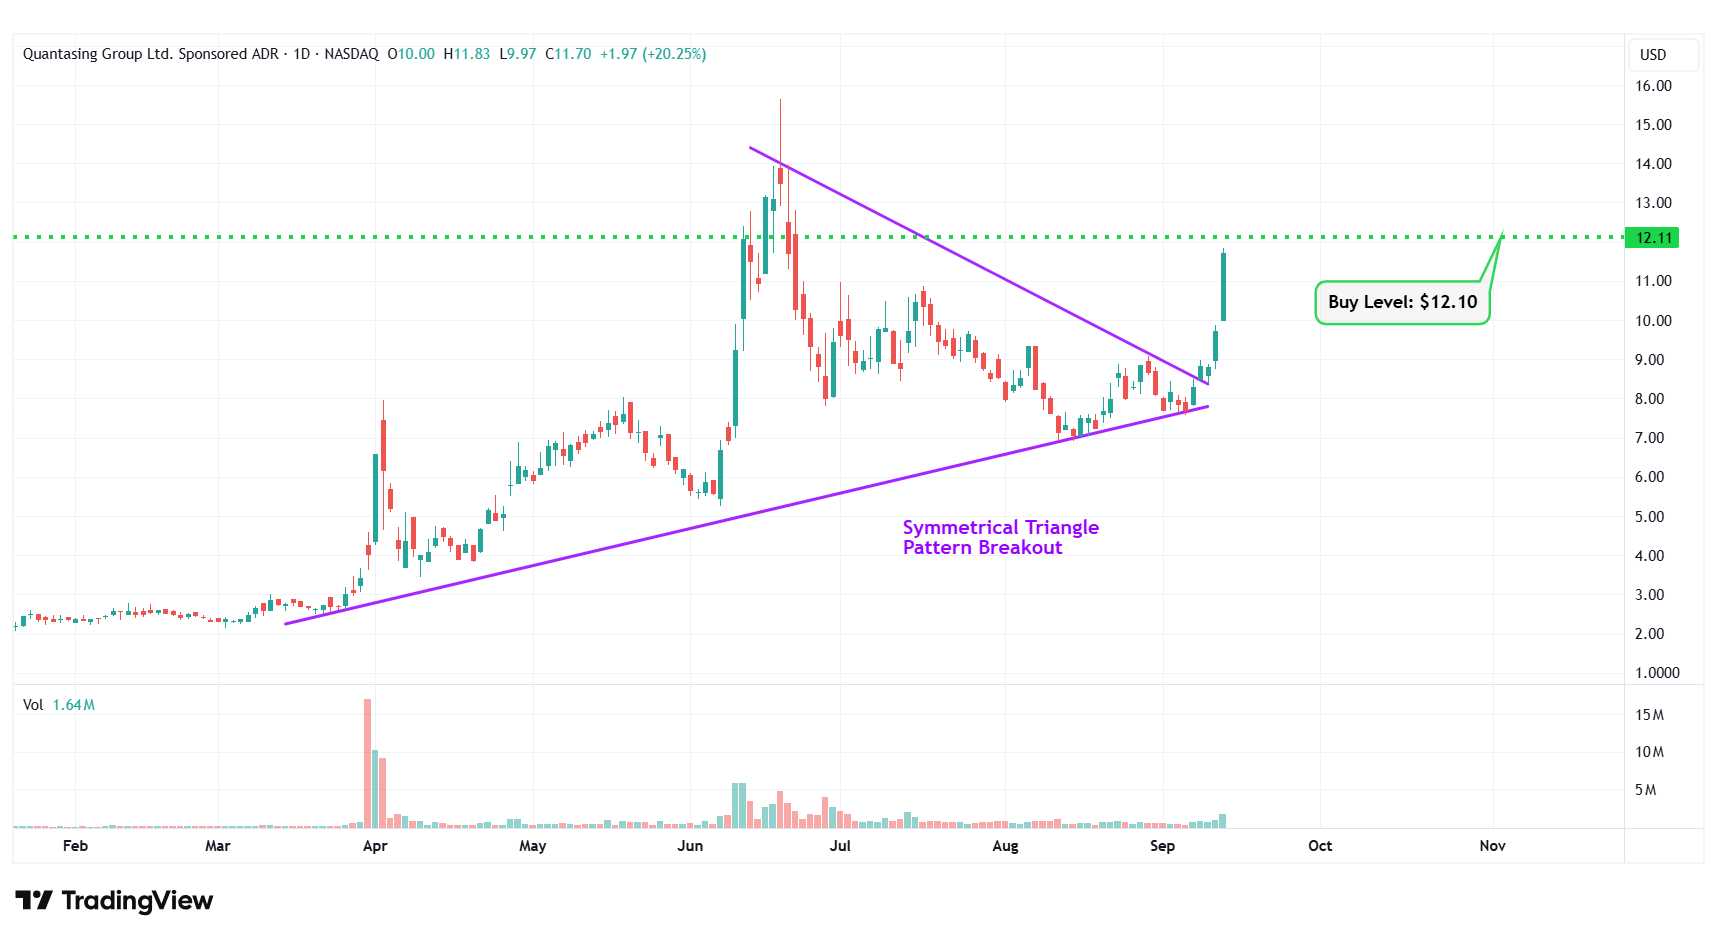
QSG – Symmetrical Triangle Pattern Breakout
#10 Apple Inc. (NASDAQ: AAPL)
Sector: Technology • Consumer Electronics
Reason: Formation of a Symmetrical Triangle Pattern
A symmetrical triangle is a chart pattern formed by two converging trend lines connecting a series of sequential peaks and troughs. These two lines result in the formation of a triangle that appears to be symmetrical.
A symmetrical triangle pattern is usually formed when there is indecision in the price movements and there is uncertainty among the buyers and sellers. This chart pattern represents a period of consolidation before the price breaks out or breaks down. In case a breakout occurs from the upper trend line, it is a strong bullish indication as it signifies the start of a new bullish trend.
Buy Level(s): The ideal buy level for AAPL is if the stock has a daily close above the breakout level of the symmetrical triangle pattern, at around $242.30. This is marked in the chart below as a green color dotted line.
Daily chart – AAPL
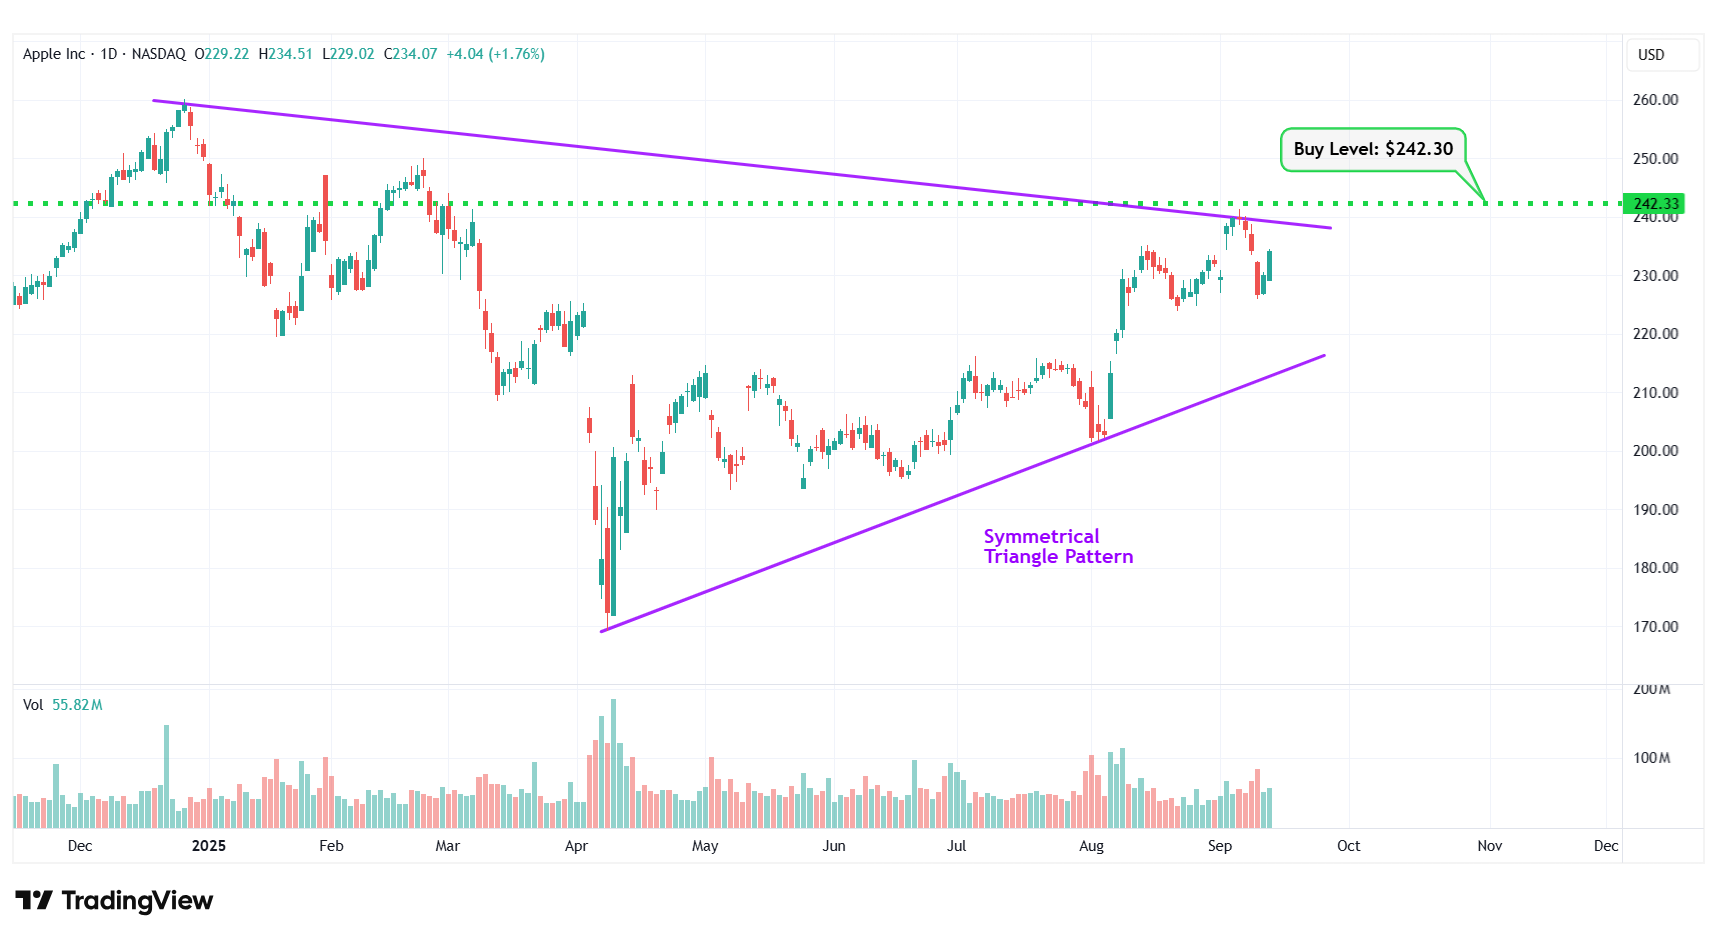
AAPL – Symmetrical Triangle Pattern
Happy Trading!
Trades of The Day Research Team
Legendary fund manager Louis Navellier – a man Forbes calls "the king of quants" – is going "ALL-IN" on this game-changing AI technology. He says, "This is the culmination of everything you've been reading about AI for the last 60 years."Get the details...
Source: Trades of the Day

