Picking a winning trade on a consistent basis is not simply a stroke of luck. It’s the result of calculated screening, planning, and deliberation.
With this in mind, we have started a new weekly series on our top 10 stocks to watch this week — stocks that look poised for a possible breakout in the coming days. Traders should add these stocks to their watchlist now.
The Top 10 Stocks to Watch This Week for Possible Breakouts
| Sl # | Name of the Stock | Stock Ticker | Last Close | Buy Level(s) | Reason |
| 1 | Rivian Automotive Inc. | NASDAQ: RIVN | $14.21 | $14.50 | Symmetrical Triangle Pattern Breakout |
| 2 | BILL Holdings Inc. | NYSE: BILL | $51.54 | $52.70 | Breakout From Consolidation Area |
| 3 | Centuri Holdings Inc. | NYSE: CTRI | $21.59 | $22.40 | Symmetrical Triangle Pattern |
| 4 | Mirion Technologies Inc. | NYSE: MIR | $22.90 | $23.00 | Flag Pattern Breakout |
| 5 | Rogers Communications Inc. | NYSE: RCI | $35.89 | $36.20 | Symmetrical Triangle Pattern |
| 6 | Structure Therapeutics Inc. ADR | NASDAQ: GPCR | $22.08 | $22.50 | Symmetrical Triangle Pattern Breakout |
| 7 | QXO Inc. | NYSE: QXO | $22.05 | $22.30 | Flag Pattern Breakout |
| 8 | AGNC Investment Corp. | NASDAQ: AGNC | $10.37 | $10.50 | Symmetrical Triangle Pattern Breakout |
| 9 | Peabody Energy Corp | NYSE: BTU | $19.13 | $19.40 | Symmetrical Triangle Pattern Breakout |
| 10 | Galaxy Digital Inc. | NASDAQ: GLXY | $23.49 | $24.70 | Symmetrical Triangle Pattern |
Important: Typically, these trades offer a risk: reward ratio of 1:2 or 1:3 in the next 6 months, which implies 2x to 3x rewards when compared to risks. So, be sure to set your stop-loss levels and target prices accordingly to manage your risk. In addition, these trade ideas are triggered using daily closing prices, not intra-day pricing. So, if you participate in these trades, make sure that you only buy the stock once its daily close is above the recommended price level.
That said, here are the top 10 stocks to watch for a breakout, in no particular order.
#1 Rivian Automotive Inc. (NASDAQ: RIVN)
Sector: Consumer Cyclical • Auto Manufacturers
Reason: Symmetrical Triangle Pattern Breakout
A symmetrical triangle is a chart pattern formed by two converging trend lines connecting a series of sequential peaks and troughs. These two lines result in the formation of a triangle that appears to be symmetrical.
A symmetrical triangle pattern is usually formed when there is indecision in the price movements and there is uncertainty among the buyers and sellers. This chart pattern represents a period of consolidation before the price breaks out or breaks down. In case a breakout occurs from the upper trend line, it is a strong bullish indication as it signifies the start of a new bullish trend.
Buy Level(s): The stock has currently broken out of a symmetrical triangle pattern. However, the ideal buy level for RIVN is if the stock closes above the immediate resistance level of $14.50. This is marked in the chart below as a green color dotted line.
Daily chart – RIVN
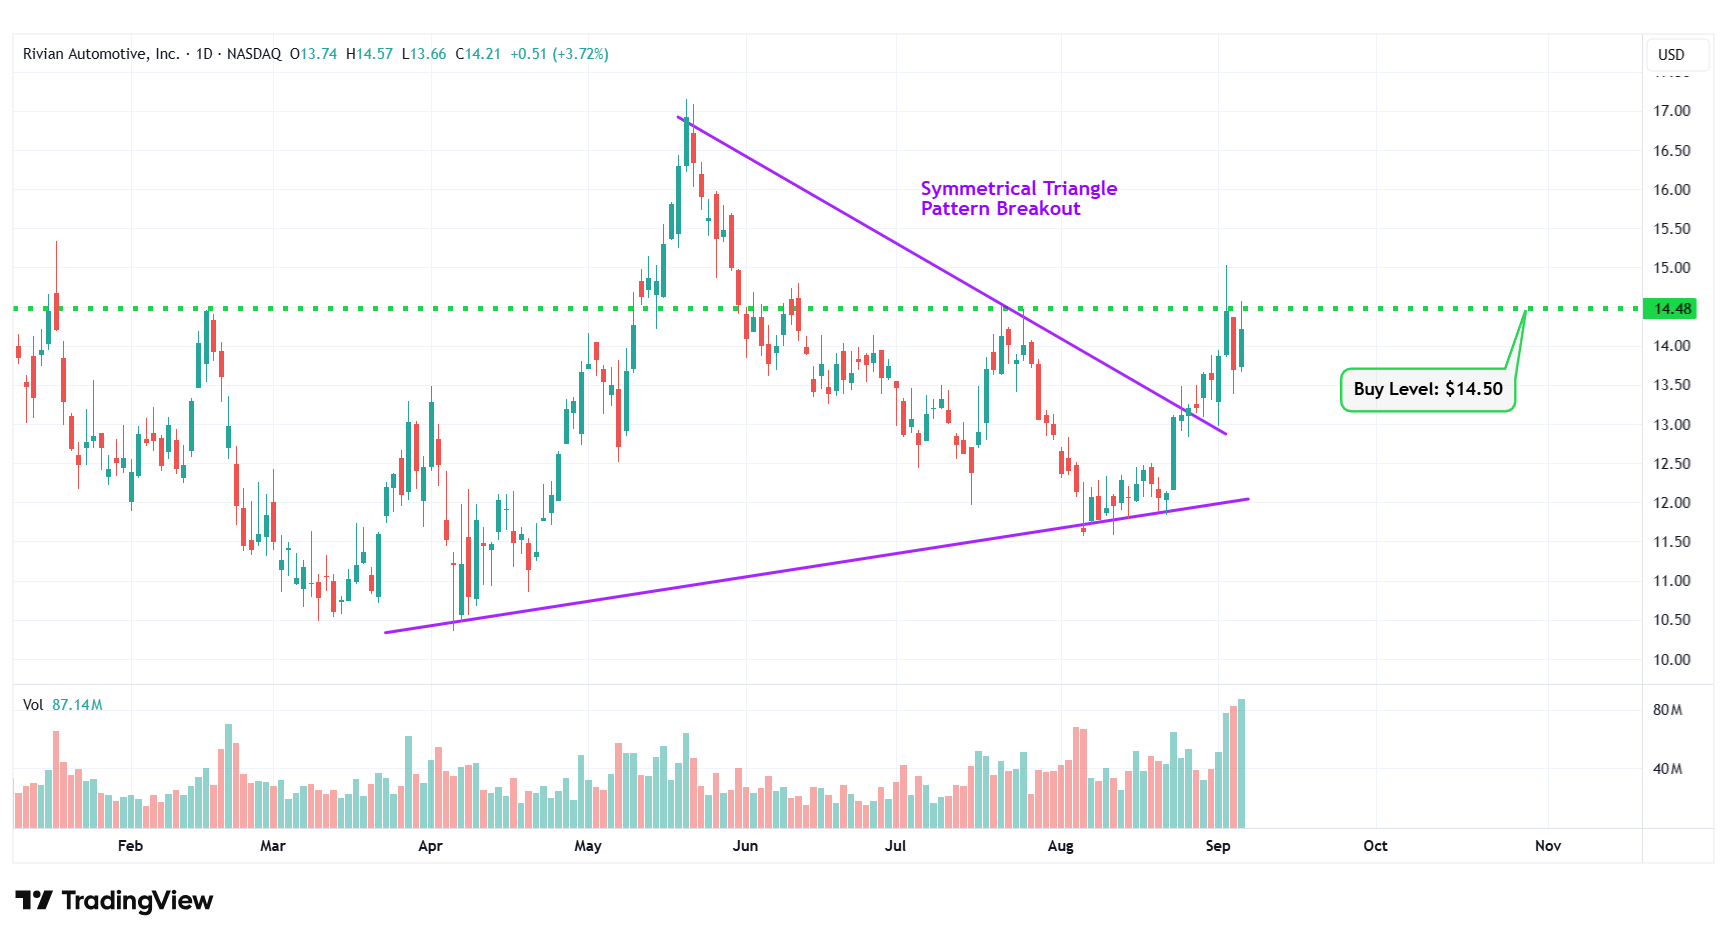
RIVN – Symmetrical Triangle Pattern Breakout
#2 BILL Holdings Inc. (NYSE: BILL)
Sector: Technology • Software – Application
Reason: Breakout From a Consolidation Area in the Daily Chart
A Consolidation Area is a price action contained between two parallel lines. It is formed by a lower line that connects the lows, and an upper line that joins the highs. A stock usually trades between the two lines of the consolidation area before finally breaking out from the upper rail.
Buy Level(s): Although the stock has currently broken out of a consolidation area, the ideal buy level for BILL is above the near-term resistance area, which translates to a price of around $52.70. This is marked in the chart below as a green color dotted line.
Daily chart – BILL
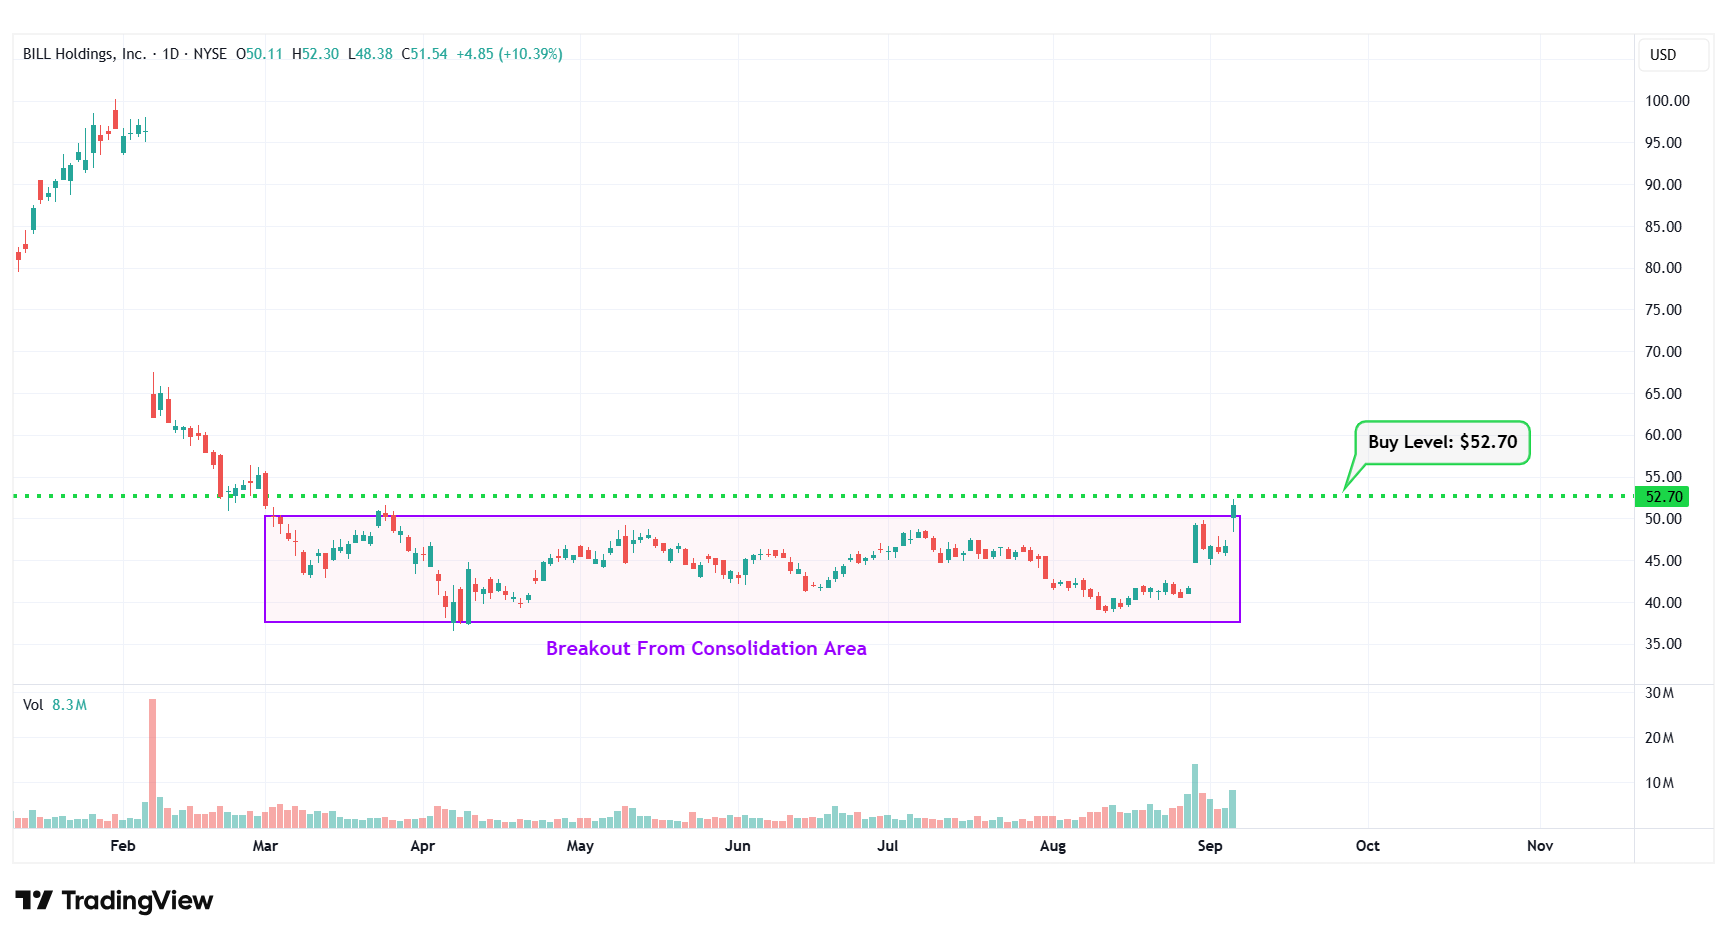
BILL – Breakout From Consolidation Area
#3 Centuri Holdings Inc. (NYSE: CTRI)
Sector: Utilities • Utilities – Regulated Gas
Reason: Formation of a Symmetrical Triangle Pattern
A symmetrical triangle is a chart pattern formed by two converging trend lines connecting a series of sequential peaks and troughs. These two lines result in the formation of a triangle that appears to be symmetrical.
A symmetrical triangle pattern is usually formed when there is indecision in the price movements and there is uncertainty among the buyers and sellers. This chart pattern represents a period of consolidation before the price breaks out or breaks down. In case a breakout occurs from the upper trend line, it is a strong bullish indication as it signifies the start of a new bullish trend.
Buy Level(s): The ideal buy level for CTRI is if the stock has a daily close above the breakout level of the symmetrical triangle pattern, at around $22.40. This is marked in the chart below as a green color dotted line.
Daily chart – CTRI
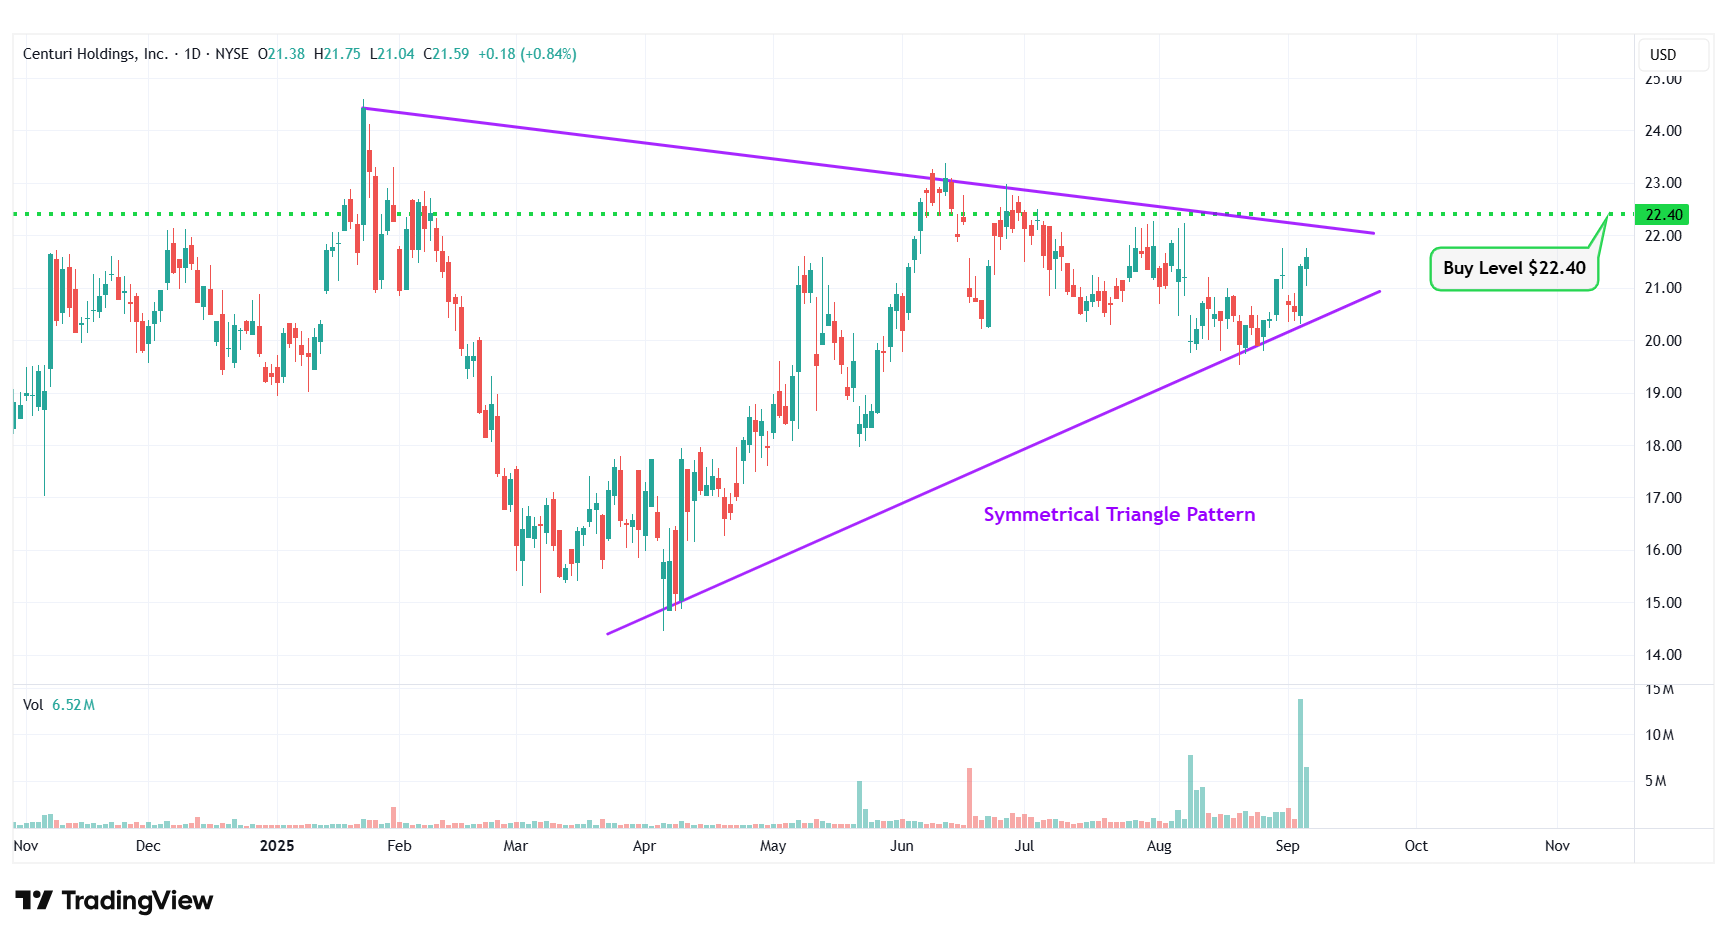
CTRI – Symmetrical Triangle Pattern
#4 Mirion Technologies Inc. (NYSE: MIR)
Sector: Industrials • Specialty Industrial Machinery
Reason: Breakout From a Flag Pattern
A flag pattern is a short-term continuation pattern that marks a small consolidation before the previous move resumes. The pattern is formed when the market consolidates in a narrow range after a sharp move. For a stock in an uptrend, a breakout from this pattern is typically a strong bullish indication.
Buy Level(s): Although the stock has currently broken out of the flag pattern, the ideal buy level for MIR is above the near-term resistance level of $23.00. This is marked in the chart below as a green color dotted line.
Daily chart – MIR
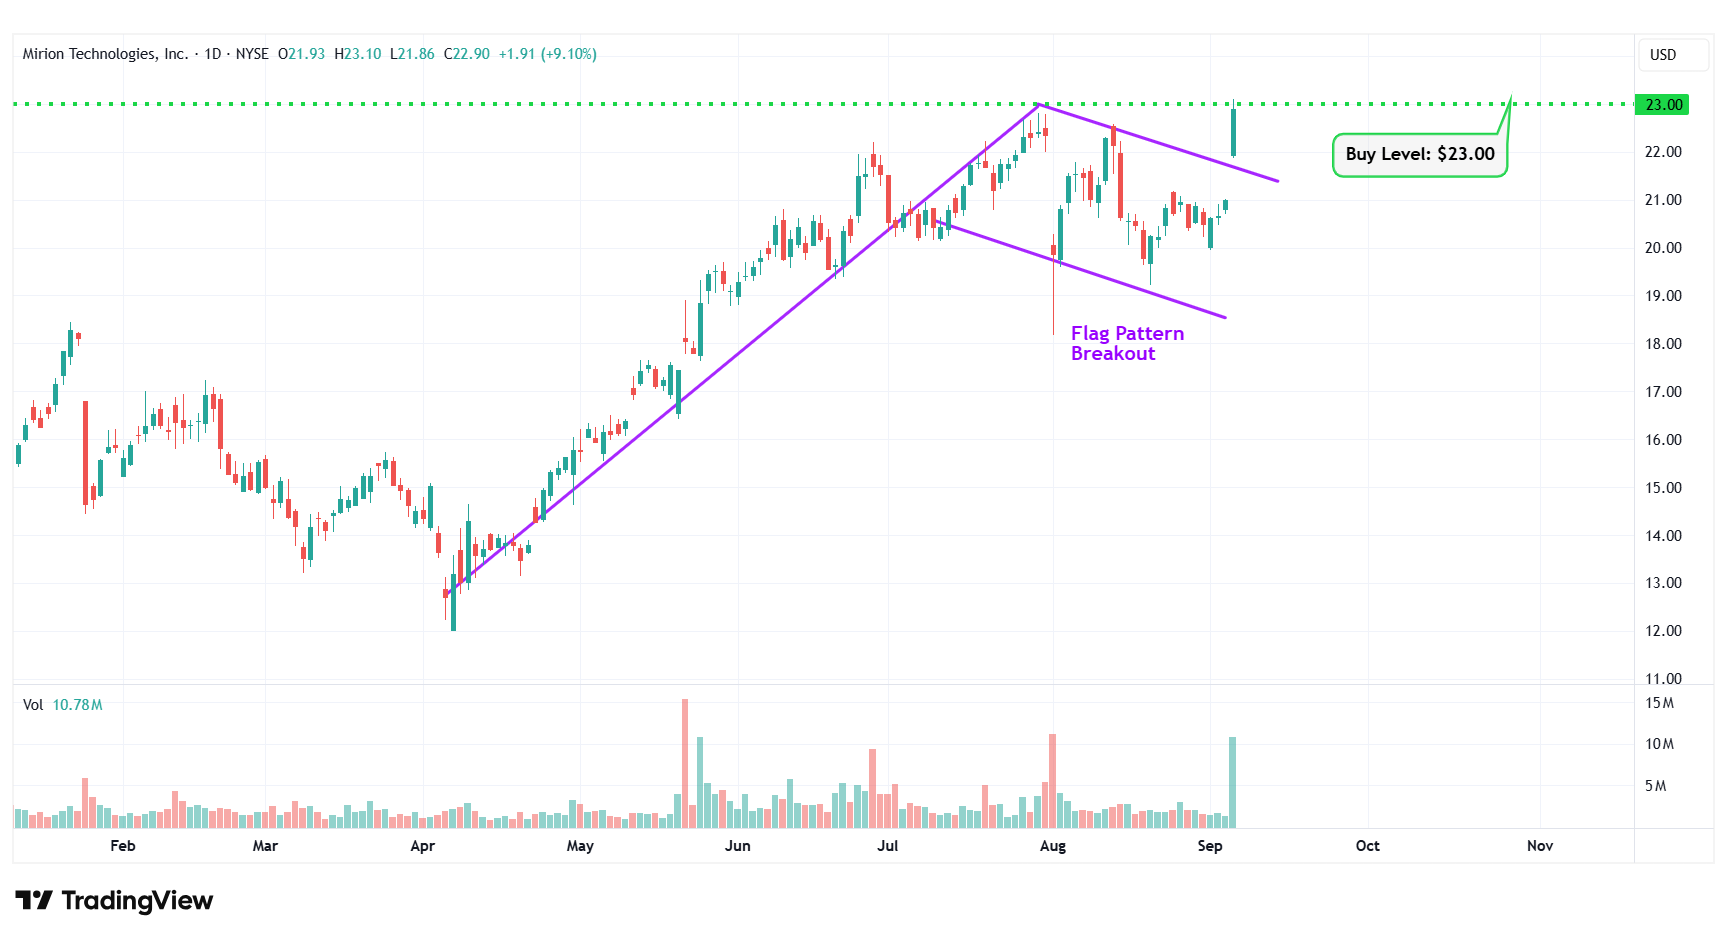
MIR – Flag Pattern Breakout
#5 Rogers Communications Inc. (NYSE: RCI)
Sector: Communication Services • Telecom Services
Reason: Formation of a Symmetrical Triangle Pattern
A symmetrical triangle is a chart pattern formed by two converging trend lines connecting a series of sequential peaks and troughs. These two lines result in the formation of a triangle that appears to be symmetrical.
A symmetrical triangle pattern is usually formed when there is indecision in the price movements and there is uncertainty among the buyers and sellers. This chart pattern represents a period of consolidation before the price breaks out or breaks down. In case a breakout occurs from the upper trend line, it is a strong bullish indication as it signifies the start of a new bullish trend.
Buy Level(s): The ideal buy level for RCI is if the stock has a daily close above the breakout level of the symmetrical triangle pattern, at around $36.20. This is marked in the chart below as a green color dotted line.
Daily chart – RCI
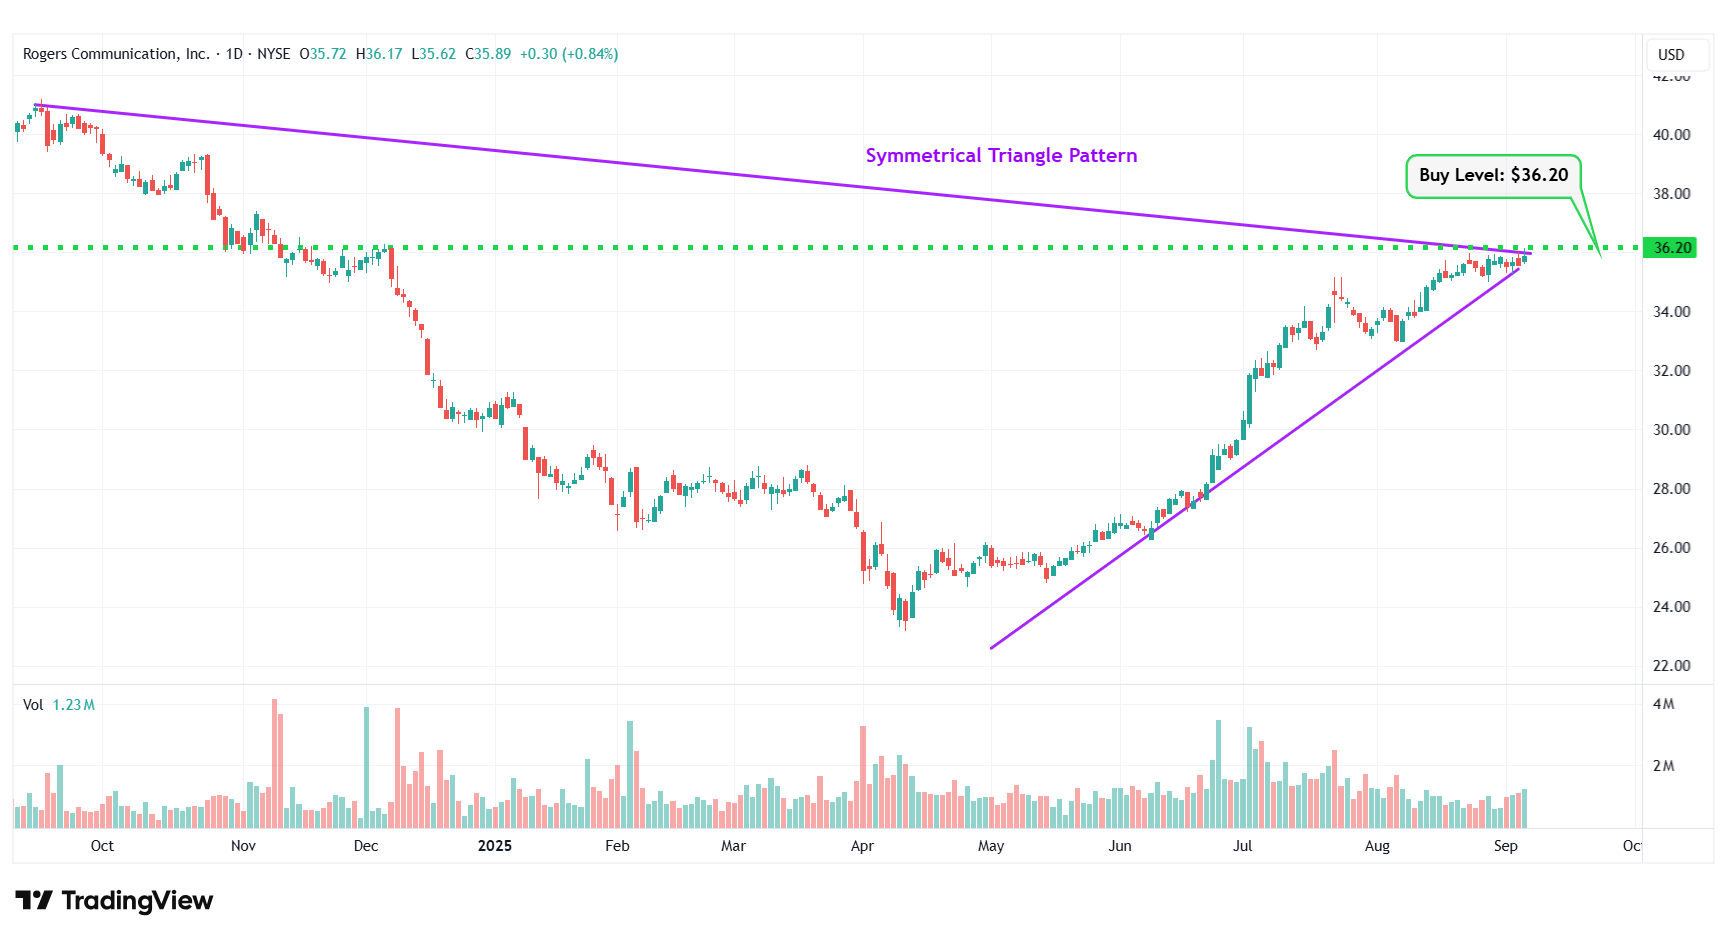
RCI – Symmetrical Triangle Pattern
#6 Structure Therapeutics Inc. ADR (NASDAQ: GPCR)
Sector: Healthcare • Biotechnology
Reason: Symmetrical Triangle Pattern Breakout
A symmetrical triangle is a chart pattern formed by two converging trend lines connecting a series of sequential peaks and troughs. These two lines result in the formation of a triangle that appears to be symmetrical.
A symmetrical triangle pattern is usually formed when there is indecision in the price movements and there is uncertainty among the buyers and sellers. This chart pattern represents a period of consolidation before the price breaks out or breaks down. In case a breakout occurs from the upper trend line, it is a strong bullish indication as it signifies the start of a new bullish trend.
Buy Level(s): The stock has currently broken out of a symmetrical triangle pattern. However, the ideal buy level for GPCR is if the stock closes above the immediate resistance level of $22.50. This is marked in the chart below as a green color dotted line.
Daily chart – GPCR
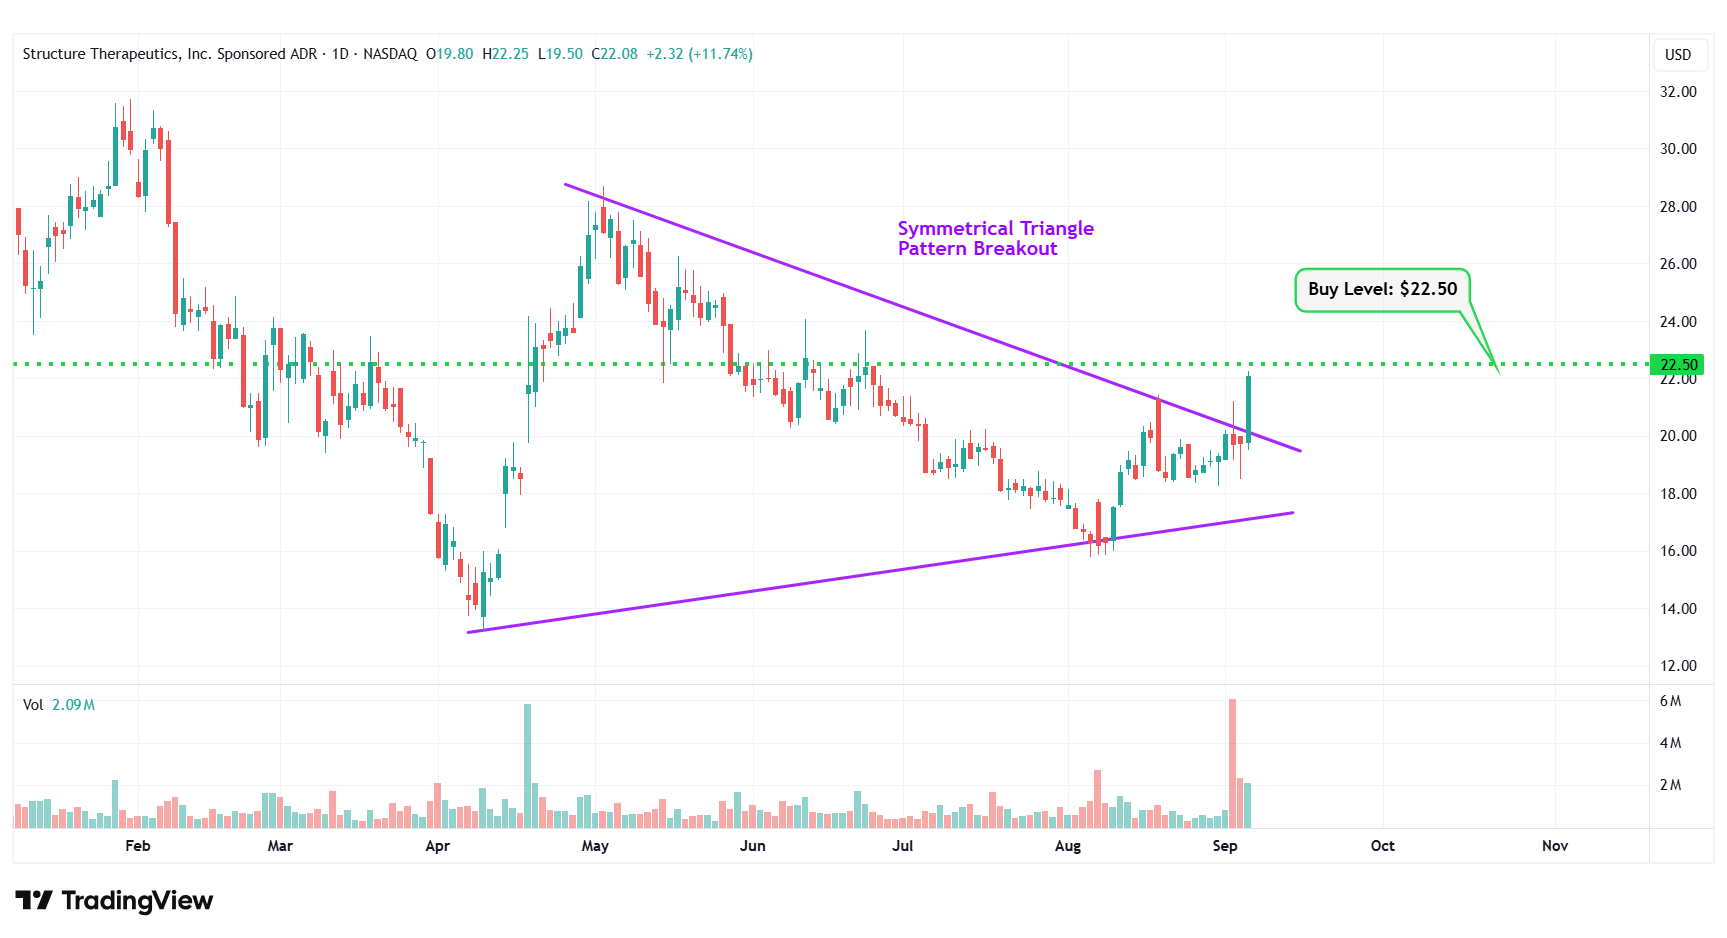
GPCR – Symmetrical Triangle Pattern Breakout
#7 QXO Inc. (NYSE: QXO)
Sector: Industrials • Industrial Distribution
Reason: Breakout From a Flag Pattern
A flag pattern is a short-term continuation pattern that marks a small consolidation before the previous move resumes. The pattern is formed when the market consolidates in a narrow range after a sharp move. For a stock in an uptrend, a breakout from this pattern is typically a strong bullish indication.
Buy Level(s): Although the stock has currently broken out of the flag pattern, the ideal buy level for QXO is above the near-term resistance level of $22.30. This is marked in the chart below as a green color dotted line.
Daily chart – QXO
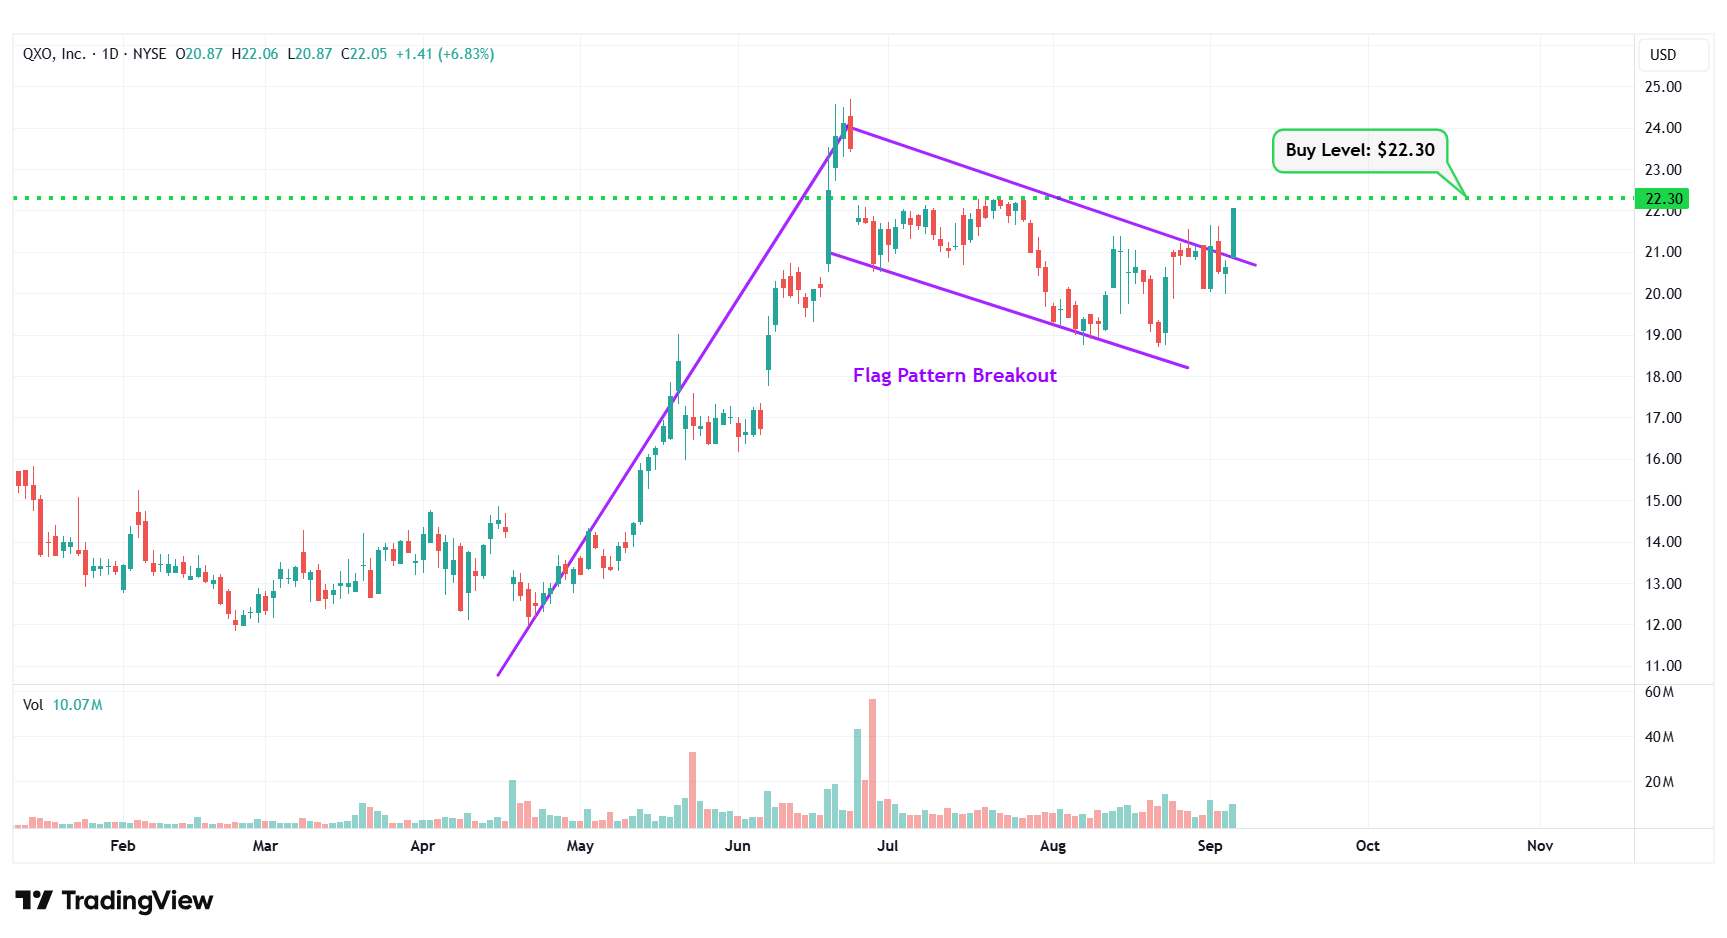
QXO – Flag Pattern Breakout
#8 AGNC Investment Corp. (NASDAQ: AGNC)
Sector: Real Estate • REIT – Mortgage
Reason: Symmetrical Triangle Pattern Breakout
A symmetrical triangle is a chart pattern formed by two converging trend lines connecting a series of sequential peaks and troughs. These two lines result in the formation of a triangle that appears to be symmetrical.
A symmetrical triangle pattern is usually formed when there is indecision in the price movements and there is uncertainty among the buyers and sellers. This chart pattern represents a period of consolidation before the price breaks out or breaks down. In case a breakout occurs from the upper trend line, it is a strong bullish indication as it signifies the start of a new bullish trend.
Buy Level(s): The stock has currently broken out of a symmetrical triangle pattern. However, the ideal buy level for AGNC is if the stock closes above the immediate resistance level of $10.50. This is marked in the chart below as a green color dotted line.
Daily chart – AGNC
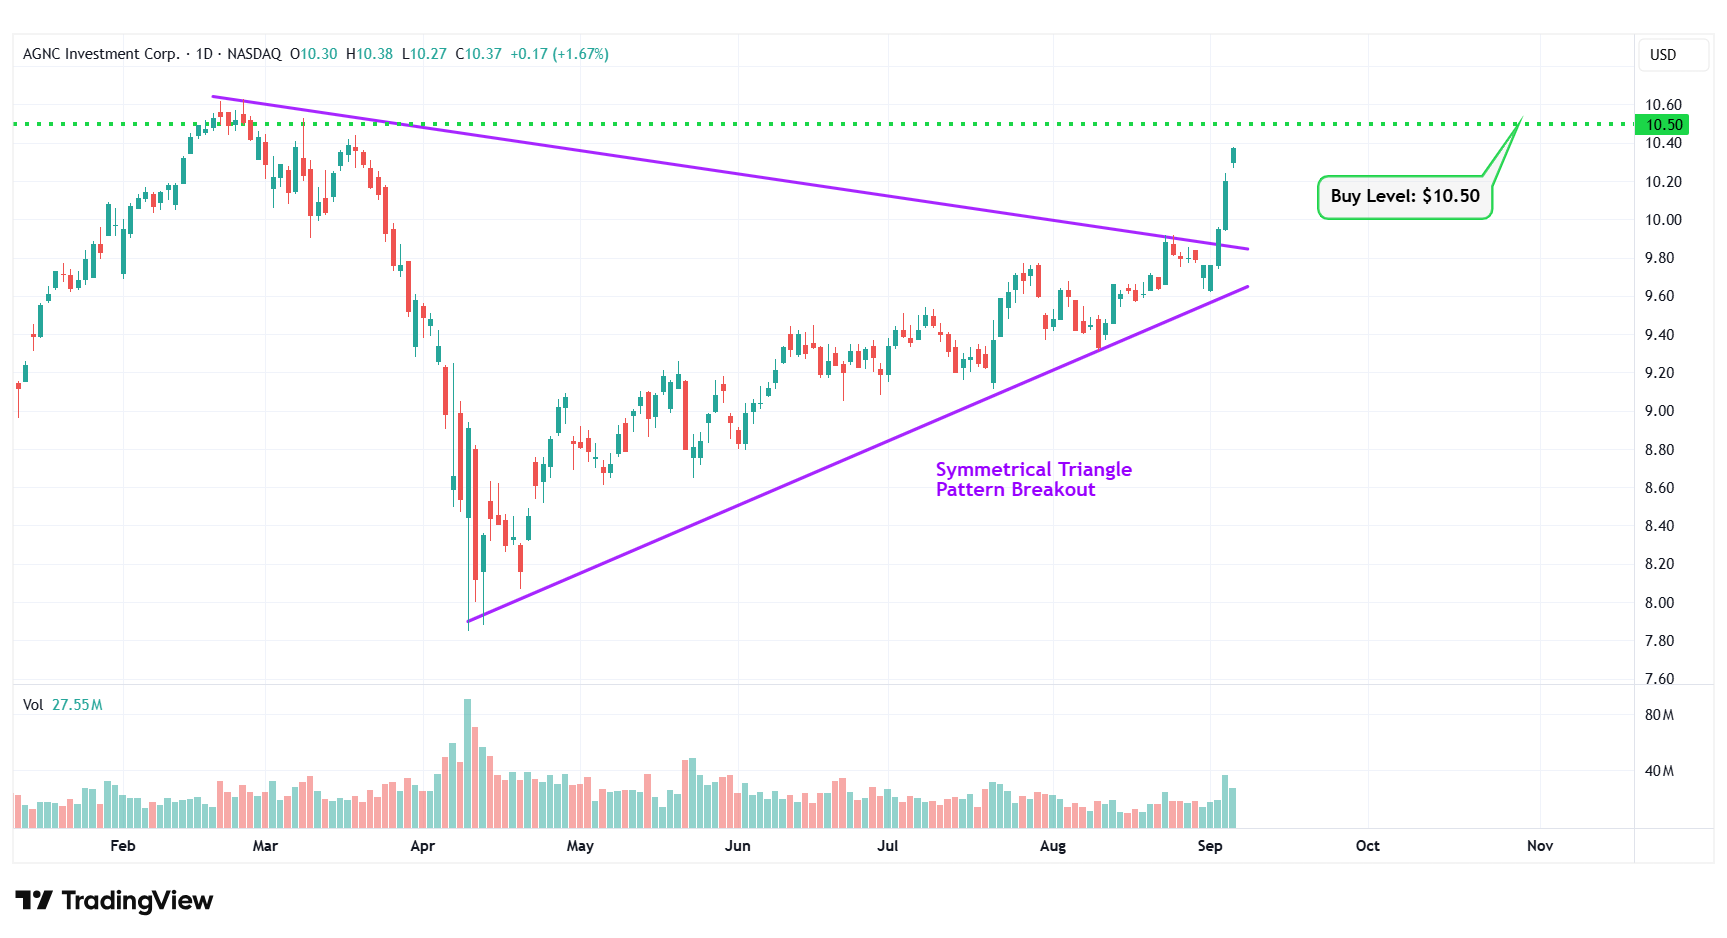
AGNC – Symmetrical Triangle Pattern Breakout
#9 Peabody Energy Corp (NYSE: BTU)
Sector: Energy • Thermal Coal
Reason: Symmetrical Triangle Pattern Breakout
A symmetrical triangle is a chart pattern formed by two converging trend lines connecting a series of sequential peaks and troughs. These two lines result in the formation of a triangle that appears to be symmetrical.
A symmetrical triangle pattern is usually formed when there is indecision in the price movements and there is uncertainty among the buyers and sellers. This chart pattern represents a period of consolidation before the price breaks out or breaks down. In case a breakout occurs from the upper trend line, it is a strong bullish indication as it signifies the start of a new bullish trend.
Buy Level(s): The stock has currently broken out of a symmetrical triangle pattern. However, the ideal buy level for BTU is if the stock closes above the immediate resistance level of $19.40. This is marked in the chart below as a green color dotted line.
Daily chart – BTU
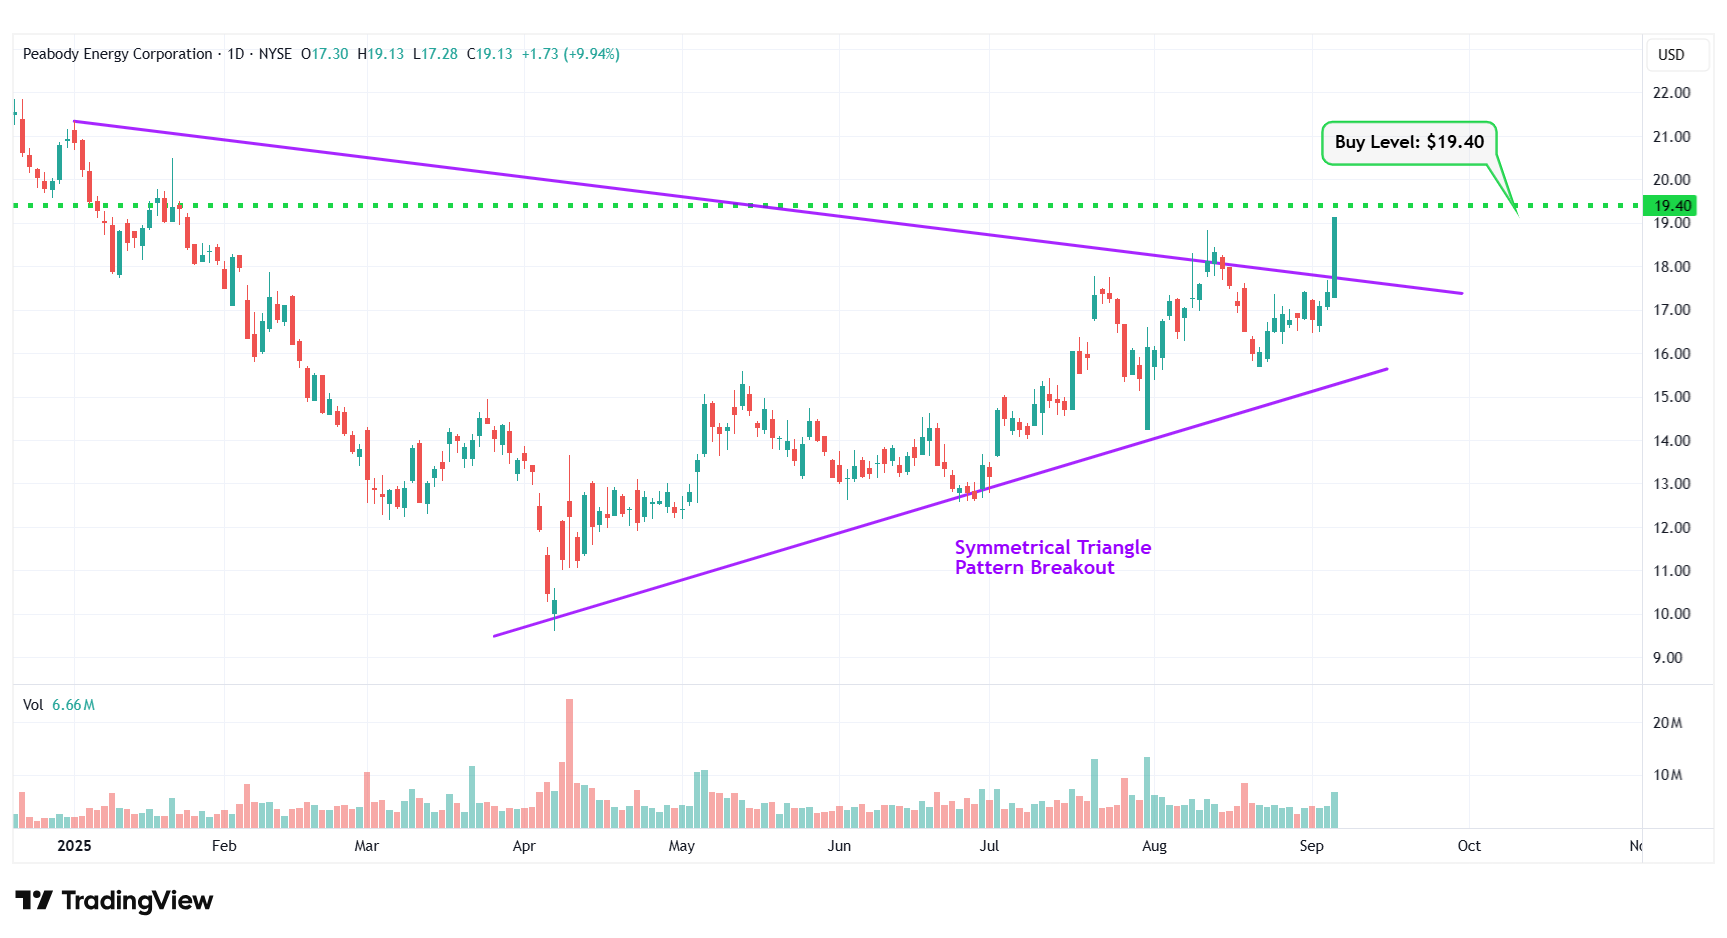
BTU – Symmetrical Triangle Pattern Breakout
#10 Galaxy Digital Inc. (NASDAQ: GLXY)
Sector: Financial • Capital Markets
Reason: Formation of a Symmetrical Triangle Pattern
A symmetrical triangle is a chart pattern formed by two converging trend lines connecting a series of sequential peaks and troughs. These two lines result in the formation of a triangle that appears to be symmetrical.
A symmetrical triangle pattern is usually formed when there is indecision in the price movements and there is uncertainty among the buyers and sellers. This chart pattern represents a period of consolidation before the price breaks out or breaks down. In case a breakout occurs from the upper trend line, it is a strong bullish indication as it signifies the start of a new bullish trend.
Buy Level(s): The ideal buy level for GLXY is if the stock has a daily close above the breakout level of the symmetrical triangle pattern, at around $24.70. This is marked in the chart below as a green color dotted line.
Daily chart – GLXY
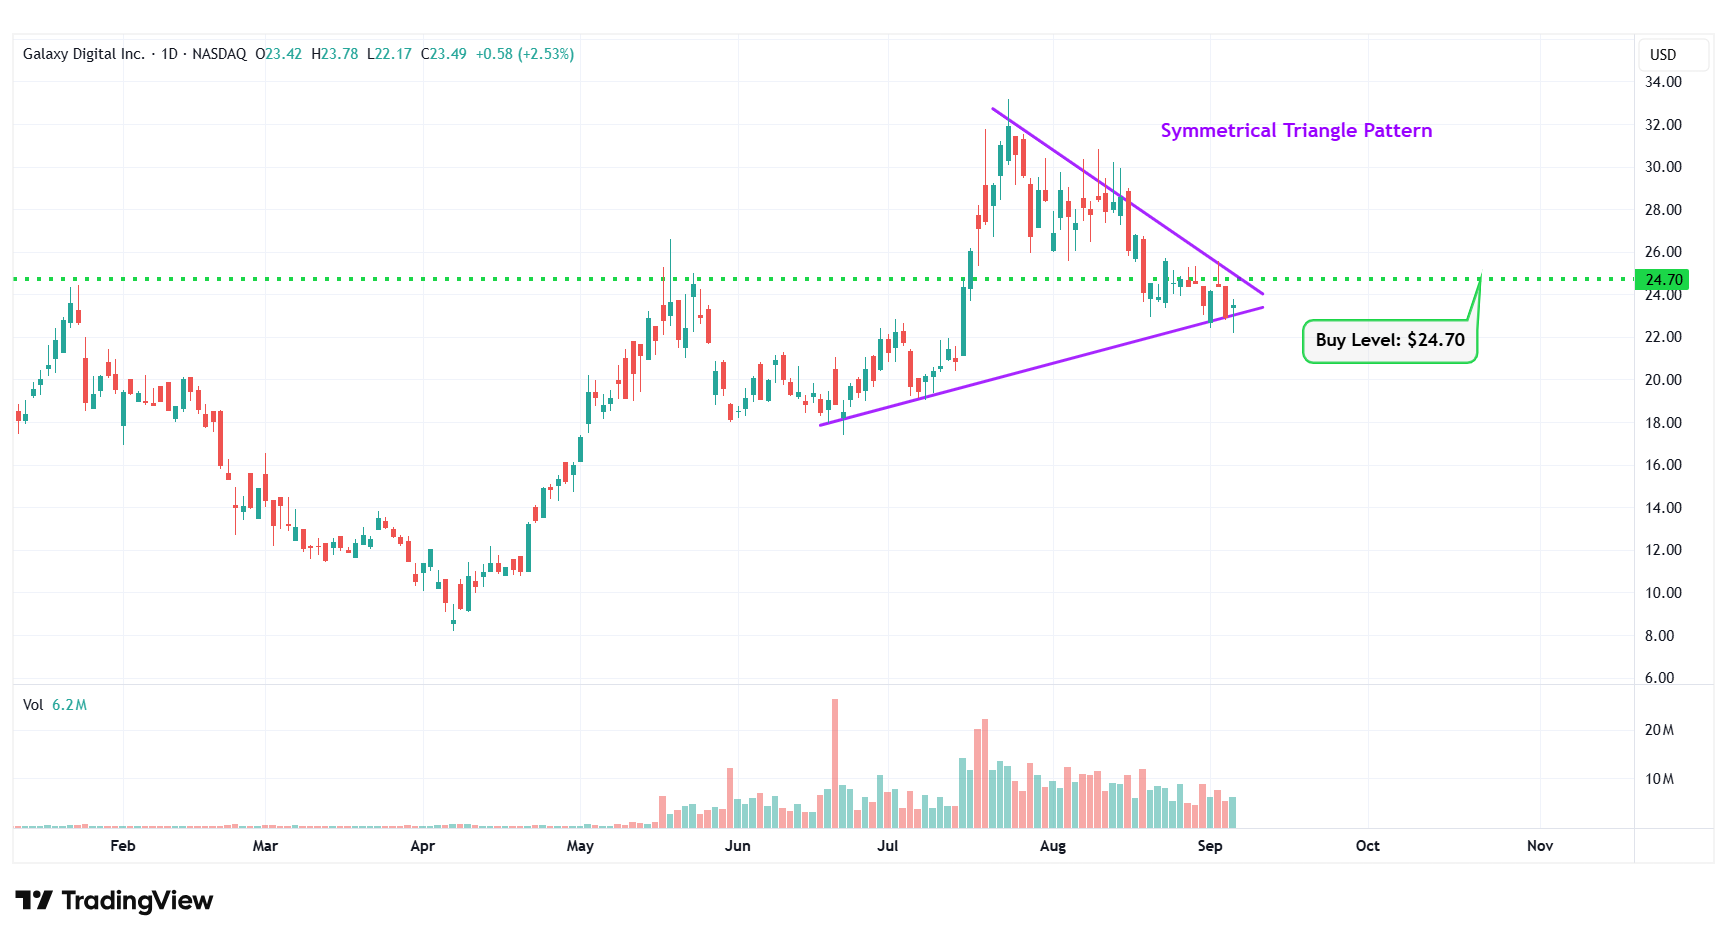
GLXY – Symmetrical Triangle Pattern
Happy Trading!
Trades of The Day Research Team
Legendary fund manager Louis Navellier – a man Forbes calls "the king of quants" – is going "ALL-IN" on this game-changing AI technology. He says, "This is the culmination of everything you've been reading about AI for the last 60 years."Get the details...
Source: Trades of the Day
