Picking a winning trade on a consistent basis is not simply a stroke of luck. It’s the result of calculated screening, planning, and deliberation.
With this in mind, we have started a new weekly series on our top 10 stocks to watch this week — stocks that look poised for a possible breakout in the coming days. Traders should add these stocks to their watchlist now.
The Top 10 Stocks to Watch This Week for Possible Breakouts
| Sl # | Name of the Stock | Stock Ticker | Last Close | Buy Level(s) | Reason |
| 1 | BitMine Immersion Technologies Inc. | AMEX: BMNR | $51.43 | $53.70 | Symmetrical Triangle Pattern Breakout |
| 2 | Hecla Mining Co. | NYSE: HL | $7.60 | $7.70 | Breakout From Consolidation Area |
| 3 | SoundHound AI Inc. | NASDAQ: SOUN | $13.55 | $14.00 | Symmetrical Triangle Pattern Breakout |
| 4 | Micron Technology Inc. | NASDAQ: MU | $118.89 | $120.30 | Flag Pattern Breakout |
| 5 | LegalZoom.com Inc. | NASDAQ: LZ | $10.98 | $11.10 | Symmetrical Triangle Pattern Breakout |
| 6 | Sotera Health Co. | NASDAQ: SHC | $13.97 | $14.10 | Downtrend Channel Breakout |
| 7 | Doximity Inc. | NYSE: DOCS | $66.58 | $66.70 | Symmetrical Triangle Pattern Breakout |
| 8 | GigaCloud Technology Inc. | NASDAQ: GCT | $28.90 | $29.40 | Symmetrical Triangle Pattern Breakout |
| 9 | Peloton Interactive Inc. | NASDAQ: PTON | $7.84 | $8.00 | Symmetrical Triangle Pattern Breakout |
| 10 | SkyWater Technology Inc. | NASDAQ: SKYT | $14.08 | $14.55 | Symmetrical Triangle Pattern Breakout |
Important: Typically, these trades offer a risk: reward ratio of 1:2 or 1:3 in the next 6 months, which implies 2x to 3x rewards when compared to risks. So, be sure to set your stop-loss levels and target prices accordingly to manage your risk. In addition, these trade ideas are triggered using daily closing prices, not intra-day pricing. So, if you participate in these trades, make sure that you only buy the stock once its daily close is above the recommended price level.
That said, here are the top 10 stocks to watch for a breakout, in no particular order.
#1 BitMine Immersion Technologies Inc. (AMEX: BMNR)
Sector: Financial • Capital Markets
Reason: Symmetrical Triangle Pattern Breakout
A symmetrical triangle is a chart pattern formed by two converging trend lines connecting a series of sequential peaks and troughs. These two lines result in the formation of a triangle that appears to be symmetrical.
A symmetrical triangle pattern is usually formed when there is indecision in the price movements and there is uncertainty among the buyers and sellers. This chart pattern represents a period of consolidation before the price breaks out or breaks down. In case a breakout occurs from the upper trend line, it is a strong bullish indication as it signifies the start of a new bullish trend.
Buy Level(s): The stock has currently broken out of a symmetrical triangle pattern. However, the ideal buy level for BMNR is if the stock closes above the immediate resistance level of $53.70. This is marked in the chart below as a green color dotted line.
Daily chart – BMNR
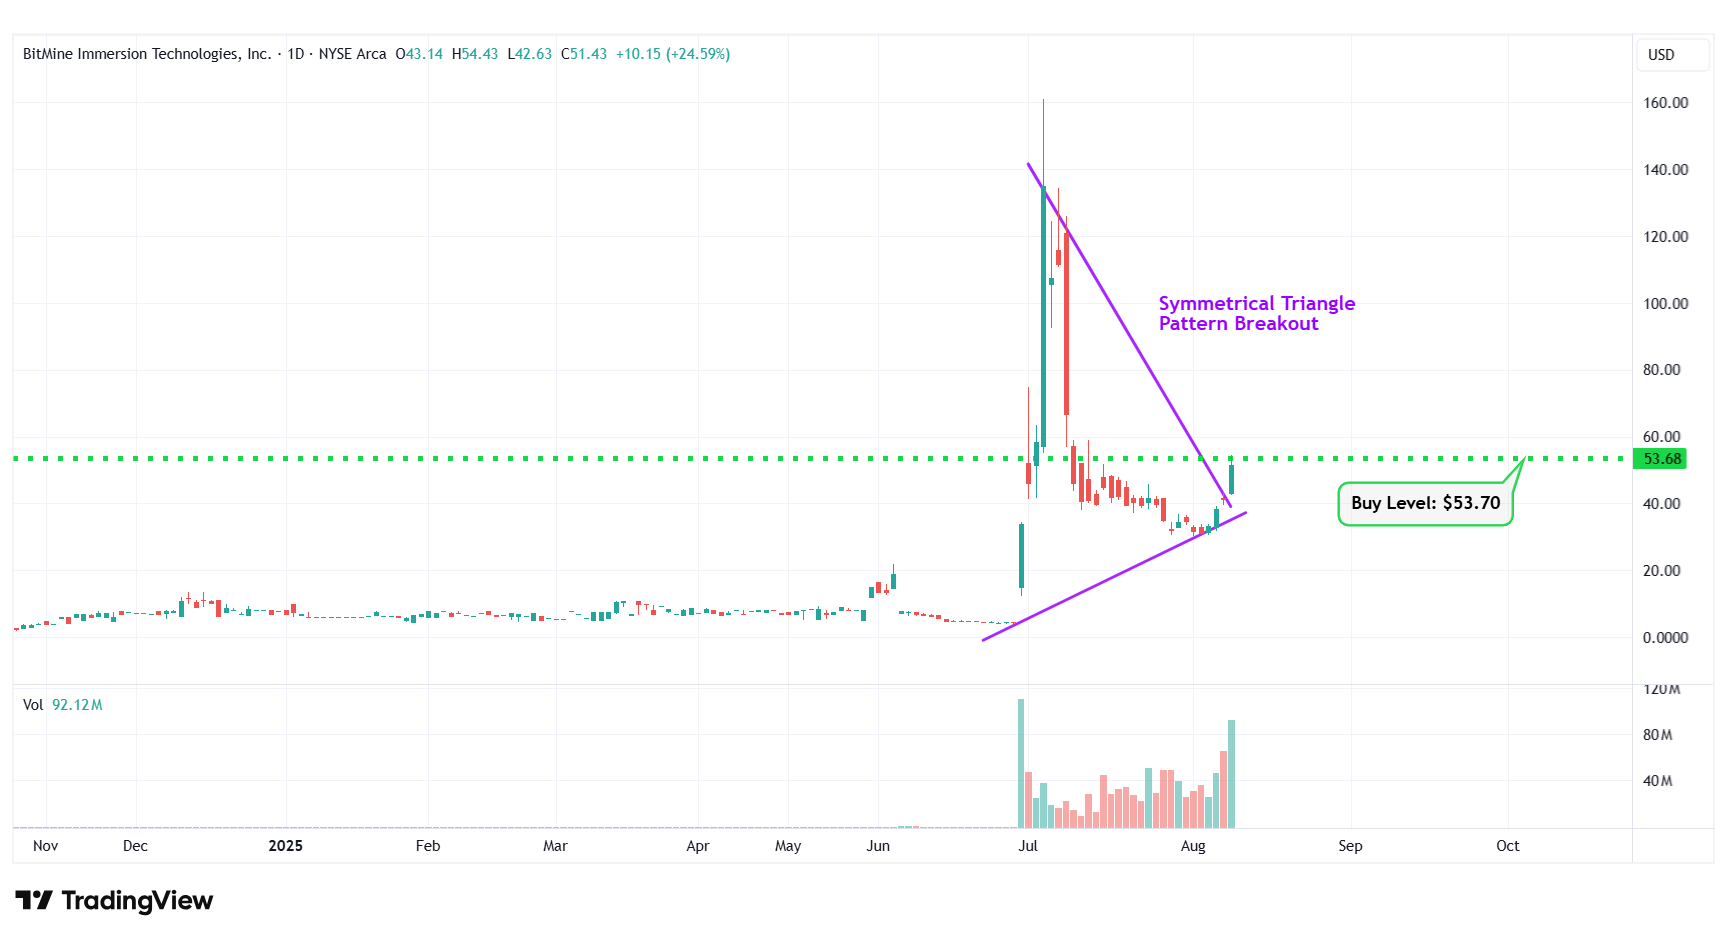
BMNR – Symmetrical Triangle Pattern Breakout
#2 Hecla Mining Co. (NYSE: HL)
Sector: Basic Materials • Other Precious Metals & Mining
Reason: Breakout From a Consolidation Area in the Daily Chart
A Consolidation Area is a price action contained between two parallel lines. It is formed by a lower line that connects the lows, and an upper line that joins the highs. A stock usually trades between the two lines of the consolidation area before finally breaking out from the upper rail.
Buy Level(s): Although the stock has currently broken out of a consolidation area, the ideal buy level for HL is above the near-term resistance area, which translates to a price of around $7.70. This is marked in the chart below as a green color dotted line.
Daily chart – HL
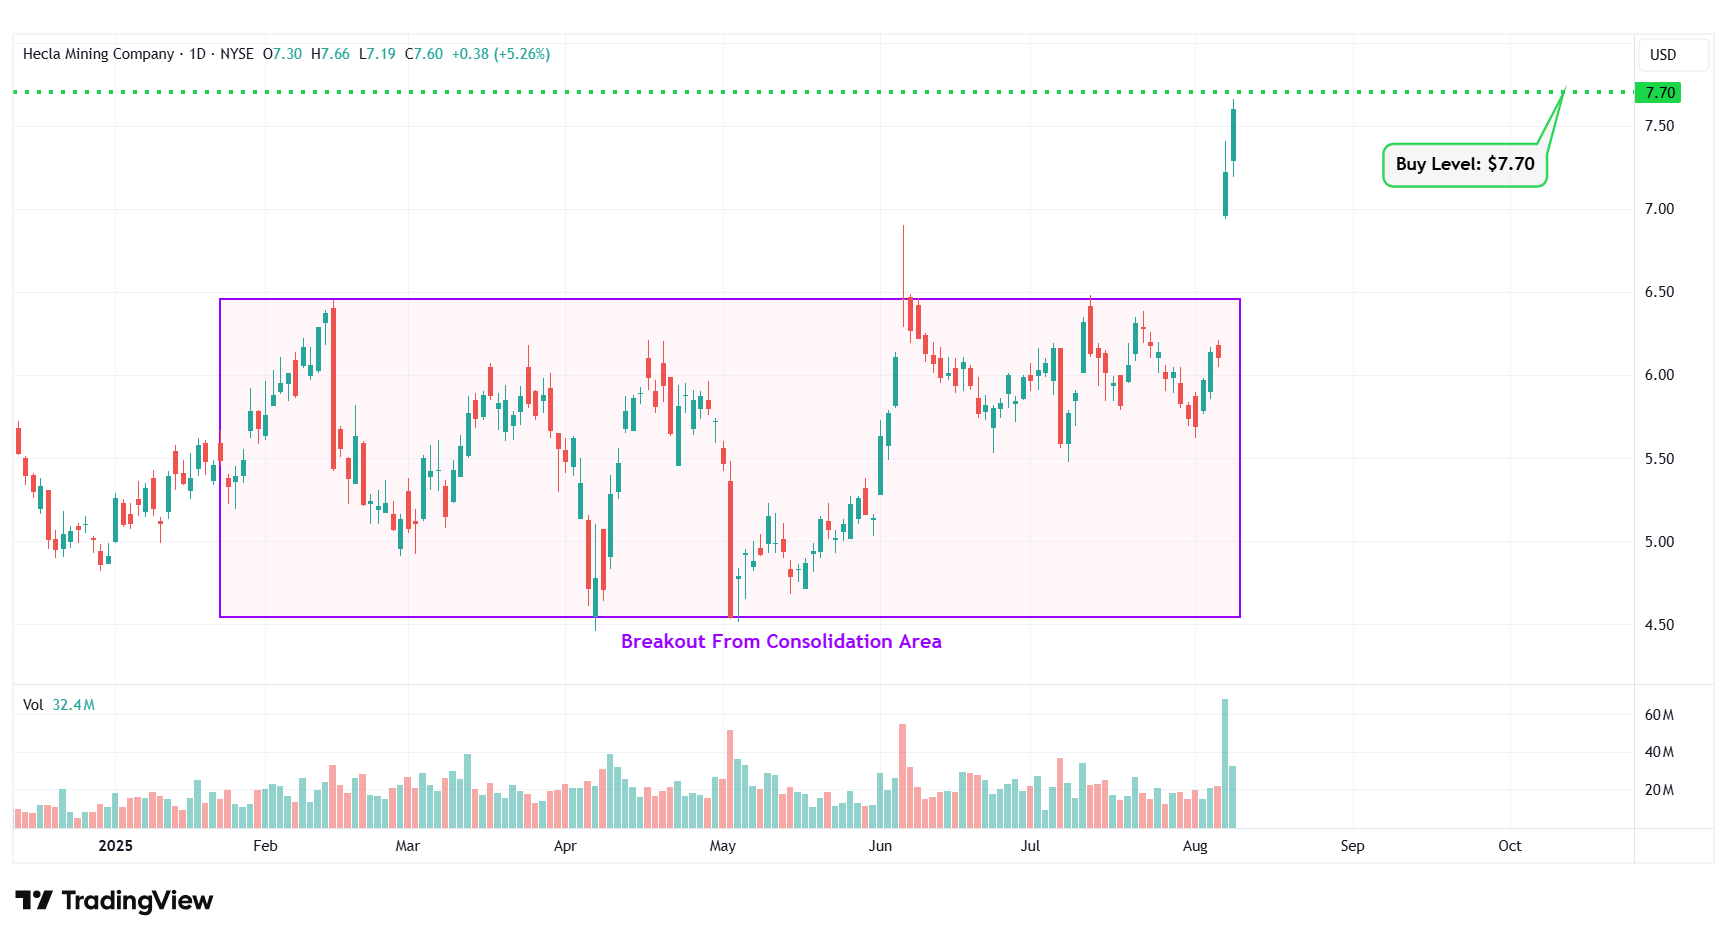
HL – Breakout From Consolidation Area
#3 SoundHound AI Inc. (NASDAQ: SOUN)
Sector: Technology • Software – Application
Reason: Symmetrical Triangle Pattern Breakout
A symmetrical triangle is a chart pattern formed by two converging trend lines connecting a series of sequential peaks and troughs. These two lines result in the formation of a triangle that appears to be symmetrical.
A symmetrical triangle pattern is usually formed when there is indecision in the price movements and there is uncertainty among the buyers and sellers. This chart pattern represents a period of consolidation before the price breaks out or breaks down. In case a breakout occurs from the upper trend line, it is a strong bullish indication as it signifies the start of a new bullish trend.
Buy Level(s): The stock has currently broken out of a symmetrical triangle pattern. However, the ideal buy level for SOUN is if the stock closes above the immediate resistance level of $14.00. This is marked in the chart below as a green color dotted line.
Daily chart – SOUN
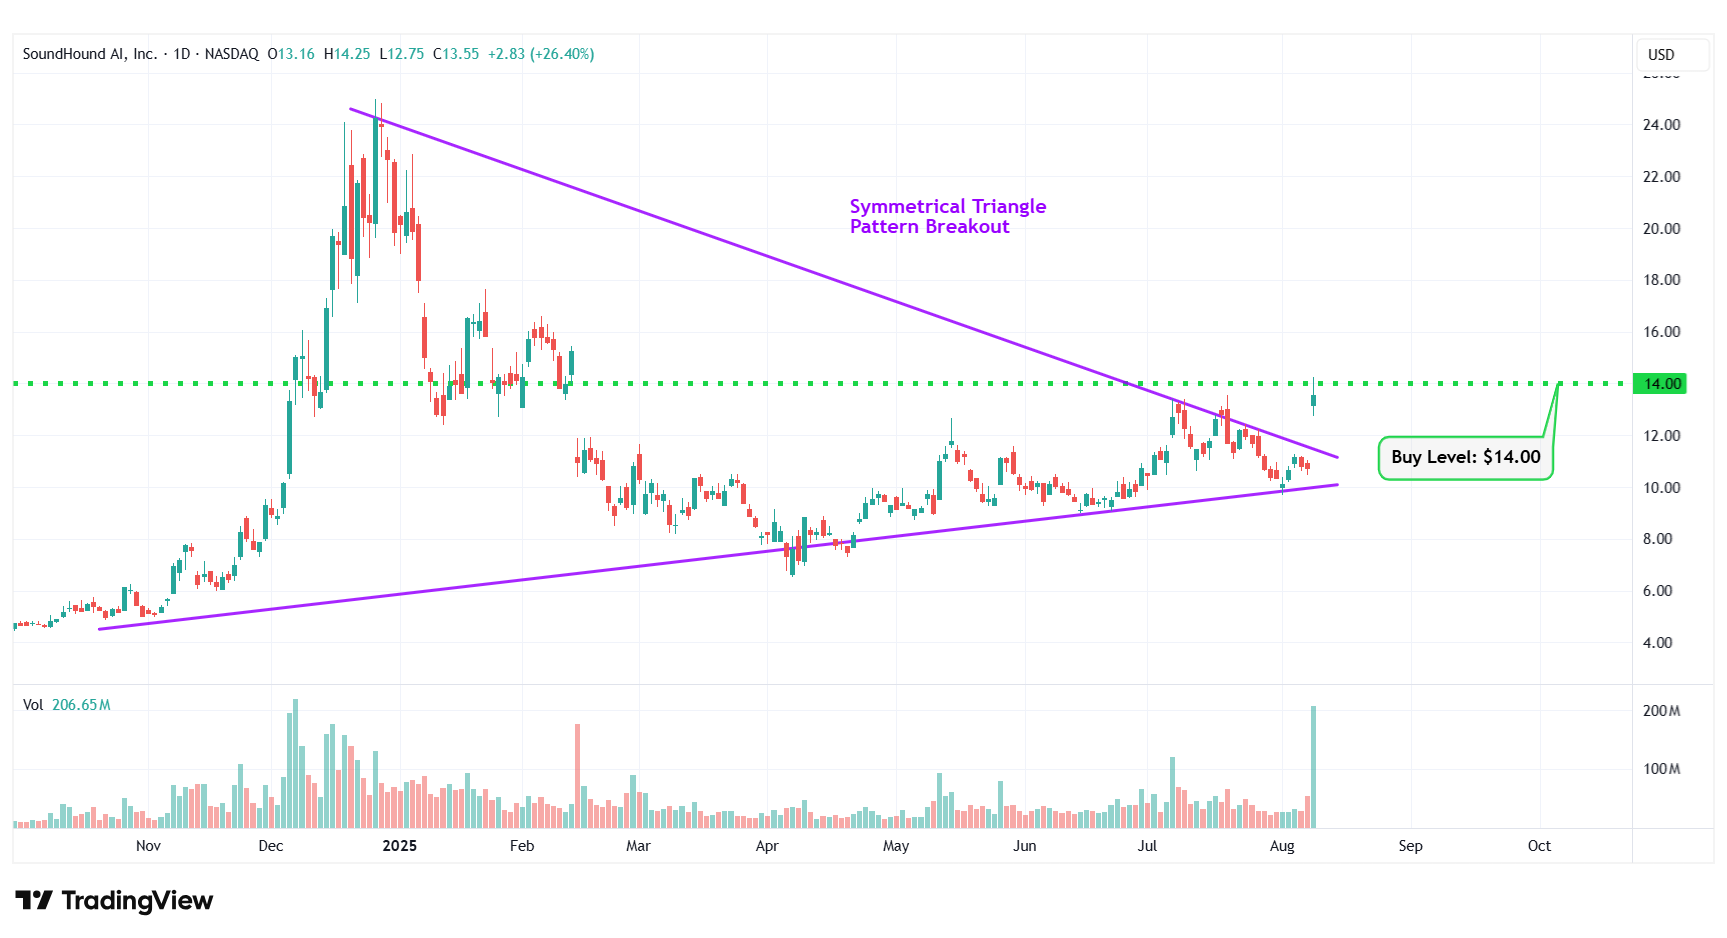
SOUN – Symmetrical Triangle Pattern Breakout
#4 Micron Technology Inc. (NASDAQ: MU)
Sector: Technology • Semiconductors
Reason: Breakout From a Flag Pattern
A flag pattern is a short-term continuation pattern that marks a small consolidation before the previous move resumes. The pattern is formed when the market consolidates in a narrow range after a sharp move. For a stock in an uptrend, a breakout from this pattern is typically a strong bullish indication.
Buy Level(s): Although the stock has currently broken out of the flag pattern, the ideal buy level for MU is above the near-term resistance level of $120.30. This is marked in the chart below as a green color dotted line.
Daily chart – MU
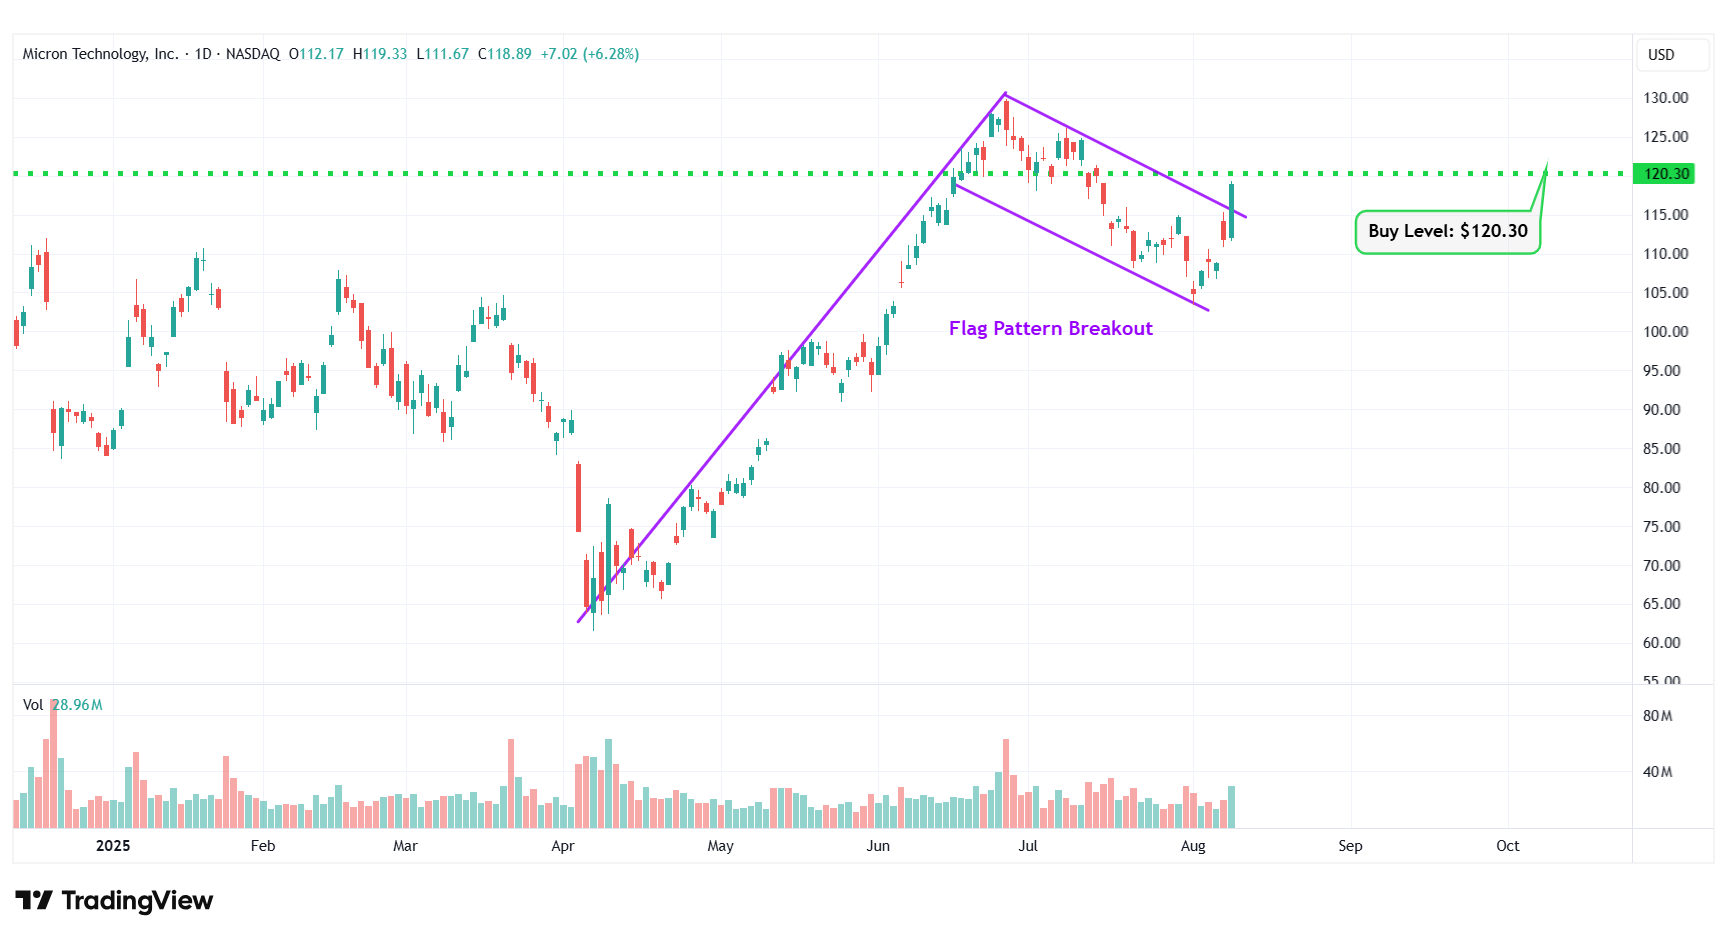
MU – Flag Pattern Breakout
#5 LegalZoom.com Inc. (NASDAQ: LZ)
Sector: Industrials • Specialty Business Services
Reason: Symmetrical Triangle Pattern Breakout
A symmetrical triangle is a chart pattern formed by two converging trend lines connecting a series of sequential peaks and troughs. These two lines result in the formation of a triangle that appears to be symmetrical.
A symmetrical triangle pattern is usually formed when there is indecision in the price movements and there is uncertainty among the buyers and sellers. This chart pattern represents a period of consolidation before the price breaks out or breaks down. In case a breakout occurs from the upper trend line, it is a strong bullish indication as it signifies the start of a new bullish trend.
Buy Level(s): The stock has currently broken out of a symmetrical triangle pattern. However, the ideal buy level for LZ is if the stock closes above the immediate resistance level of $11.10. This is marked in the chart below as a green color dotted line.
Daily chart – LZ
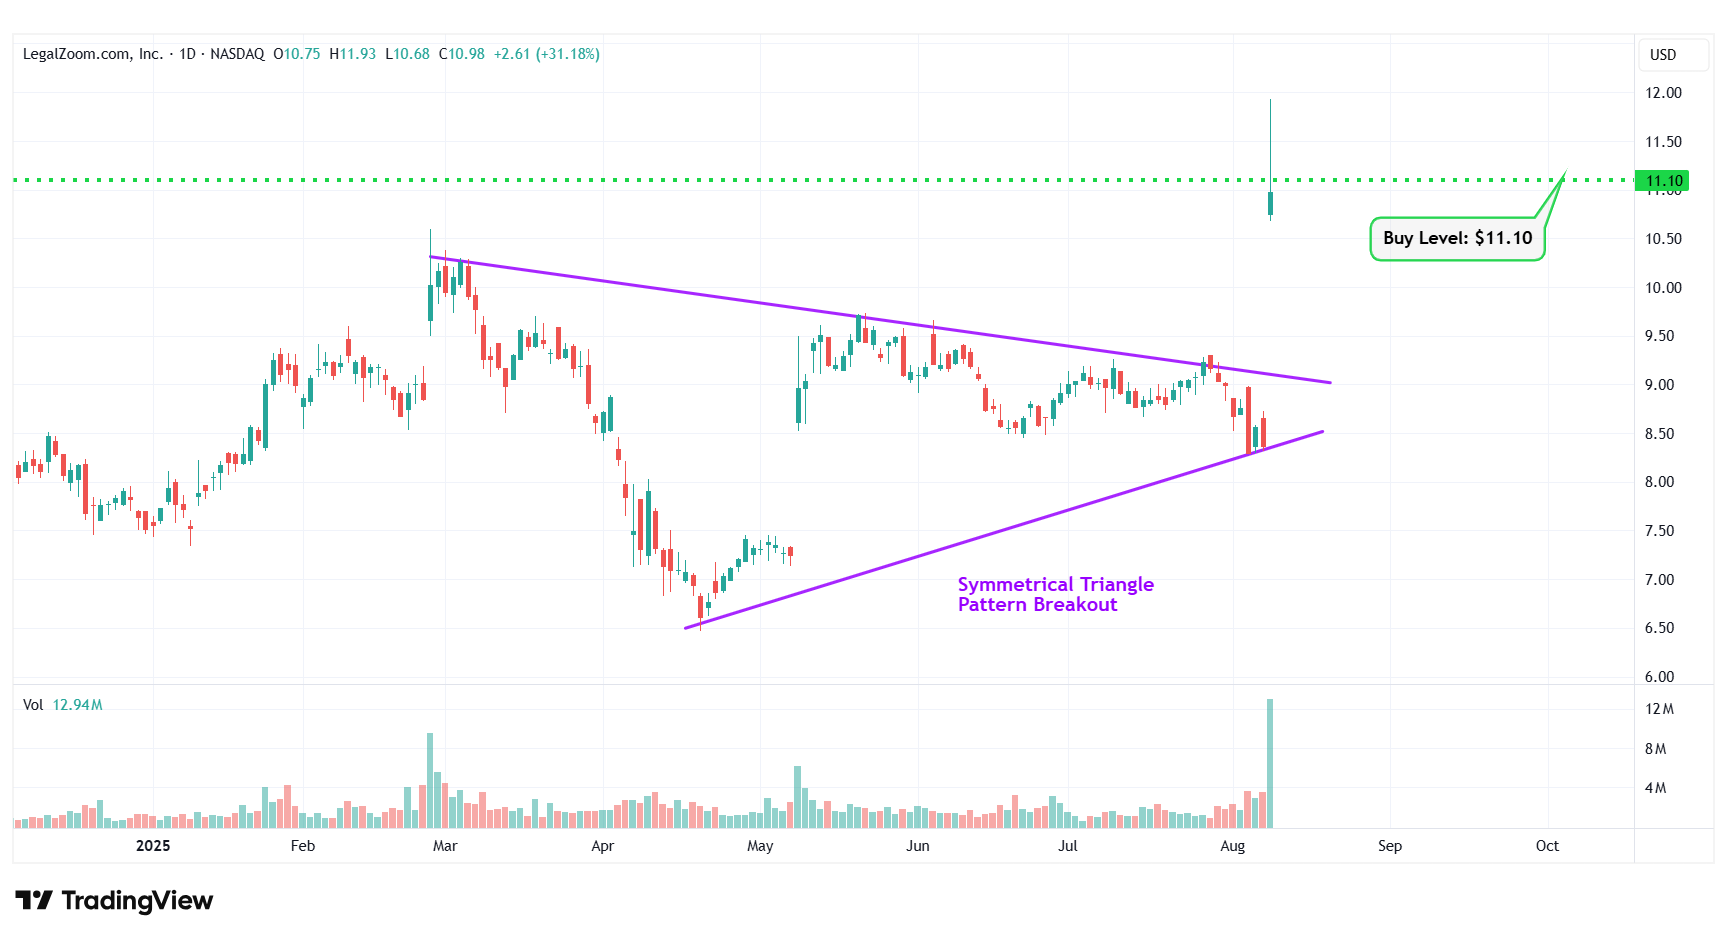
LZ – Symmetrical Triangle Pattern Breakout
#6 Sotera Health Co. (NASDAQ: SHC)
Sector: Healthcare • Diagnostics & Research
Reason: Downtrend Channel Breakout
A downtrend or descending channel is the price action contained between downward sloping parallel lines. It is formed by two lines that are drawn by connecting the lower highs and lower lows of a stock’s price. Even though this is typically a bearish pattern, a breakout from the upper rail of this pattern is considered a good bullish indication.
Buy Level(s): The daily chart shows that the stock has currently broken out of a downtrend channel. However, there is a near-term resistance level for the stock. Hence, the ideal buy level for SHC is if the stock has a daily close above $14.10. This is marked in the chart below as a green color dotted line.
Daily chart – SHC
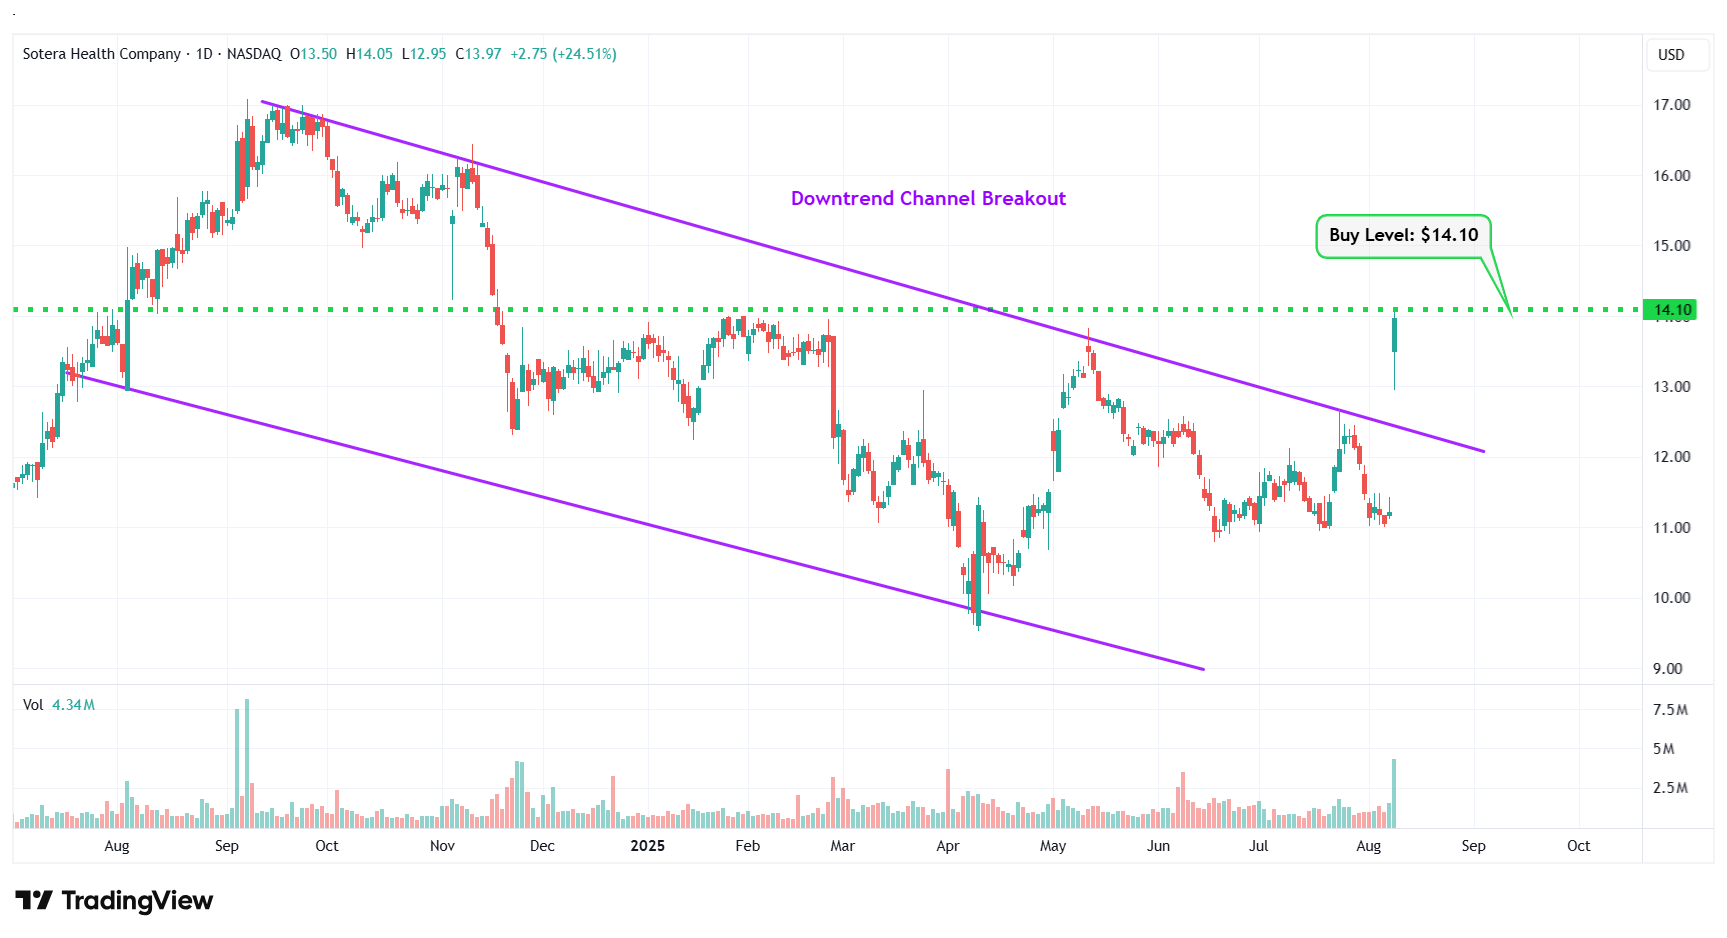
SHC – Downtrend Channel Breakout
#7 Doximity Inc. (NYSE: DOCS)
Sector: Healthcare • Health Information Services
Reason: Symmetrical Triangle Pattern Breakout
A symmetrical triangle is a chart pattern formed by two converging trend lines connecting a series of sequential peaks and troughs. These two lines result in the formation of a triangle that appears to be symmetrical.
A symmetrical triangle pattern is usually formed when there is indecision in the price movements and there is uncertainty among the buyers and sellers. This chart pattern represents a period of consolidation before the price breaks out or breaks down. In case a breakout occurs from the upper trend line, it is a strong bullish indication as it signifies the start of a new bullish trend.
Buy Level(s): The stock has currently broken out of a symmetrical triangle pattern. However, the ideal buy level for DOCS is if the stock closes above the immediate resistance level of $66.70. This is marked in the chart below as a green color dotted line.
Daily chart – DOCS
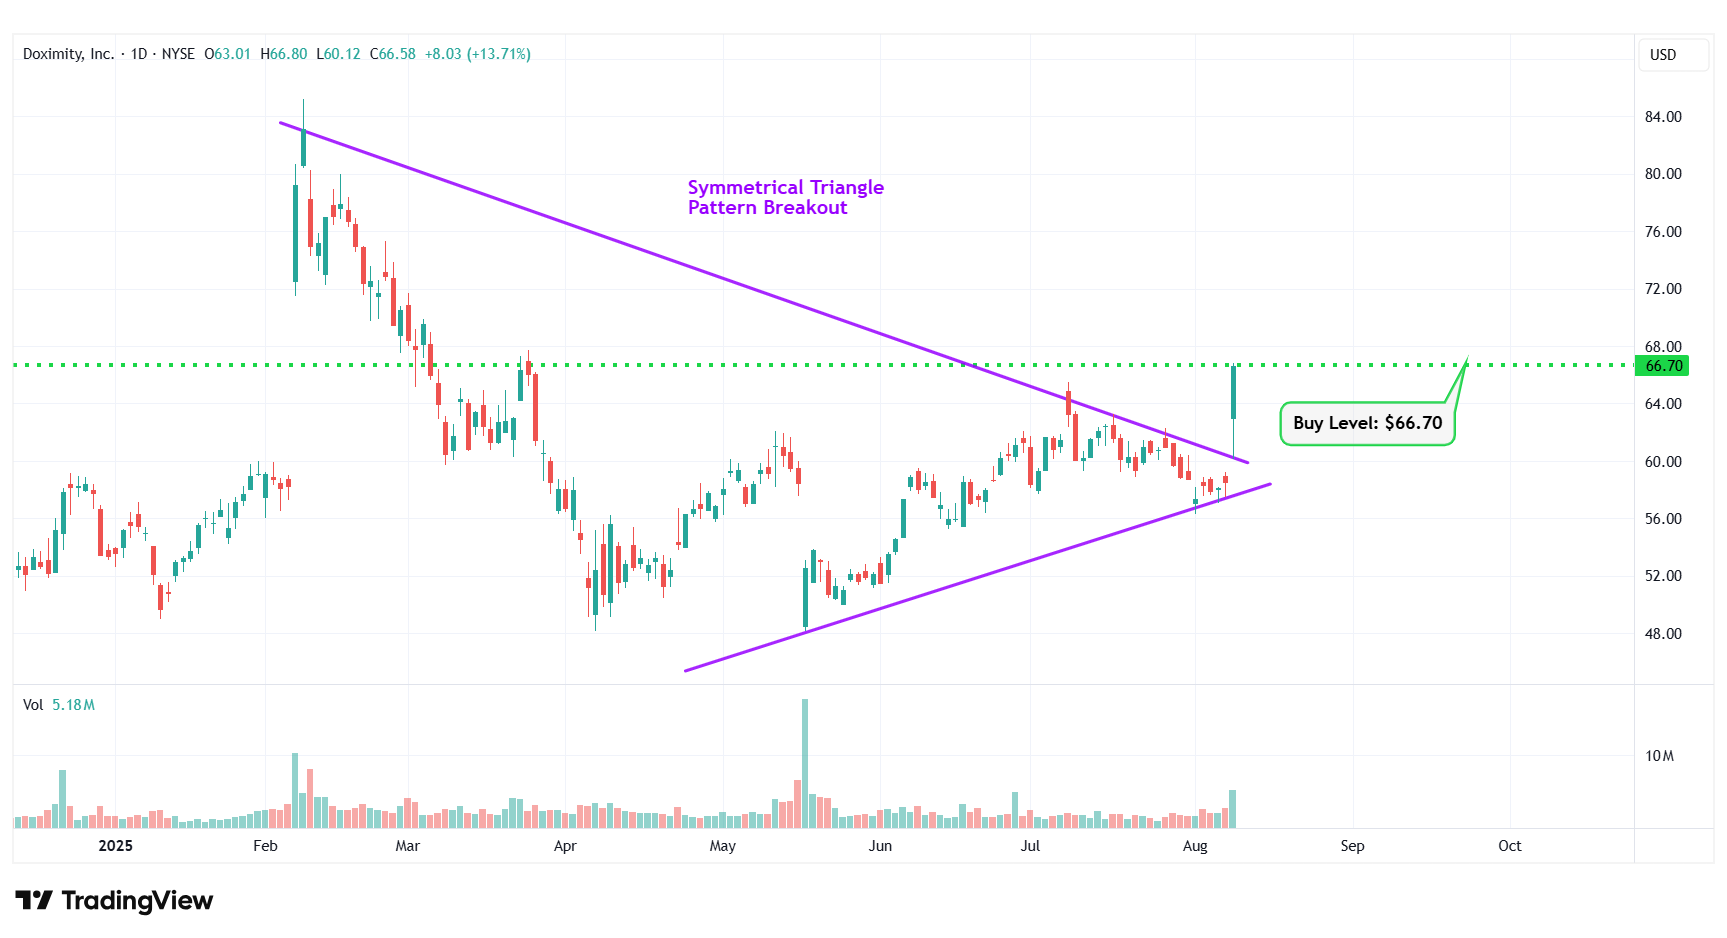
DOCS – Symmetrical Triangle Pattern Breakout
#8 GigaCloud Technology Inc. (NASDAQ: GCT)
Sector: Technology • Software – Infrastructure
Reason: Symmetrical Triangle Pattern Breakout
A symmetrical triangle is a chart pattern formed by two converging trend lines connecting a series of sequential peaks and troughs. These two lines result in the formation of a triangle that appears to be symmetrical.
A symmetrical triangle pattern is usually formed when there is indecision in the price movements and there is uncertainty among the buyers and sellers. This chart pattern represents a period of consolidation before the price breaks out or breaks down. In case a breakout occurs from the upper trend line, it is a strong bullish indication as it signifies the start of a new bullish trend.
Buy Level(s): The stock has currently broken out of a symmetrical triangle pattern. However, the ideal buy level for GCT is if the stock closes above the immediate resistance level of $29.40. This is marked in the chart below as a green color dotted line.
Daily chart – GCT
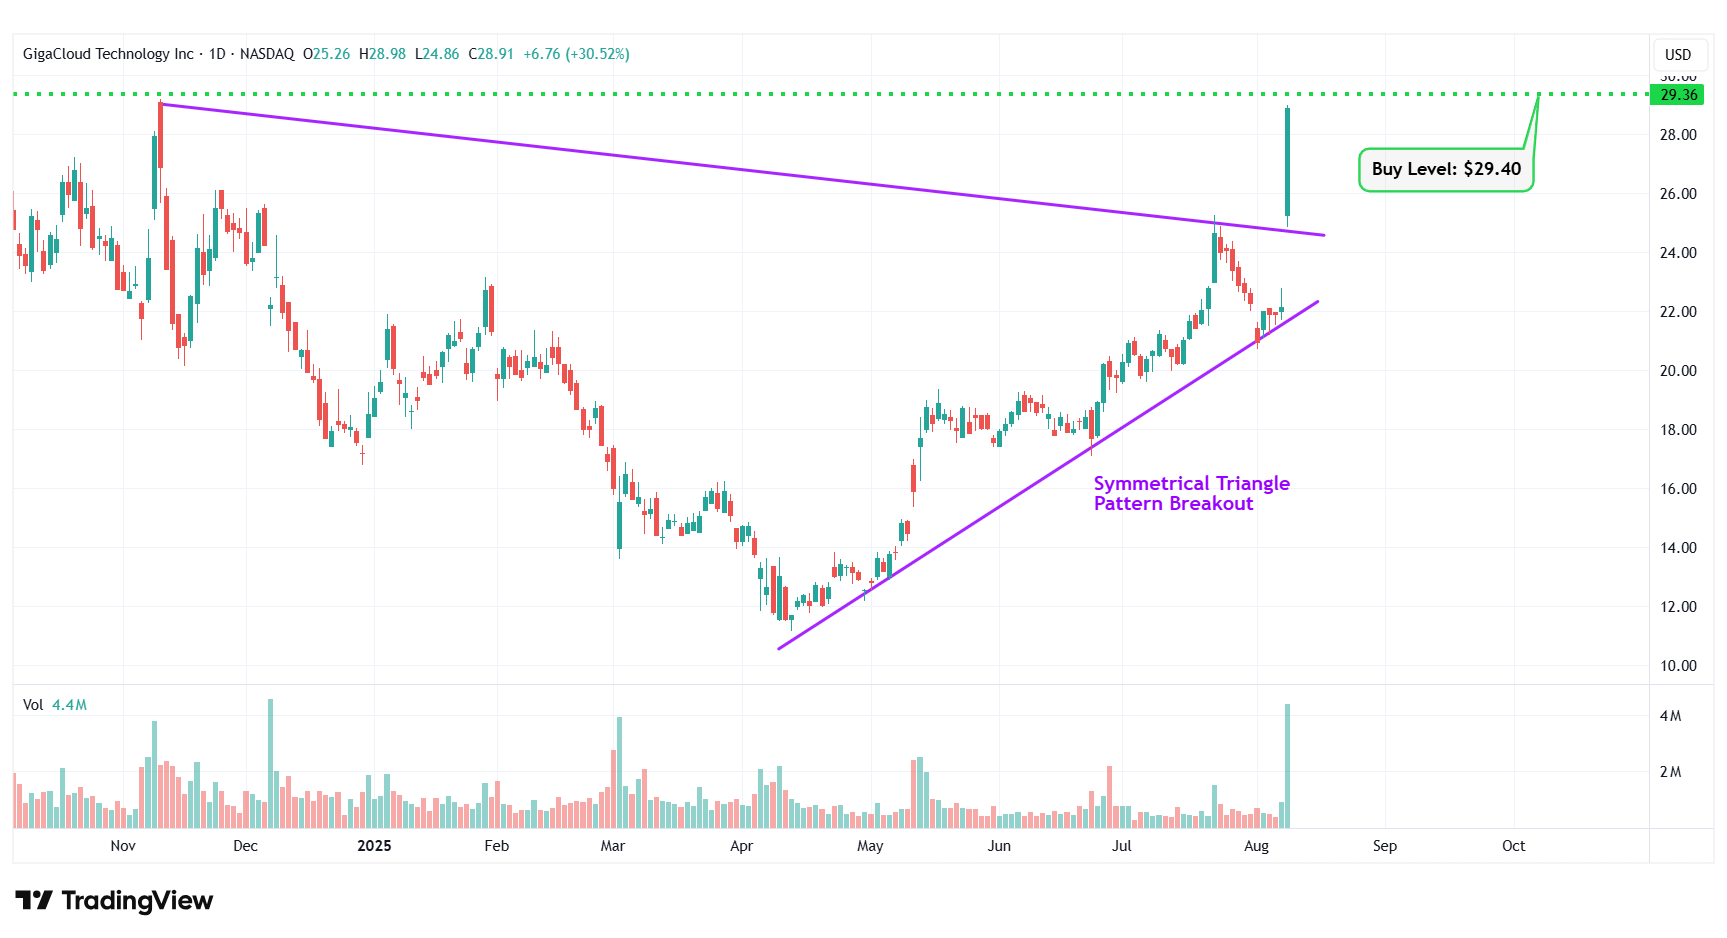
GCT – Symmetrical Triangle Pattern Breakout
#9 Peloton Interactive Inc. (NASDAQ: PTON)
Sector: Consumer Cyclical • Leisure
Reason: Symmetrical Triangle Pattern Breakout
A symmetrical triangle is a chart pattern formed by two converging trend lines connecting a series of sequential peaks and troughs. These two lines result in the formation of a triangle that appears to be symmetrical.
A symmetrical triangle pattern is usually formed when there is indecision in the price movements and there is uncertainty among the buyers and sellers. This chart pattern represents a period of consolidation before the price breaks out or breaks down. In case a breakout occurs from the upper trend line, it is a strong bullish indication as it signifies the start of a new bullish trend.
Buy Level(s): The stock has currently broken out of a symmetrical triangle pattern. However, the ideal buy level for PTON is if the stock closes above the immediate resistance level of $8.00. This is marked in the chart below as a green color dotted line.
Daily chart – PTON
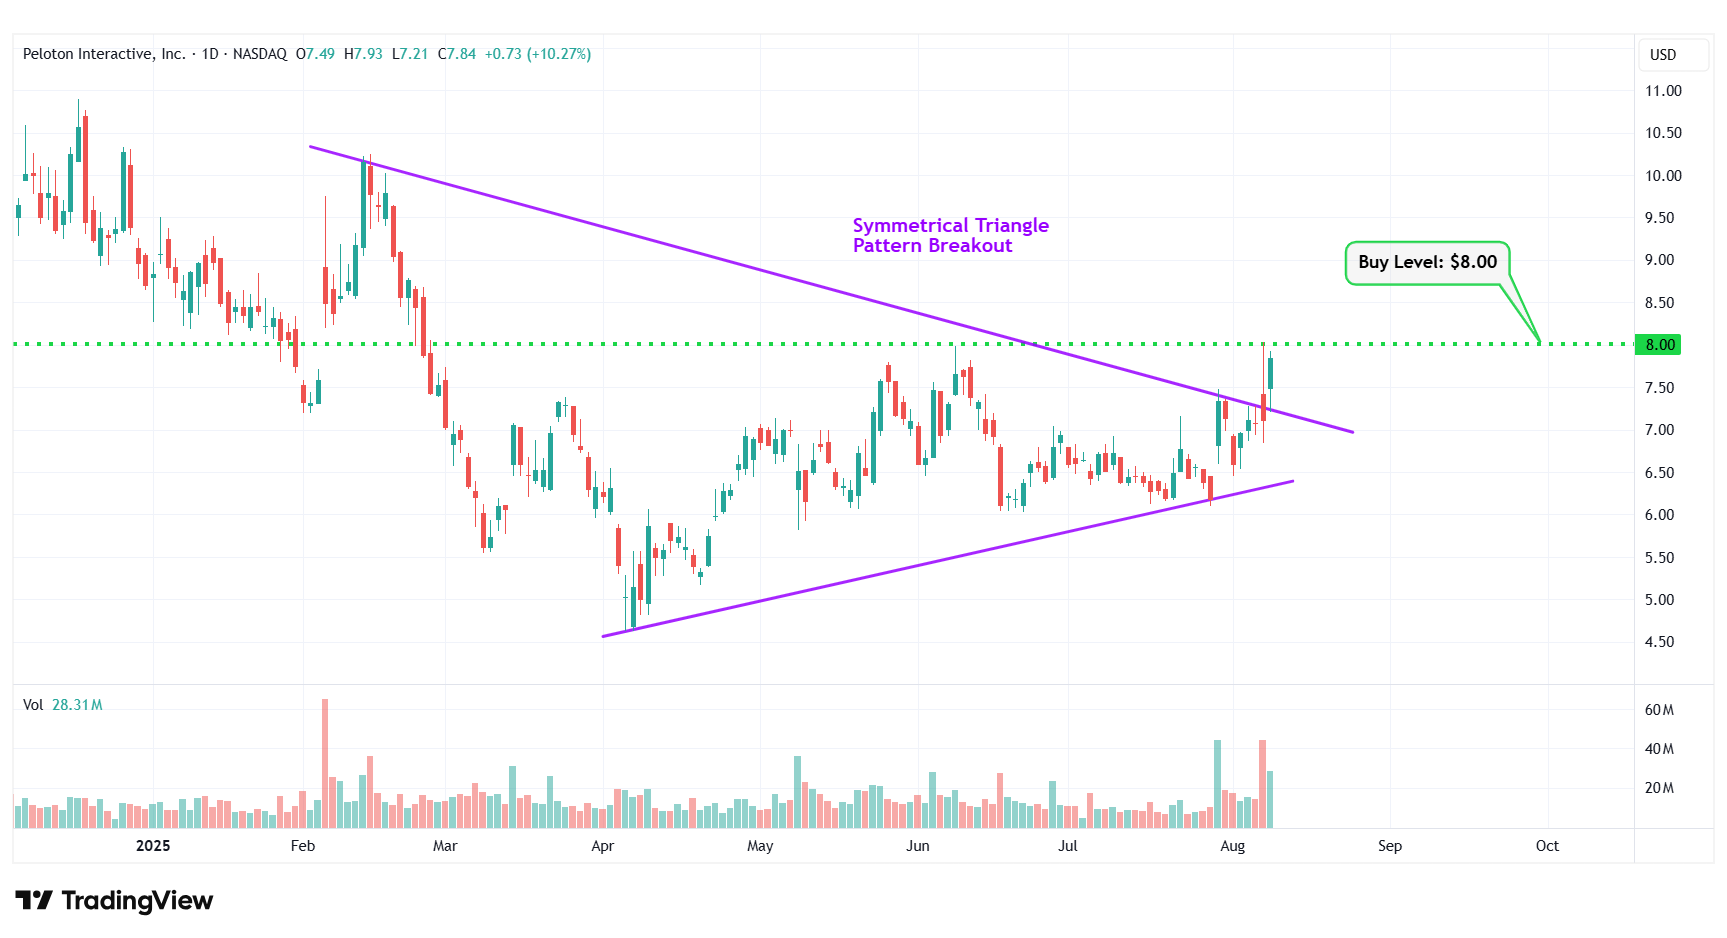
PTON – Symmetrical Triangle Pattern Breakout
#10 SkyWater Technology Inc. (NASDAQ: SKYT)
Sector: Technology • Semiconductors
Reason: Symmetrical Triangle Pattern Breakout
A symmetrical triangle is a chart pattern formed by two converging trend lines connecting a series of sequential peaks and troughs. These two lines result in the formation of a triangle that appears to be symmetrical.
A symmetrical triangle pattern is usually formed when there is indecision in the price movements and there is uncertainty among the buyers and sellers. This chart pattern represents a period of consolidation before the price breaks out or breaks down. In case a breakout occurs from the upper trend line, it is a strong bullish indication as it signifies the start of a new bullish trend.
Buy Level(s): The stock has currently broken out of a symmetrical triangle pattern. However, the ideal buy level for SKYT is if the stock closes above the immediate resistance level of $14.55. This is marked in the chart below as a green color dotted line.
Daily chart – SKYT
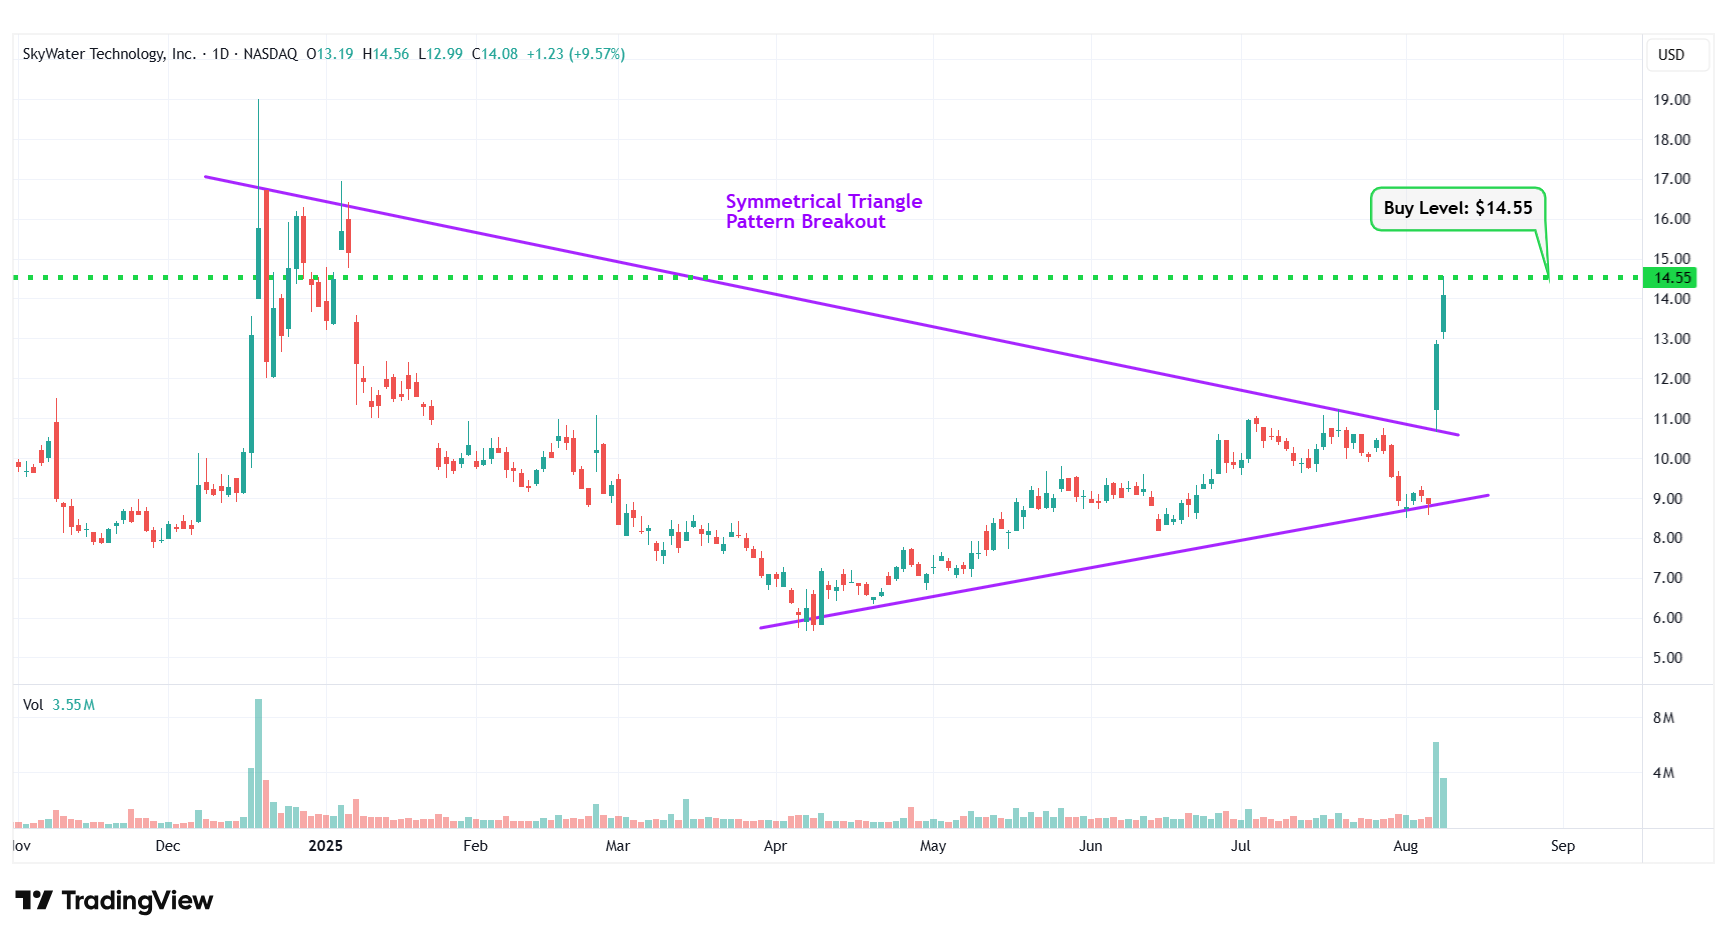
SKYT – Symmetrical Triangle Pattern Breakout
Happy Trading!
Trades of The Day Research Team
Imagine having 12 new monthly income checks, carrying the potential of up to 21% yields.This is possible because of a tested strategy to get paid out regularly, like a paycheck. For over a decade, I have helped more than 26,000 investors secure 12 new monthly payouts. Meaning, you know exactly how much you'll make every month... Because of some stocks that pay us 8%,13.4%, and even 21.6% yields. See it for yourself here.
Source: Trades of the Day
