Picking a winning trade on a consistent basis is not simply a stroke of luck. It’s the result of calculated screening, planning, and deliberation.
With this in mind, we have started a new weekly series on our top 10 stocks to watch this week — stocks that look poised for a possible breakout in the coming days. Traders should add these stocks to their watchlist now.
The Top 10 Stocks to Watch This Week for Possible Breakouts
| Sl # | Name of the Stock | Stock Ticker | Last Close | Buy Level(s) | Reason |
| 1 | Unusual Machines Inc. | AMEX: UMAC | $12.12 | $12.50 | Symmetrical Triangle Pattern Breakout |
| 2 | Kraft Heinz Co. | NASDAQ: KHC | $27.14 | $27.20 | Falling Wedge Pattern Breakout |
| 3 | Ovintiv Inc. | NYSE: OVV | $41.94 | $42.30 | Symmetrical Triangle Pattern Breakout |
| 4 | NextDecade Corporation | NASDAQ: NEXT | $10.77 | $10.90 | Ascending Triangle Pattern Breakout |
| 5 | General Motors Company | NYSE: GM | $53.39 | $54.40 | Symmetrical Triangle Pattern Breakout |
| 6 | United Airlines Holdings Inc. | NASDAQ: UAL | $87.69 | $92.00 | Symmetrical Triangle Pattern |
| 7 | Arista Networks Inc. | NYSE: ANET | $108.57 | $111.70 | Symmetrical Triangle Pattern Breakout |
| 8 | Tsakos Energy Navigation Limited | NYSE: TEN | $20.76 | $21.10 | Symmetrical Triangle Pattern |
| 9 | Confluent Inc. | NASDAQ: CFLT | $24.14 | $26.40 | Symmetrical Triangle Pattern |
| 10 | SharpLink Gaming Inc. | NASDAQ: SBET | $21.65 | $23.00 | Symmetrical Triangle Pattern Breakout |
Important: Typically, these trades offer a risk: reward ratio of 1:2 or 1:3 in the next 6 months, which implies 2x to 3x rewards when compared to risks. So, be sure to set your stop-loss levels and target prices accordingly to manage your risk. In addition, these trade ideas are triggered using daily closing prices, not intra-day pricing. So, if you participate in these trades, make sure that you only buy the stock once its daily close is above the recommended price level.
That said, here are the top 10 stocks to watch for a breakout, in no particular order.
#1 Unusual Machines Inc. (AMEX: UMAC)
Sector: Technology • Computer Hardware
Reason: Symmetrical Triangle Pattern Breakout
A symmetrical triangle is a chart pattern formed by two converging trend lines connecting a series of sequential peaks and troughs. These two lines result in the formation of a triangle that appears to be symmetrical.
A symmetrical triangle pattern is usually formed when there is indecision in the price movements and there is uncertainty among the buyers and sellers. This chart pattern represents a period of consolidation before the price breaks out or breaks down. In case a breakout occurs from the upper trend line, it is a strong bullish indication as it signifies the start of a new bullish trend.
Buy Level(s): The stock has currently broken out of a symmetrical triangle pattern. However, the ideal buy level for UMAC is if the stock closes above the immediate resistance level of $12.50. This is marked in the chart below as a green color dotted line.
Daily chart – UMAC
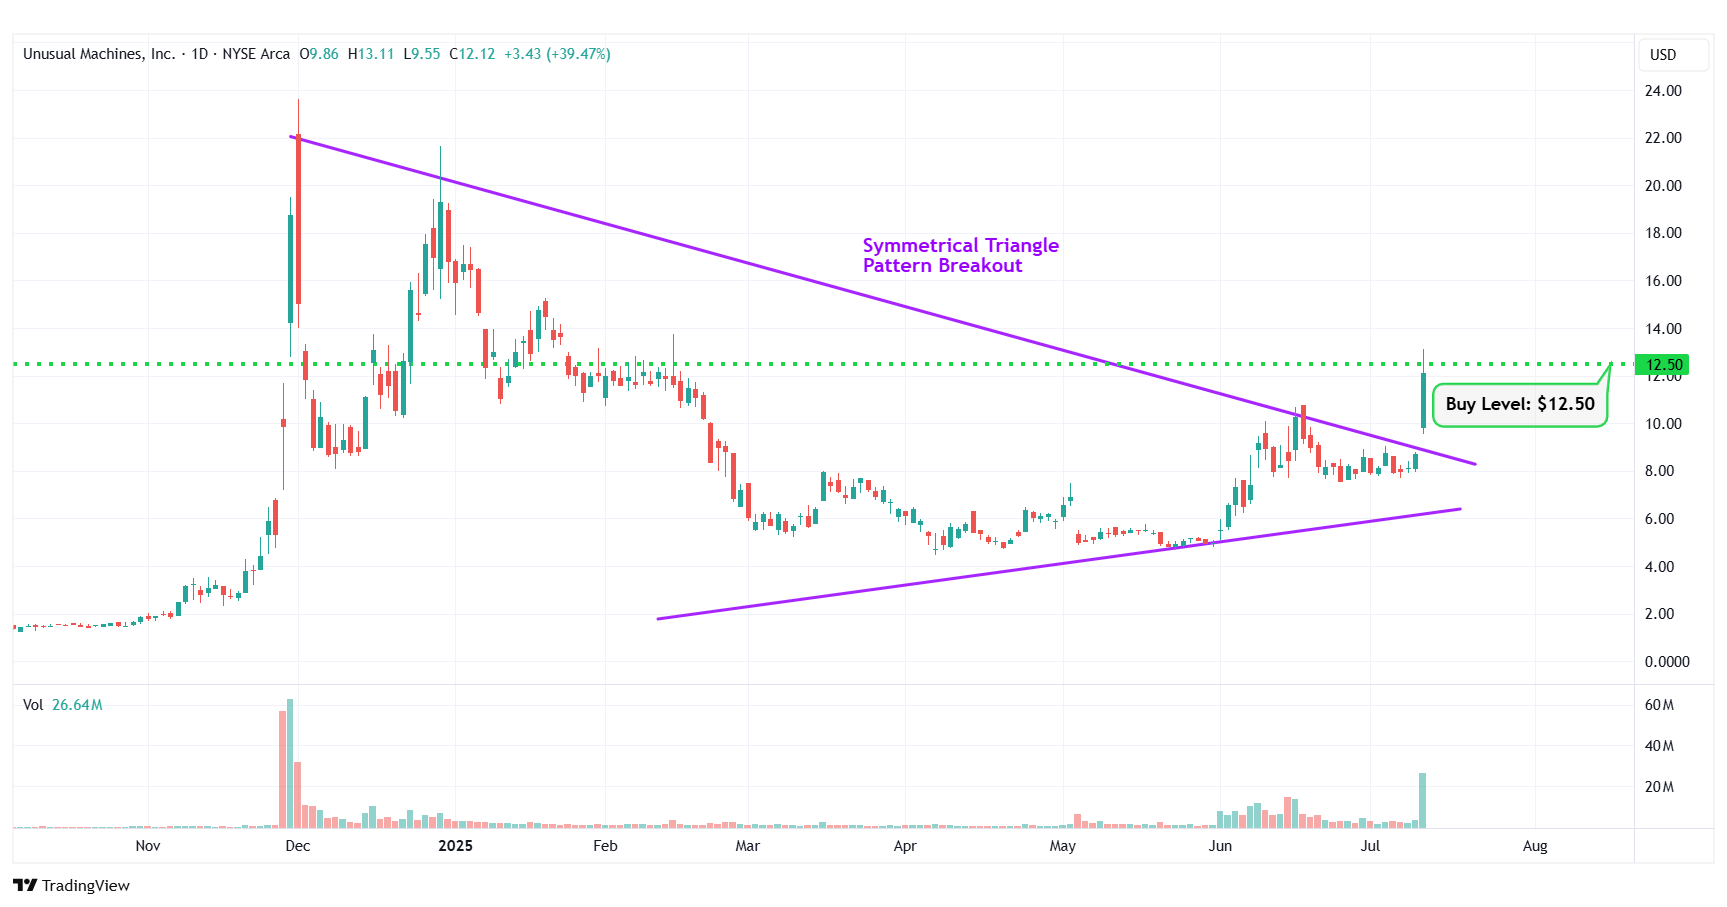
UMAC – Symmetrical Triangle Pattern Breakout
#2 Kraft Heinz Co. (NASDAQ: KHC)
Sector: Consumer Defensive • Packaged Foods
Reason: Falling Wedge Pattern Breakout
A falling wedge pattern is formed by joining two downward-sloping, converging trendlines having a contracting range. The pattern appears to be wide at the top and continues to contract as prices fall. A breakout from a falling wedge pattern can indicate either reversal or continuation depending on where the pattern appeared in the trend.
A stock that has broken out of a falling wedge pattern would have gained momentum and would have the potential to move higher.
Buy Level(s): The stock has currently broken out of a falling wedge pattern. However, the ideal buy level for KHC is above the nearest resistance level of $27.20. This is marked in the chart below as a green color dotted line.
Daily chart – KHC
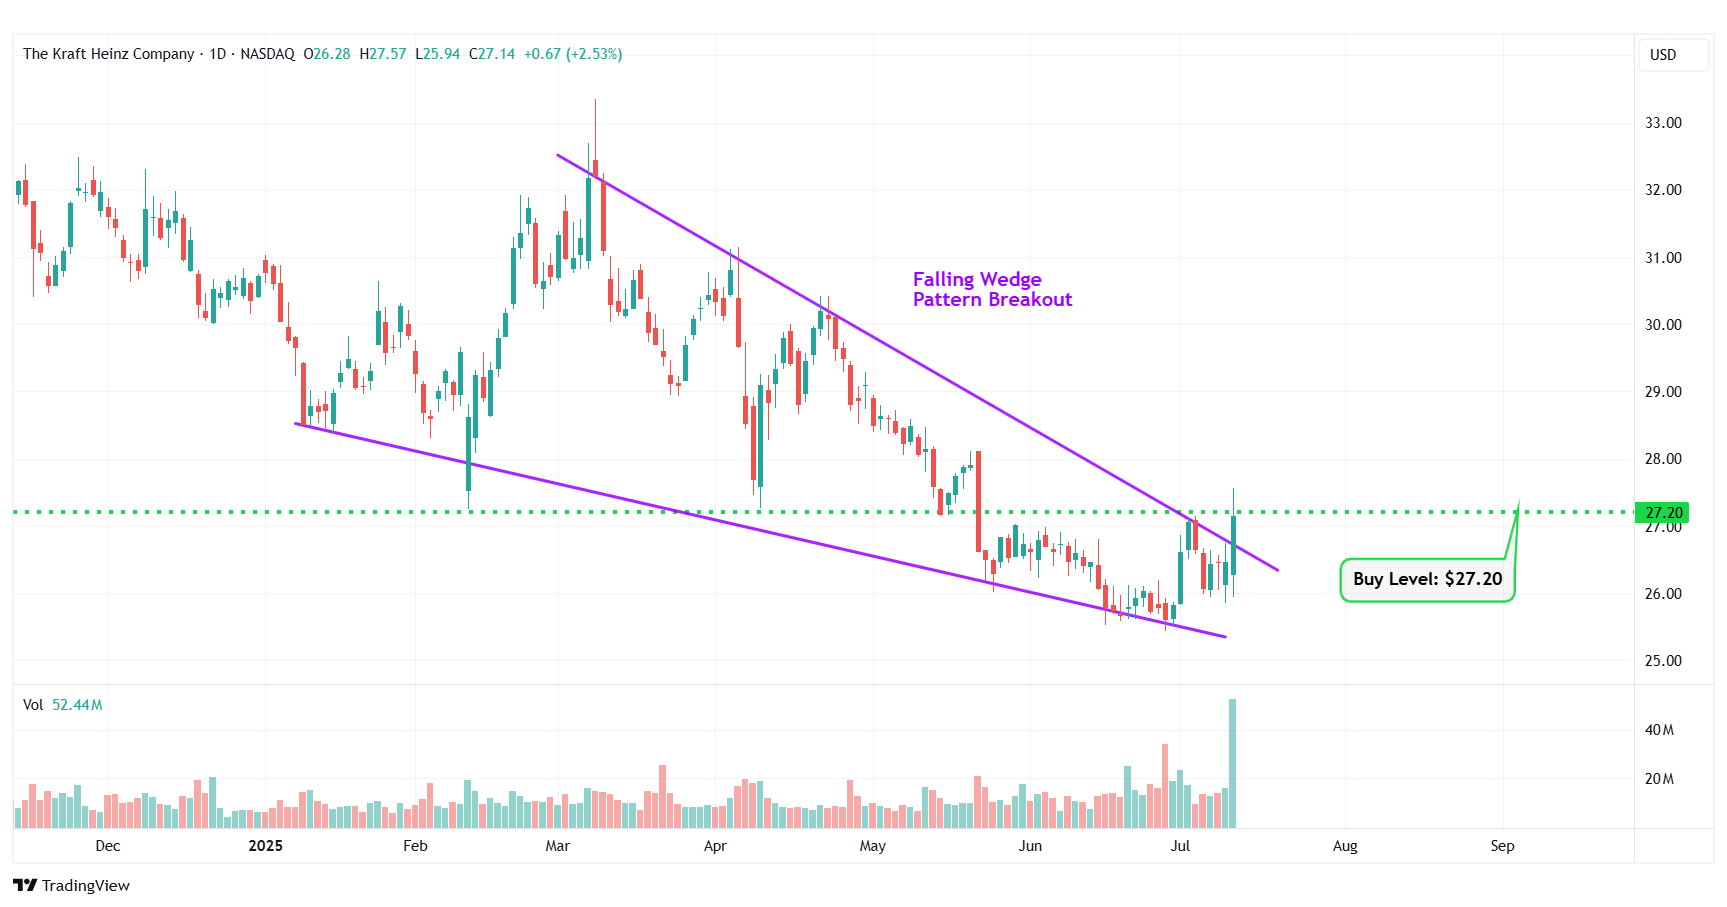
KHC – Falling Wedge Pattern Breakout
#3 Ovintiv Inc. (NYSE: OVV)
Sector: Energy • Oil & Gas E&P
Reason: Symmetrical Triangle Pattern Breakout
A symmetrical triangle is a chart pattern formed by two converging trend lines connecting a series of sequential peaks and troughs. These two lines result in the formation of a triangle that appears to be symmetrical.
A symmetrical triangle pattern is usually formed when there is indecision in the price movements and there is uncertainty among the buyers and sellers. This chart pattern represents a period of consolidation before the price breaks out or breaks down. In case a breakout occurs from the upper trend line, it is a strong bullish indication as it signifies the start of a new bullish trend.
Buy Level(s): The stock has currently broken out of a symmetrical triangle pattern. However, the ideal buy level for OVV is if the stock closes above the immediate resistance level of $42.30. This is marked in the chart below as a green color dotted line.
Daily chart – OVV
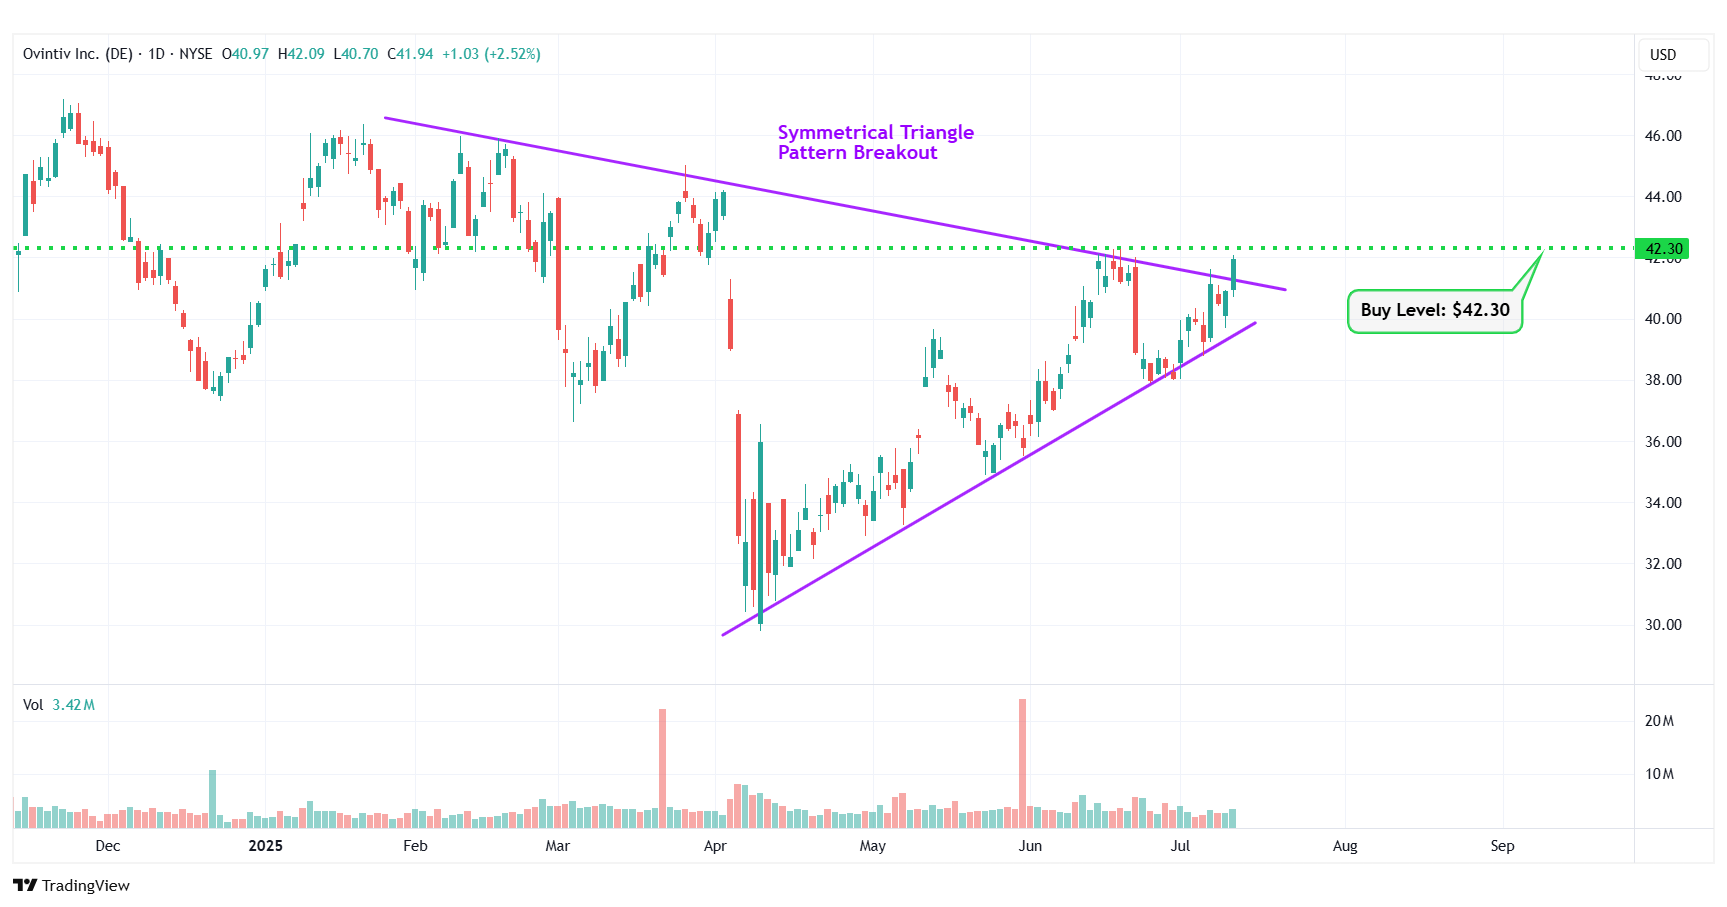
OVV – Symmetrical Triangle Pattern Breakout
#4 NextDecade Corporation (NASDAQ: NEXT)
Sector: Energy • Oil & Gas Equipment & Services
Reason: Breakout From an Ascending Triangle Pattern
An ascending triangle pattern is a bullish pattern formed by drawing a horizontal line along the swing highs, and a rising trendline along the swing lows. These two lines result in the formation of a triangle. A breakout from this pattern is typically a strong bullish indication.
Buy Level(s): Although the stock has broken out of the ascending triangle pattern, the ideal buy level for NEXT is if the stock has a daily close above the near-term resistance level of $10.90. This is marked in the chart below as a green color dotted line.
Daily chart – NEXT
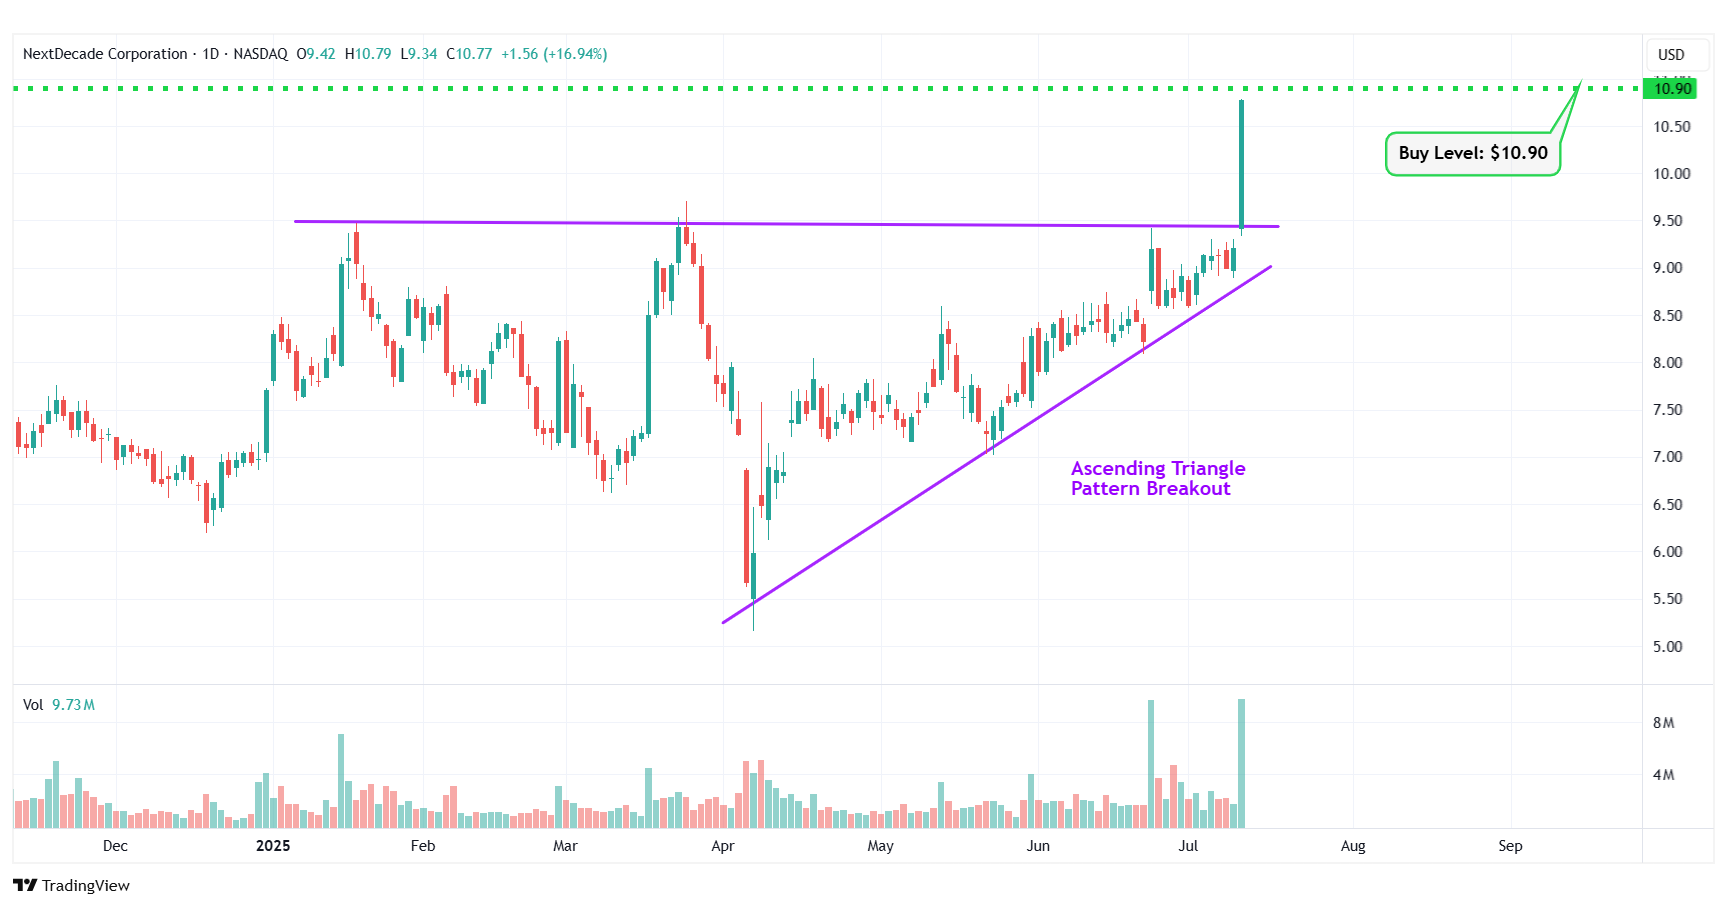
NEXT – Ascending Triangle Pattern Breakout
#5 General Motors Company (NYSE: GM)
Sector: Consumer Cyclical • Auto Manufacturers
Reason: Symmetrical Triangle Pattern Breakout
A symmetrical triangle is a chart pattern formed by two converging trend lines connecting a series of sequential peaks and troughs. These two lines result in the formation of a triangle that appears to be symmetrical.
A symmetrical triangle pattern is usually formed when there is indecision in the price movements and there is uncertainty among the buyers and sellers. This chart pattern represents a period of consolidation before the price breaks out or breaks down. In case a breakout occurs from the upper trend line, it is a strong bullish indication as it signifies the start of a new bullish trend.
Buy Level(s): The stock has currently broken out of a symmetrical triangle pattern. However, the ideal buy level for GM is if the stock closes above the immediate resistance level of $54.40. This is marked in the chart below as a green color dotted line.
Daily chart – GM
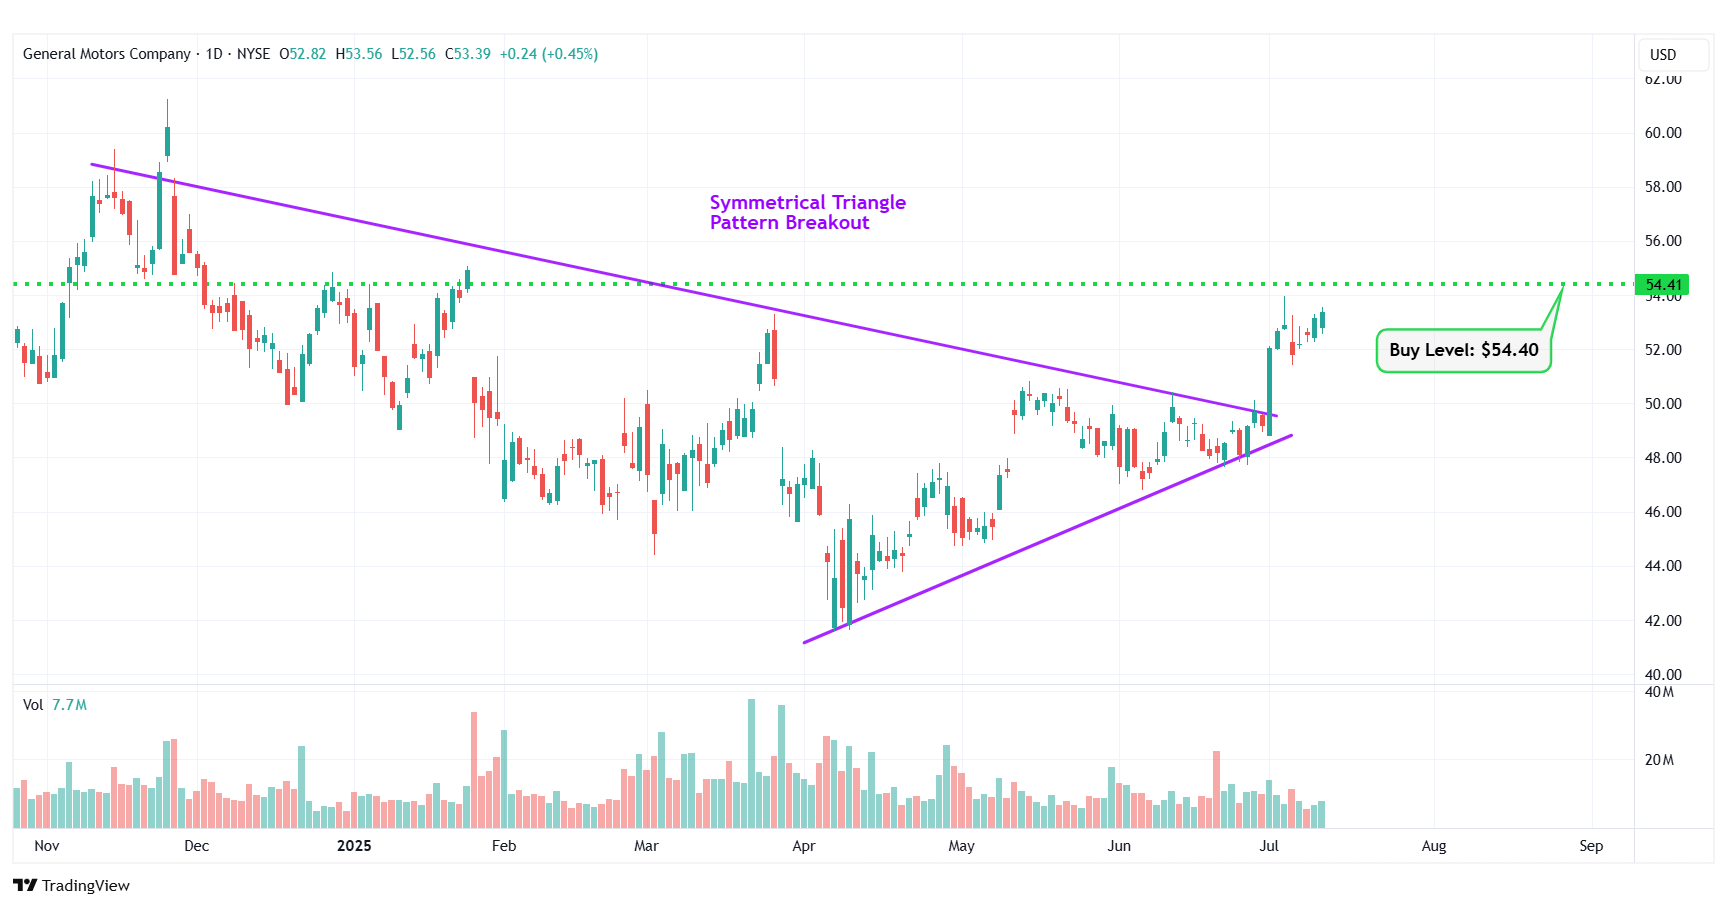
GM – Symmetrical Triangle Pattern Breakout
#6 United Airlines Holdings Inc. (NASDAQ: UAL)
Sector: Industrials • Airlines
Reason: Formation of a Symmetrical Triangle Pattern
A symmetrical triangle is a chart pattern formed by two converging trend lines connecting a series of sequential peaks and troughs. These two lines result in the formation of a triangle that appears to be symmetrical.
A symmetrical triangle pattern is usually formed when there is indecision in the price movements and there is uncertainty among the buyers and sellers. This chart pattern represents a period of consolidation before the price breaks out or breaks down. In case a breakout occurs from the upper trend line, it is a strong bullish indication as it signifies the start of a new bullish trend.
Buy Level(s): The ideal buy level for UAL is if the stock has a daily close above the breakout level of the symmetrical triangle pattern, at around $92.00. This is marked in the chart below as a green color dotted line.
Daily chart – UAL

UAL – Symmetrical Triangle Pattern
#7 Arista Networks Inc. (NYSE: ANET)
Sector: Technology • Computer Hardware
Reason: Symmetrical Triangle Pattern Breakout
A symmetrical triangle is a chart pattern formed by two converging trend lines connecting a series of sequential peaks and troughs. These two lines result in the formation of a triangle that appears to be symmetrical.
A symmetrical triangle pattern is usually formed when there is indecision in the price movements and there is uncertainty among the buyers and sellers. This chart pattern represents a period of consolidation before the price breaks out or breaks down. In case a breakout occurs from the upper trend line, it is a strong bullish indication as it signifies the start of a new bullish trend.
Buy Level(s): The stock has currently broken out of a symmetrical triangle pattern. However, the ideal buy level for ANET is if the stock closes above the immediate resistance level of $111.70. This is marked in the chart below as a green color dotted line.
Daily chart – ANET
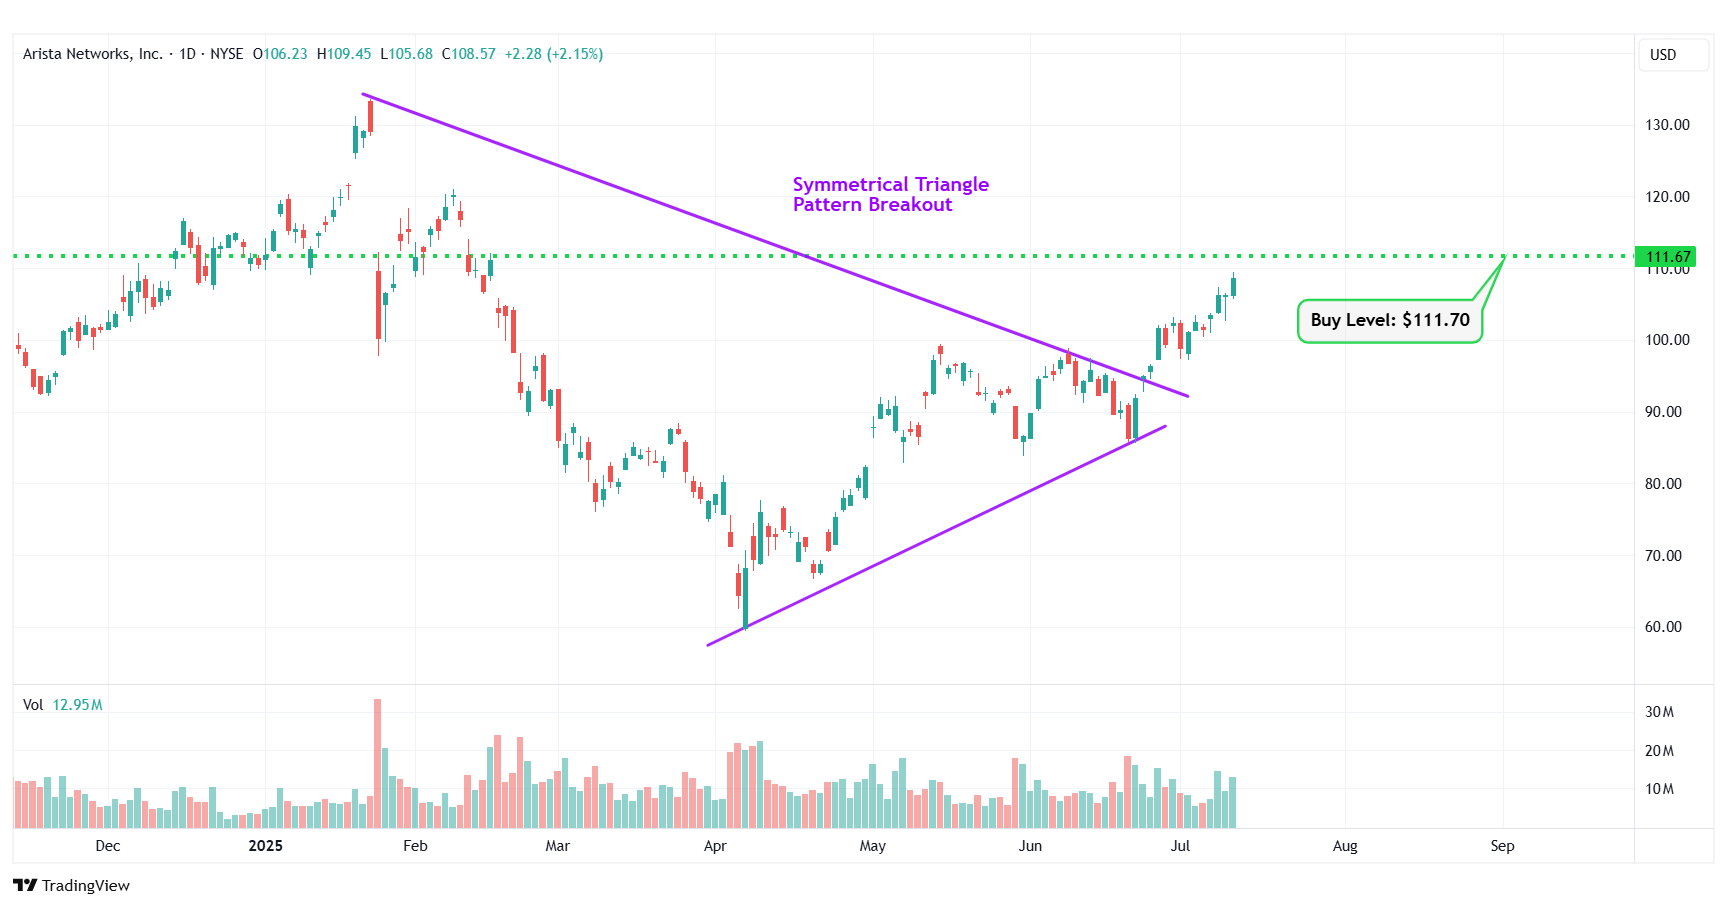
ANET – Symmetrical Triangle Pattern Breakout
#8 Tsakos Energy Navigation Limited (NYSE: TEN)
Sector: Energy • Oil & Gas Midstream
Reason: Formation of a Symmetrical Triangle Pattern
A symmetrical triangle is a chart pattern formed by two converging trend lines connecting a series of sequential peaks and troughs. These two lines result in the formation of a triangle that appears to be symmetrical.
A symmetrical triangle pattern is usually formed when there is indecision in the price movements and there is uncertainty among the buyers and sellers. This chart pattern represents a period of consolidation before the price breaks out or breaks down. In case a breakout occurs from the upper trend line, it is a strong bullish indication as it signifies the start of a new bullish trend.
Buy Level(s): The ideal buy level for TEN is if the stock has a daily close above the breakout level of the symmetrical triangle pattern, at around $21.10. This is marked in the chart below as a green color dotted line.
Daily chart – TEN
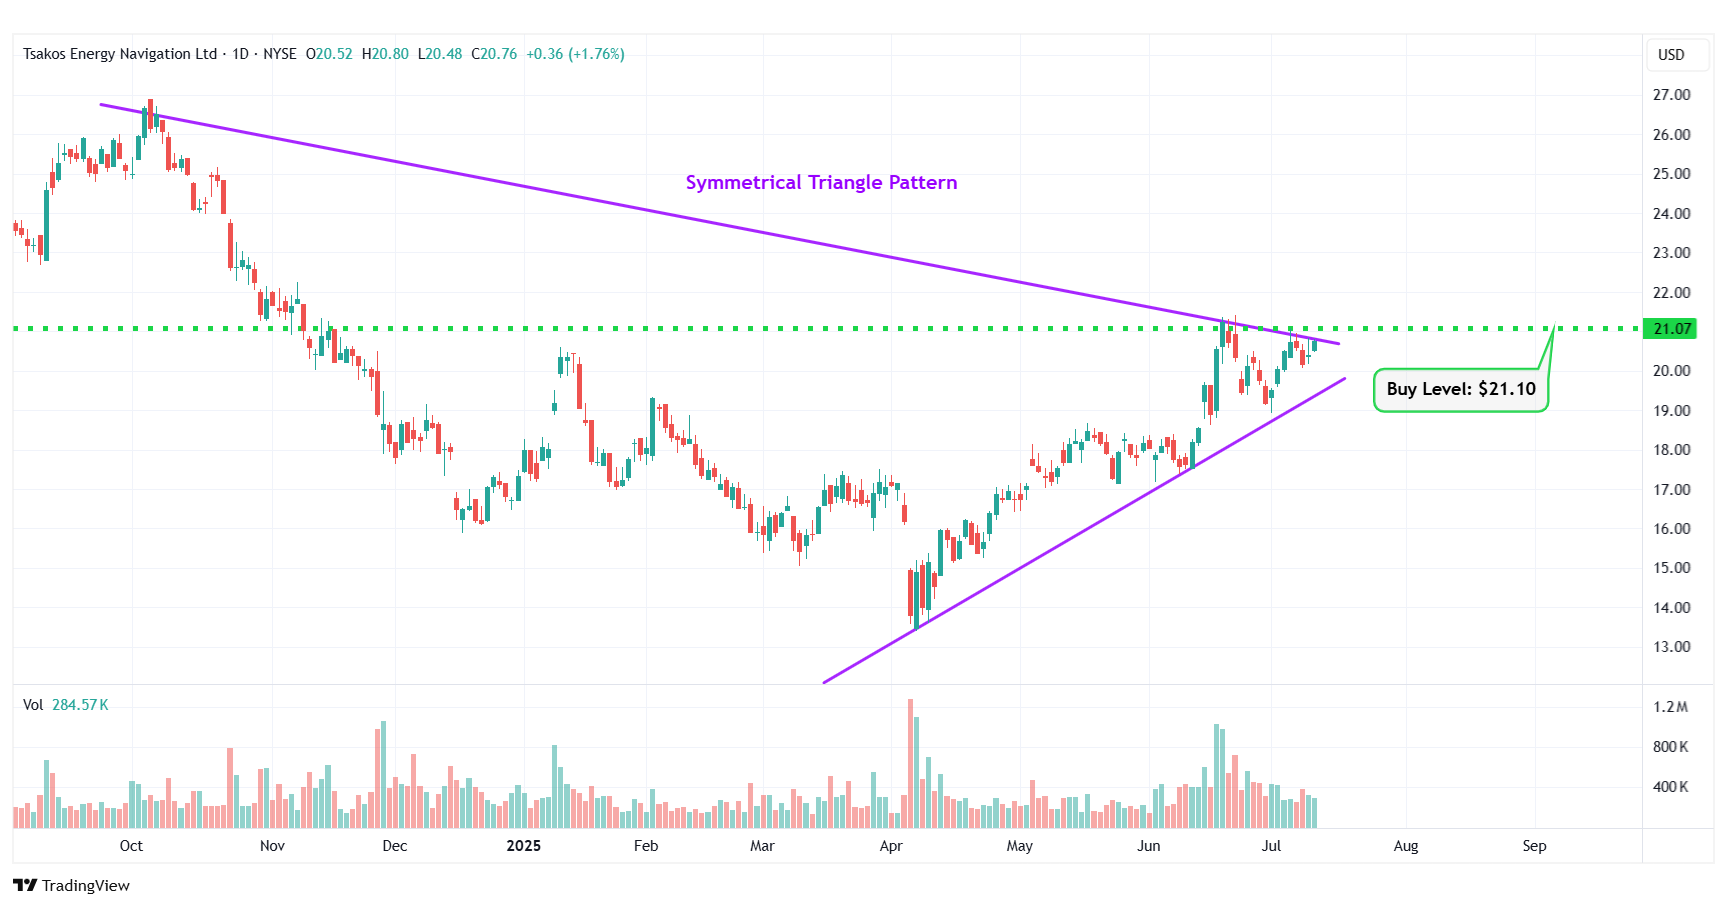
TEN – Symmetrical Triangle Pattern
#9 Confluent Inc. (NASDAQ: CFLT)
Sector: Technology • Software – Infrastructure
Reason: Formation of a Symmetrical Triangle Pattern
A symmetrical triangle is a chart pattern formed by two converging trend lines connecting a series of sequential peaks and troughs. These two lines result in the formation of a triangle that appears to be symmetrical.
A symmetrical triangle pattern is usually formed when there is indecision in the price movements and there is uncertainty among the buyers and sellers. This chart pattern represents a period of consolidation before the price breaks out or breaks down. In case a breakout occurs from the upper trend line, it is a strong bullish indication as it signifies the start of a new bullish trend.
Buy Level(s): The ideal buy level for CFLT is if the stock has a daily close above the breakout level of the symmetrical triangle pattern, at around $26.40. This is marked in the chart below as a green color dotted line.
Daily chart – CFLT
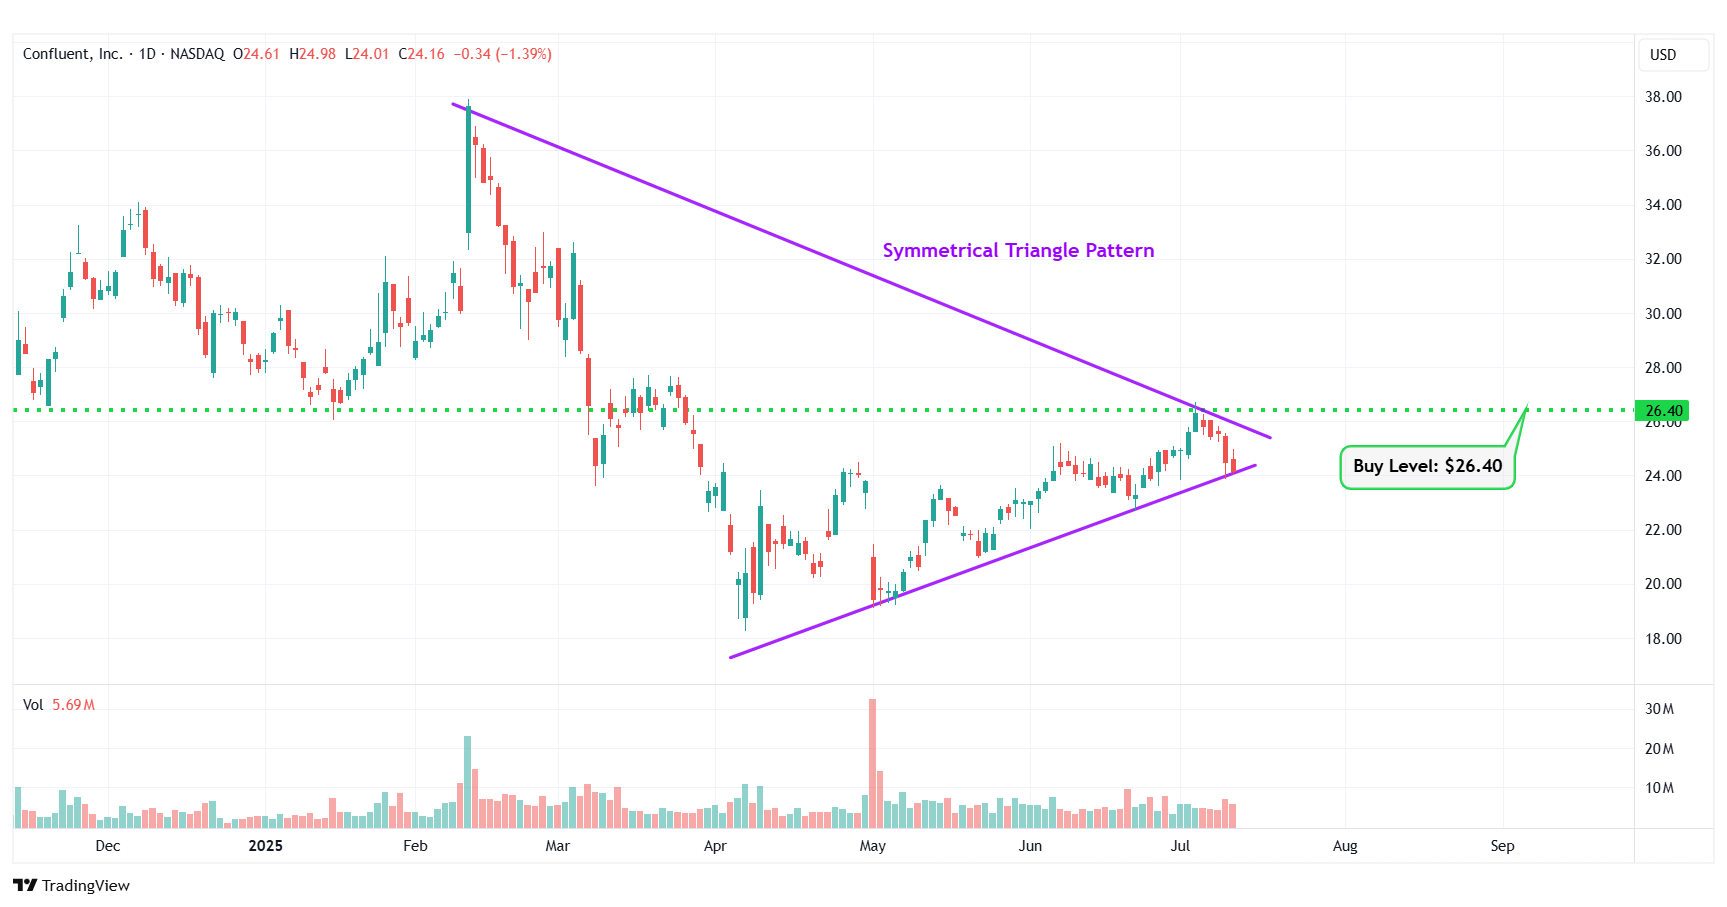
CFLT – Symmetrical Triangle Pattern
#10 SharpLink Gaming Inc. (NASDAQ: SBET)
Sector: Consumer Cyclical • Gambling
Reason: Symmetrical Triangle Pattern Breakout
A symmetrical triangle is a chart pattern formed by two converging trend lines connecting a series of sequential peaks and troughs. These two lines result in the formation of a triangle that appears to be symmetrical.
A symmetrical triangle pattern is usually formed when there is indecision in the price movements and there is uncertainty among the buyers and sellers. This chart pattern represents a period of consolidation before the price breaks out or breaks down. In case a breakout occurs from the upper trend line, it is a strong bullish indication as it signifies the start of a new bullish trend.
Buy Level(s): The stock has currently broken out of a symmetrical triangle pattern. However, the ideal buy level for SBET is if the stock closes above the immediate resistance level of $23.00. This is marked in the chart below as a green color dotted line.
Daily chart – SBET
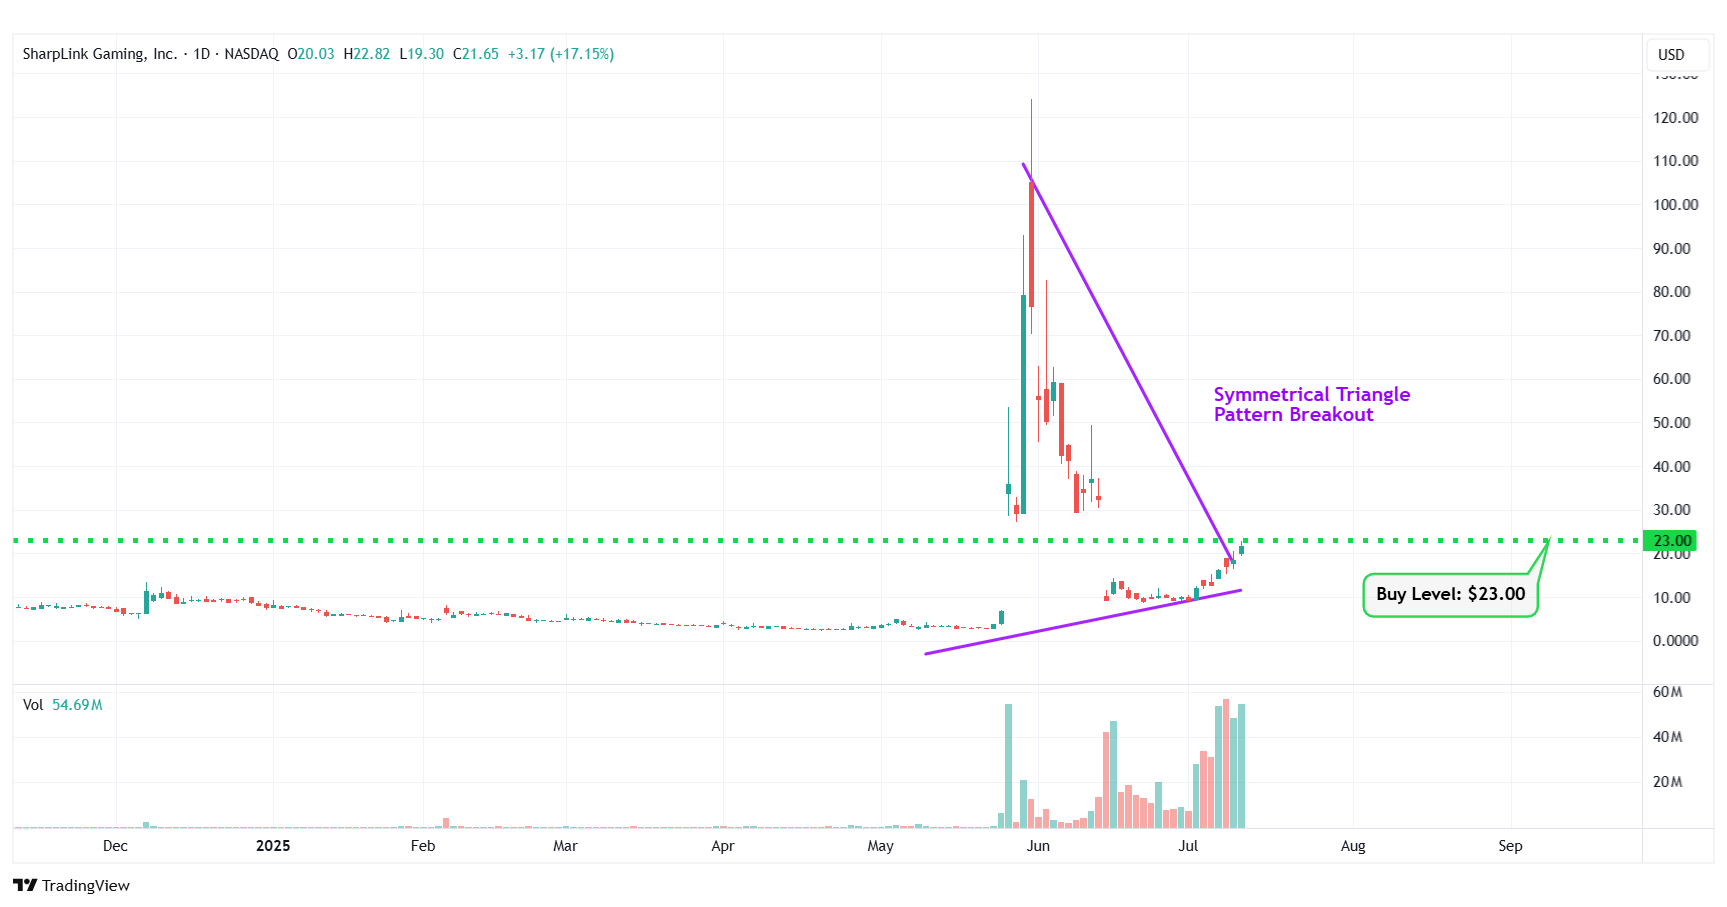
SBET – Symmetrical Triangle Pattern Breakout
Happy Trading!
Trades of The Day Research Team
Karim Rahemtulla, the trader behind a 400% gain in 24-months on Rolls-Royce, has uncovered another potential multi-bagger. This under-$20 stock gives you exposure to over 1-oz of gold with the lowest production costs in the industry. And an upcoming announcement could send this stock soaring. Get Karim's urgent briefing - click here now.
Source: Trades of the Day

