Oracle Corporation (NYSE: ORCL) seems poised for a price surge based on its latest charts. The company offers products and services that address enterprise information technology environments worldwide.
Its Oracle cloud software as a service offering includes various cloud software applications, including Oracle Fusion cloud enterprise resource planning (ERP), Oracle Fusion cloud enterprise performance management, Oracle Fusion cloud supply chain and manufacturing management, Oracle Fusion cloud human capital management, Oracle Cerner healthcare, and NetSuite applications suite, as well as Oracle Fusion Sales, Service, and Marketing.
Bullish Indications
#1 Symmetrical Triangle Pattern Breakout: The daily chart shows that the stock had recently formed a Symmetrical Triangle pattern. This is a continuation pattern and is characterized by two converging trend lines connecting a series of sequential peaks and troughs. This pattern is marked on the daily chart as purple lines. The breakout from a symmetrical triangle pattern usually signifies a bullish move. Currently, the stock has broken out of the symmetrical triangle pattern with a high volume which is a possible bullish sign.
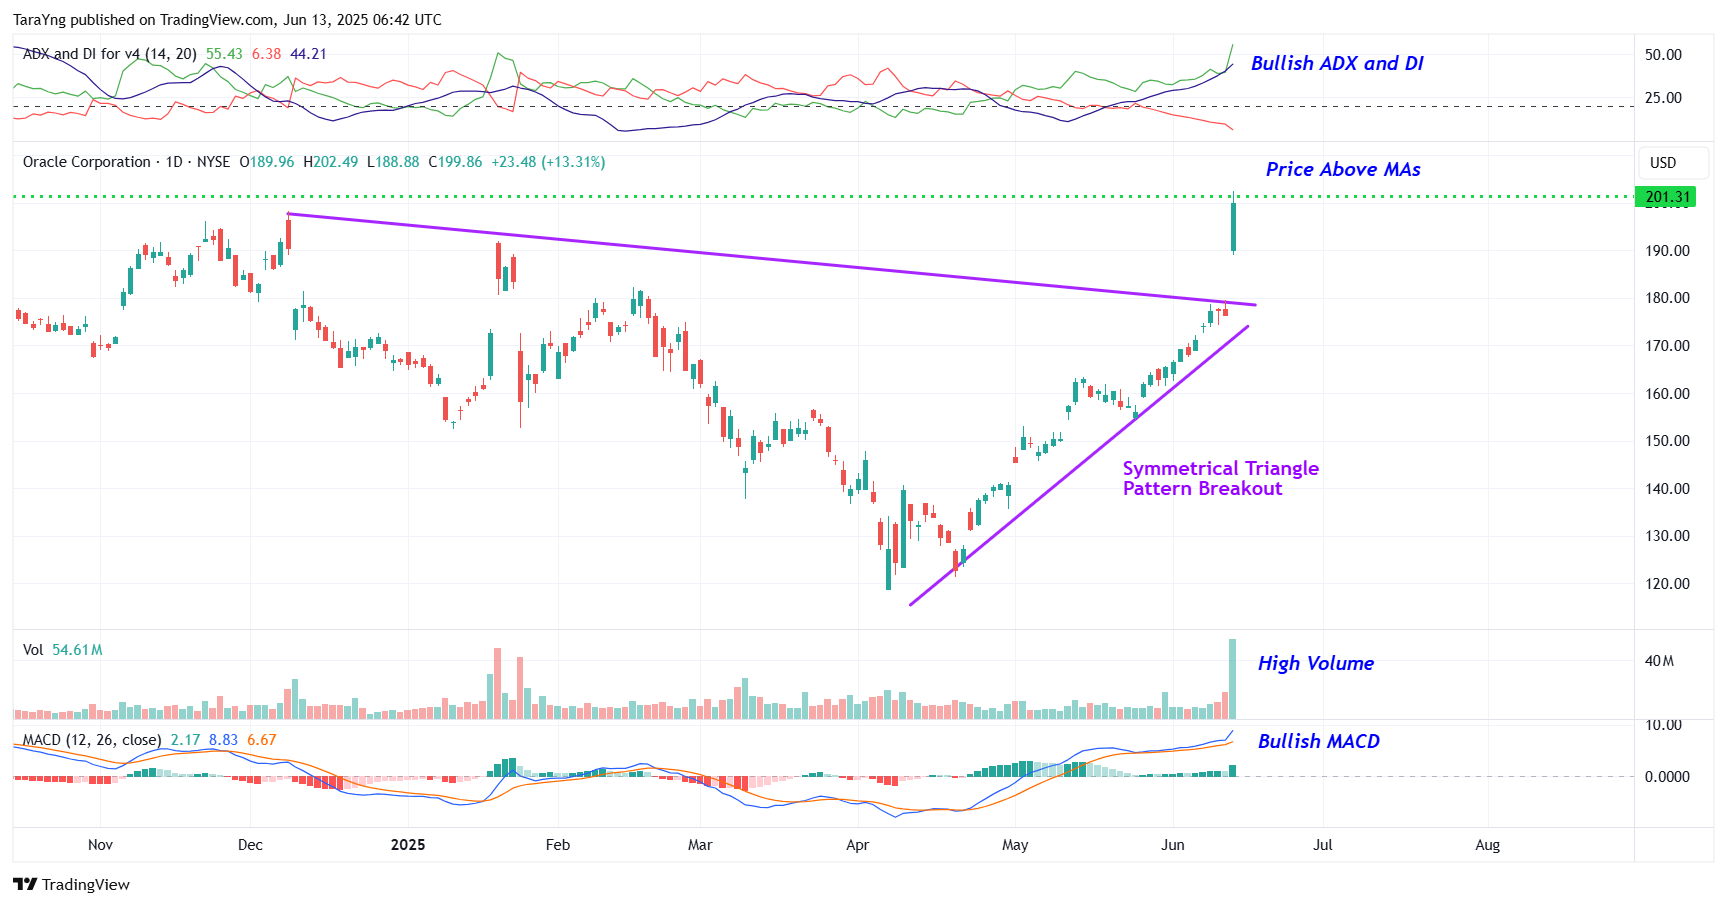
ORCL – Daily Chart
#2 Price above MAs: The price is currently above the short-term moving average of 50-day SMA as well as the longer-term moving average of 200-day SMA, indicating that the bulls are still in control. This is a positive indication.
#3 MACD Above Signal Line: In the daily chart, the MACD line (light blue color) is currently above the MACD signal line (orange color) which is typically considered bullish.
#4 Bullish ADX: The ADX indicator shows that the +DI line is currently above the –DI line and the ADX line has started to move up from below the –DI and +DI lines. This indicates possible bullishness.
#5 Above Support Area: As you can see from the weekly chart, the stock has currently moved up from a resistance-turned-support level. This level is marked as a pink dotted line. This looks like a good area for the stock to move higher. The stock is also trading above its 50-week and 200-week SMA, indicating that the bulls are still in control.
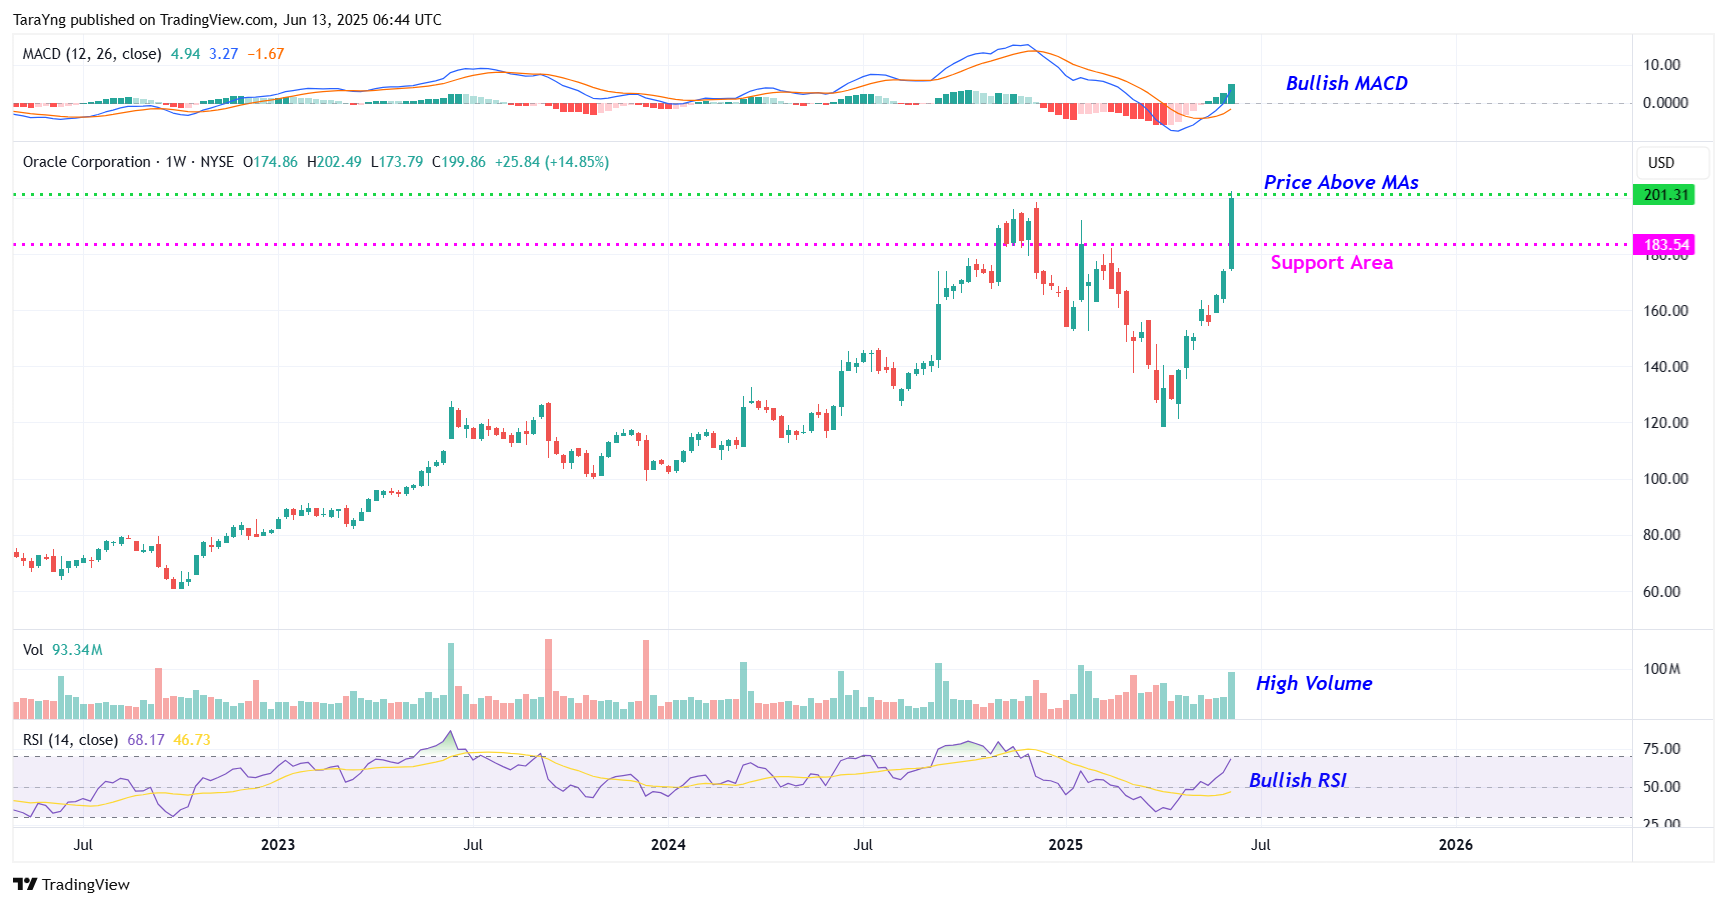
ORCL – Weekly Chart
#6 Bullish MACD: The MACD line is above the MACD signal line in the weekly chart as well, indicating bullishness.
Recommended Trade (based on the charts)
Buy Levels: If you want to get in on this trade, you can purchase shares of ORCL above the price of around $201.30.
TP: Our target prices are $223.00 and $240.00 in the next 3-6 months.
SL: To limit risk, place stop-loss at $188.00. Note that the stop-loss is on a closing basis.
Our target potential upside is 11% to 19% in the next 3 to 6 months.
For a risk of $13.30, our target rewards are $21.70 and $38.70. This is a nearly 1:2 and 1:3 risk-reward trade.
In other words, this trade offers nearly 2x to 3x more potential upside than downside.
Risks to Consider
The stock may reverse its overall trend if it breaks down from the symmetrical triangle pattern with a high volume. The sell-off of the stock could also be triggered in case of any negative news, overall weakness in the market, or any regulatory changes in the sector.
Happy Trading!
Tara
Legendary fund manager Louis Navellier – a man Forbes calls "the king of quants" – is going "ALL-IN" on this game-changing AI technology. He says, "This is the culmination of everything you've been reading about AI for the last 60 years."Get the details...
Source: Trades of the Day

