Picking a winning trade on a consistent basis is not simply a stroke of luck. It’s the result of calculated screening, planning, and deliberation.
With this in mind, we have started a new weekly series on our top 10 stocks to watch this week — stocks that look poised for a possible breakout in the coming days. Traders should add these stocks to their watchlist now.
The Top 10 Stocks to Watch This Week for Possible Breakouts
| Sl # | Name of the Stock | Stock Ticker | Last Close | Buy Level(s) | Reason |
| 1 | Intuit Inc. | NASDAQ: INTU | $720.13 | $727.60 | Symmetrical Triangle Pattern Breakout |
| 2 | Cameco Corp | NYSE: CCJ | $58.69 | $59.00 | Downtrend Channel Breakout |
| 3 | Rigetti Computing Inc. | NASDAQ: RGTI | $14.02 | $14.60 | Symmetrical Triangle Pattern Breakout |
| 4 | United States Steel Corp | NYSE: X | $52.01 | $53.10 | Ascending Triangle Pattern Breakout |
| 5 | Fluor Corporation | NYSE: FLR | $41.04 | $41.30 | Downtrend Channel Breakout |
| 6 | Oklo Inc. | NYSE: OKLO | $48.87 | $50.20 | Symmetrical Triangle Pattern Breakout |
| 7 | Informatica Inc. | NYSE: INFA | $22.55 | $23.20 | Falling Wedge Pattern Breakout |
| 8 | Merus N.V | NASDAQ: MRUS | $55.14 | $55.50 | Downtrend Channel Breakout |
| 9 | Quantum Computing Inc. | NASDAQ: QUBT | $13.31 | $14.15 | Symmetrical Triangle Pattern Breakout |
| 10 | Peloton Interactive Inc. | NASDAQ: PTON | $7.57 | $7.70 | Downtrend Channel Breakout |
Important: Typically, these trades offer a risk: reward ratio of 1:2 or 1:3 in the next 6 months, which implies 2x to 3x rewards when compared to risks. So, be sure to set your stop-loss levels and target prices accordingly to manage your risk. In addition, these trade ideas are triggered using daily closing prices, not intra-day pricing. So, if you participate in these trades, make sure that you only buy the stock once its daily close is above the recommended price level.
That said, here are the top 10 stocks to watch for a breakout, in no particular order.
#1 Intuit Inc. (NASDAQ: INTU)
Sector: Technology • Software – Application
Reason: Symmetrical Triangle Pattern Breakout
A symmetrical triangle is a chart pattern formed by two converging trend lines connecting a series of sequential peaks and troughs. These two lines result in the formation of a triangle that appears to be symmetrical.
A symmetrical triangle pattern is usually formed when there is indecision in the price movements and there is uncertainty among the buyers and sellers. This chart pattern represents a period of consolidation before the price breaks out or breaks down. In case a breakout occurs from the upper trend line, it is a strong bullish indication as it signifies the start of a new bullish trend.
Buy Level(s): The stock has currently broken out of a symmetrical triangle pattern. However, the ideal buy level for INTU is if the stock closes above the immediate resistance level of $727.60. This is marked in the chart below as a green color dotted line.
Daily chart – INTU
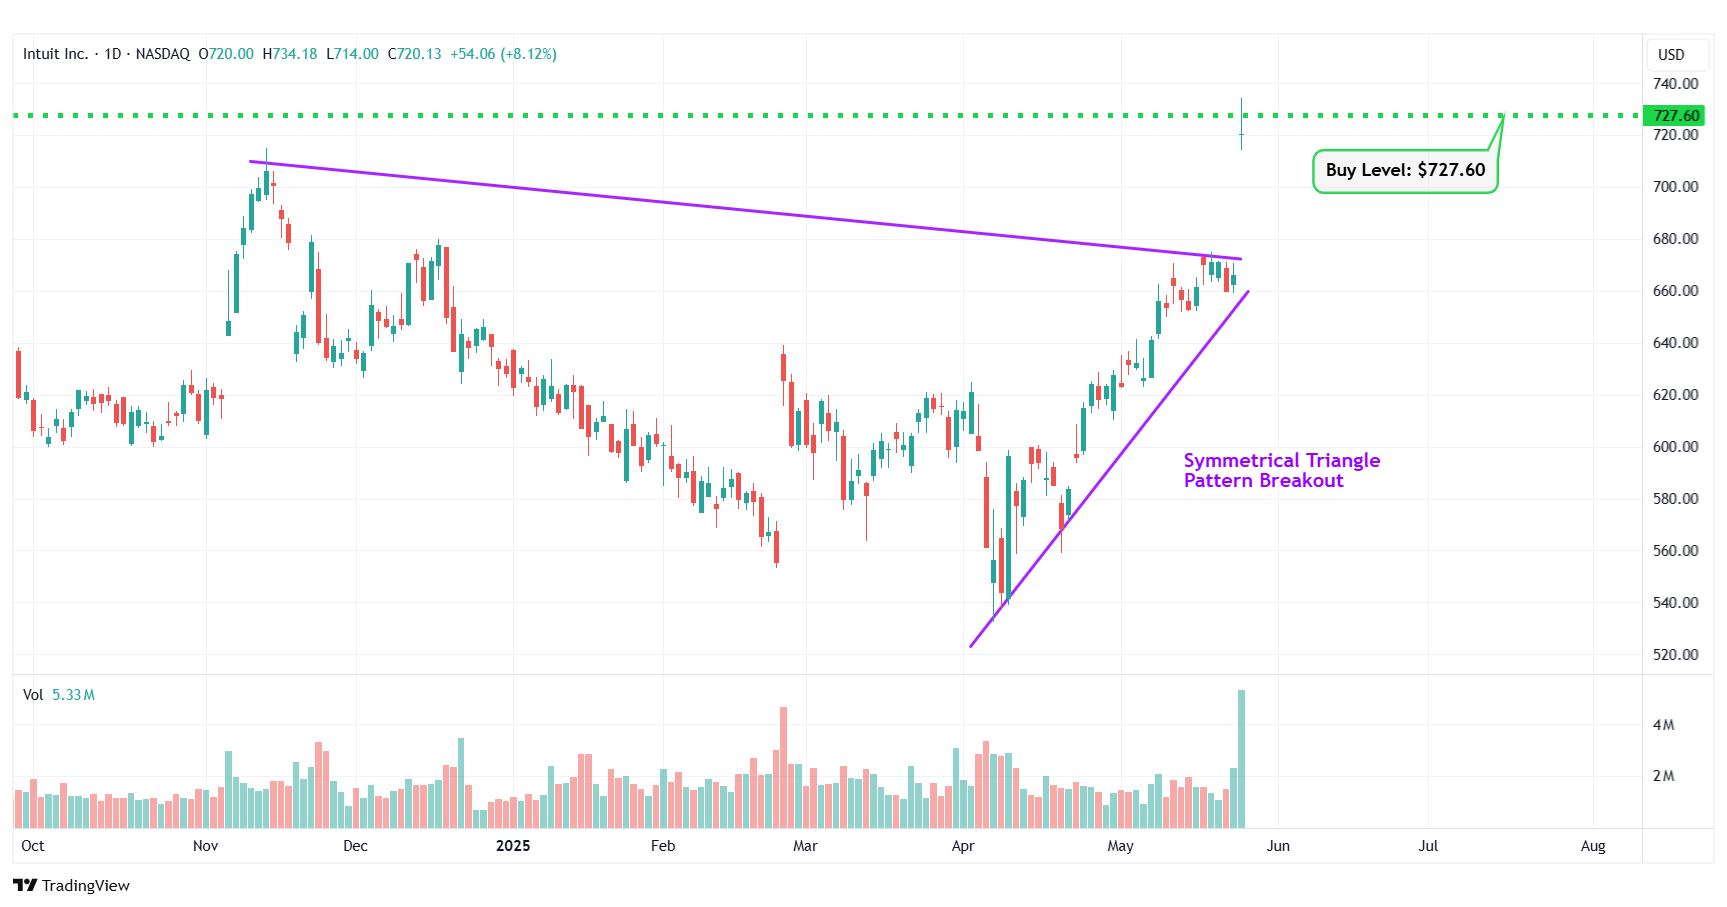
INTU – Symmetrical Triangle Pattern Breakout
#2 Cameco Corp (NYSE: CCJ)
Sector: Energy • Uranium
Reason: Downtrend Channel Breakout
A downtrend or descending channel is the price action contained between downward sloping parallel lines. It is formed by two lines that are drawn by connecting the lower highs and lower lows of a stock’s price. Even though this is typically a bearish pattern, a breakout from the upper rail of this pattern is considered a good bullish indication.
Buy Level(s): The daily chart shows that the stock has currently broken out of a downtrend channel. However, there is a near-term resistance level for the stock. Hence, the ideal buy level for CCJ is if the stock has a daily close above $59.00. This is marked in the chart below as a green color dotted line.
Daily chart – CCJ
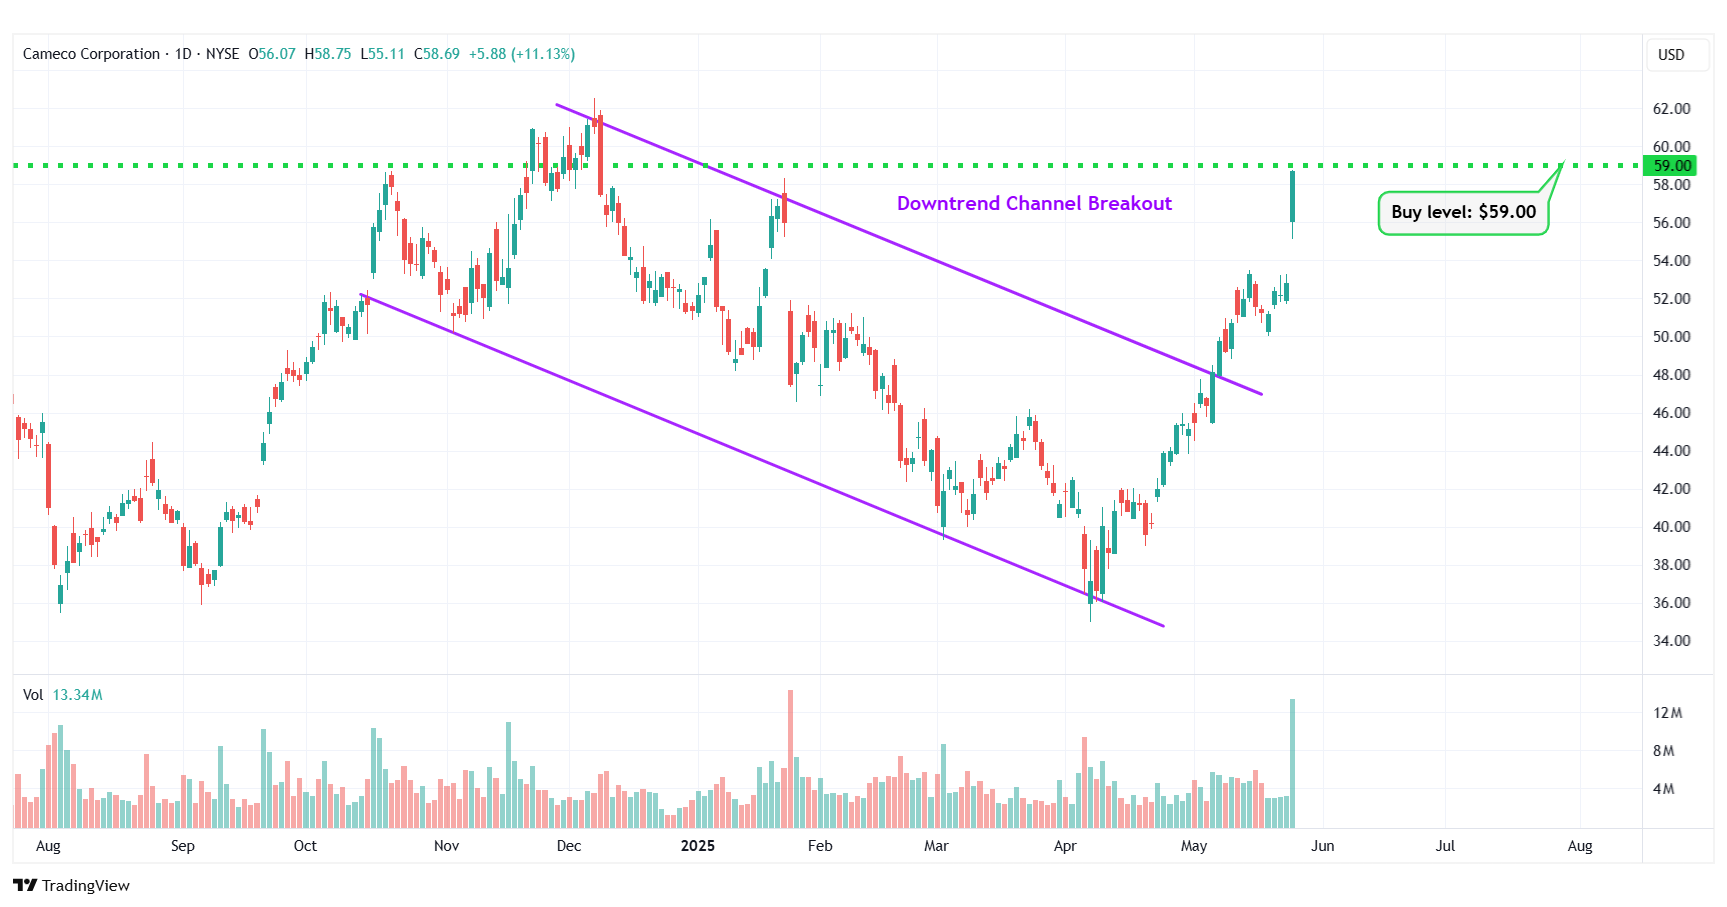
CCJ – Downtrend Channel Breakout
#3 Rigetti Computing Inc. (NASDAQ: RGTI)
Sector: Technology • Computer Hardware
Reason: Symmetrical Triangle Pattern Breakout
A symmetrical triangle is a chart pattern formed by two converging trend lines connecting a series of sequential peaks and troughs. These two lines result in the formation of a triangle that appears to be symmetrical.
A symmetrical triangle pattern is usually formed when there is indecision in the price movements and there is uncertainty among the buyers and sellers. This chart pattern represents a period of consolidation before the price breaks out or breaks down. In case a breakout occurs from the upper trend line, it is a strong bullish indication as it signifies the start of a new bullish trend.
Buy Level(s): The stock has currently broken out of a symmetrical triangle pattern. However, the ideal buy level for RGTI is if the stock closes above the immediate resistance level of $14.60. This is marked in the chart below as a green color dotted line.
Daily chart – RGTI
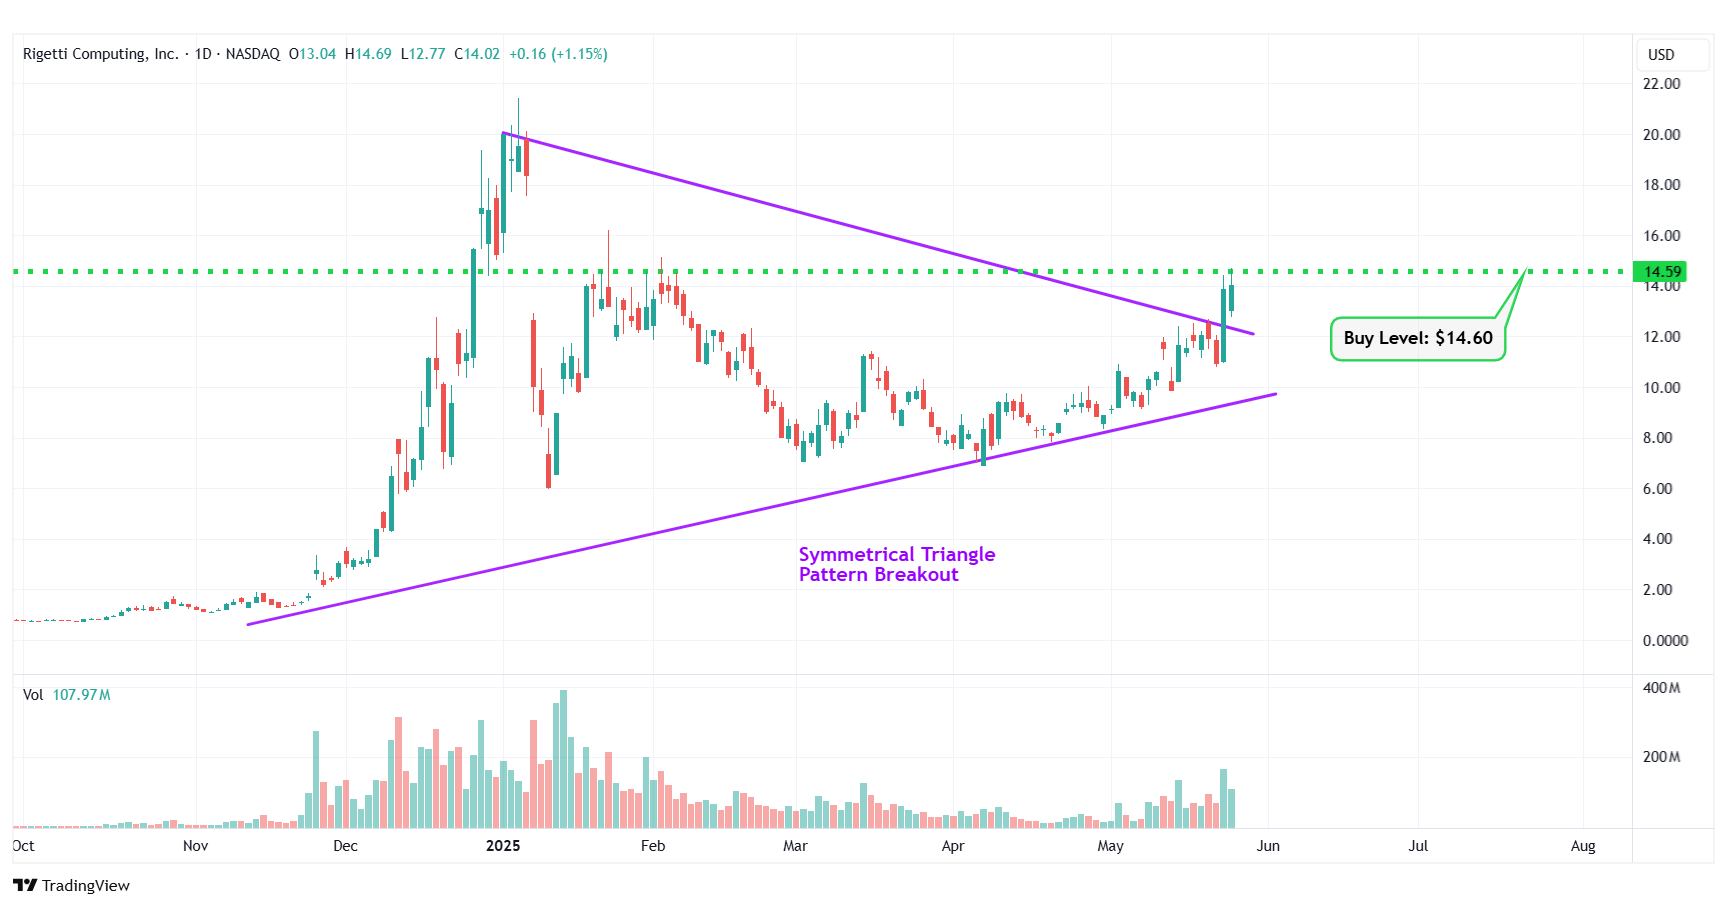
RGTI – Symmetrical Triangle Pattern Breakout
#4 United States Steel Corp (NYSE: X)
Sector: Basic Materials • Steel
Reason: Breakout from an Ascending Triangle Pattern
An ascending triangle pattern is a bullish pattern formed by drawing a horizontal line along the swing highs, and a rising trendline along the swing lows. These two lines result in the formation of a triangle. A breakout from this pattern is typically a strong bullish indication.
Buy Level(s): The daily chart shows that the stock has currently broken out of an ascending triangle pattern. However, there is a near-term resistance level for the stock. Hence, the ideal buy level for X is if the stock has a daily close above $53.10. This is marked in the chart below as a green color dotted lines.
Daily chart – X
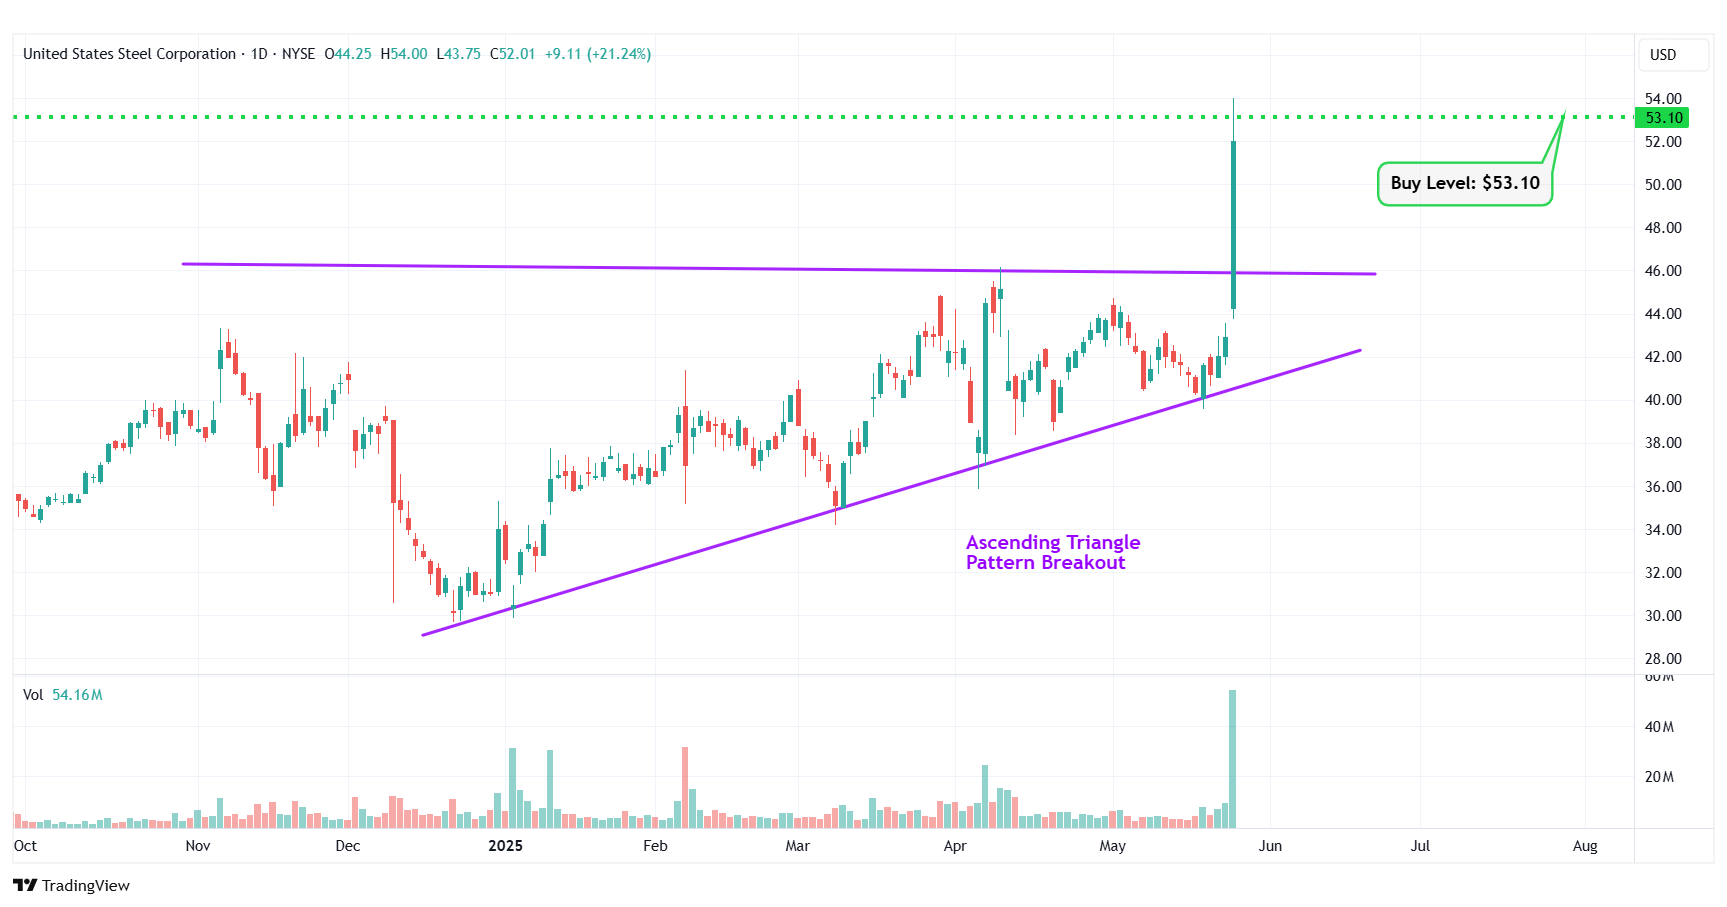
X – Ascending Triangle Pattern Breakout
#5 Fluor Corporation (NYSE: FLR)
Sector: Industrials • Engineering & Construction
Reason: Downtrend Channel Breakout
A downtrend or descending channel is the price action contained between downward sloping parallel lines. It is formed by two lines that are drawn by connecting the lower highs and lower lows of a stock’s price. Even though this is typically a bearish pattern, a breakout from the upper rail of this pattern is considered a good bullish indication.
Buy Level(s): The daily chart shows that the stock has currently broken out of a downtrend channel. However, there is a near-term resistance level for the stock. Hence, the ideal buy level for FLR is if the stock has a daily close above $41.30. This is marked in the chart below as a green color dotted line.
Daily chart – FLR
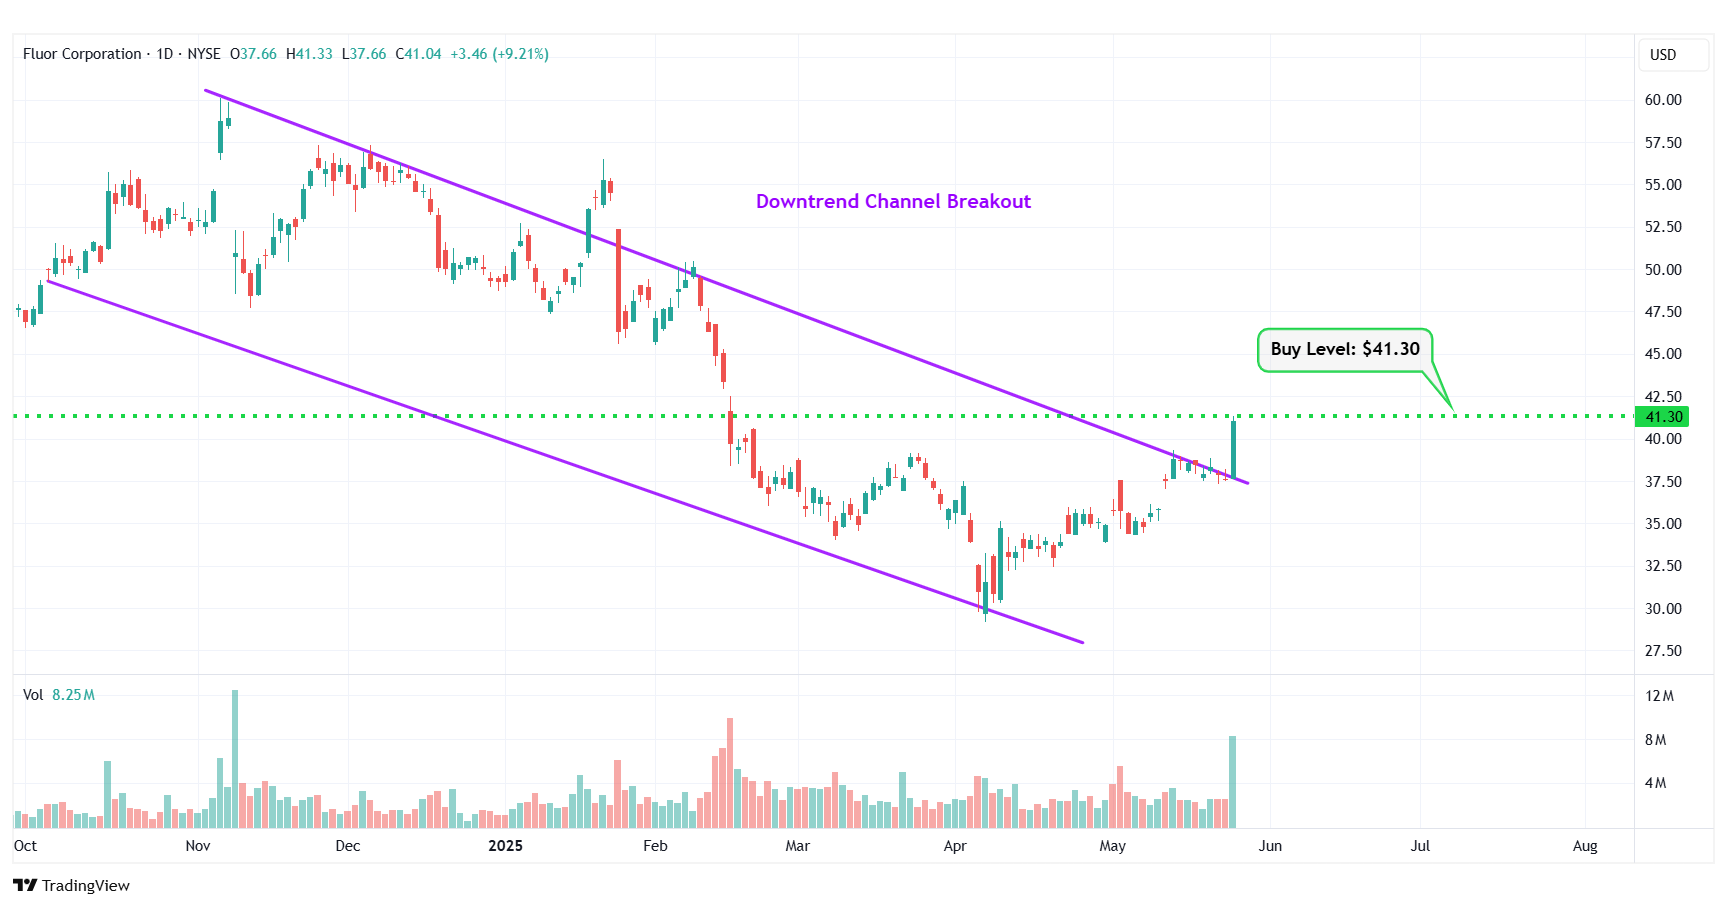
FLR – Downtrend Channel Breakout
#6 Oklo Inc. (NYSE: OKLO)
Sector: Utilities • Utilities – Regulated Electric
Reason: Symmetrical Triangle Pattern Breakout
A symmetrical triangle is a chart pattern formed by two converging trend lines connecting a series of sequential peaks and troughs. These two lines result in the formation of a triangle that appears to be symmetrical.
A symmetrical triangle pattern is usually formed when there is indecision in the price movements and there is uncertainty among the buyers and sellers. This chart pattern represents a period of consolidation before the price breaks out or breaks down. In case a breakout occurs from the upper trend line, it is a strong bullish indication as it signifies the start of a new bullish trend.
Buy Level(s): The stock has currently broken out of a symmetrical triangle pattern. However, the ideal buy level for OKLO is if the stock closes above the immediate resistance level of $50.20. This is marked in the chart below as a green color dotted line.
Daily chart – OKLO
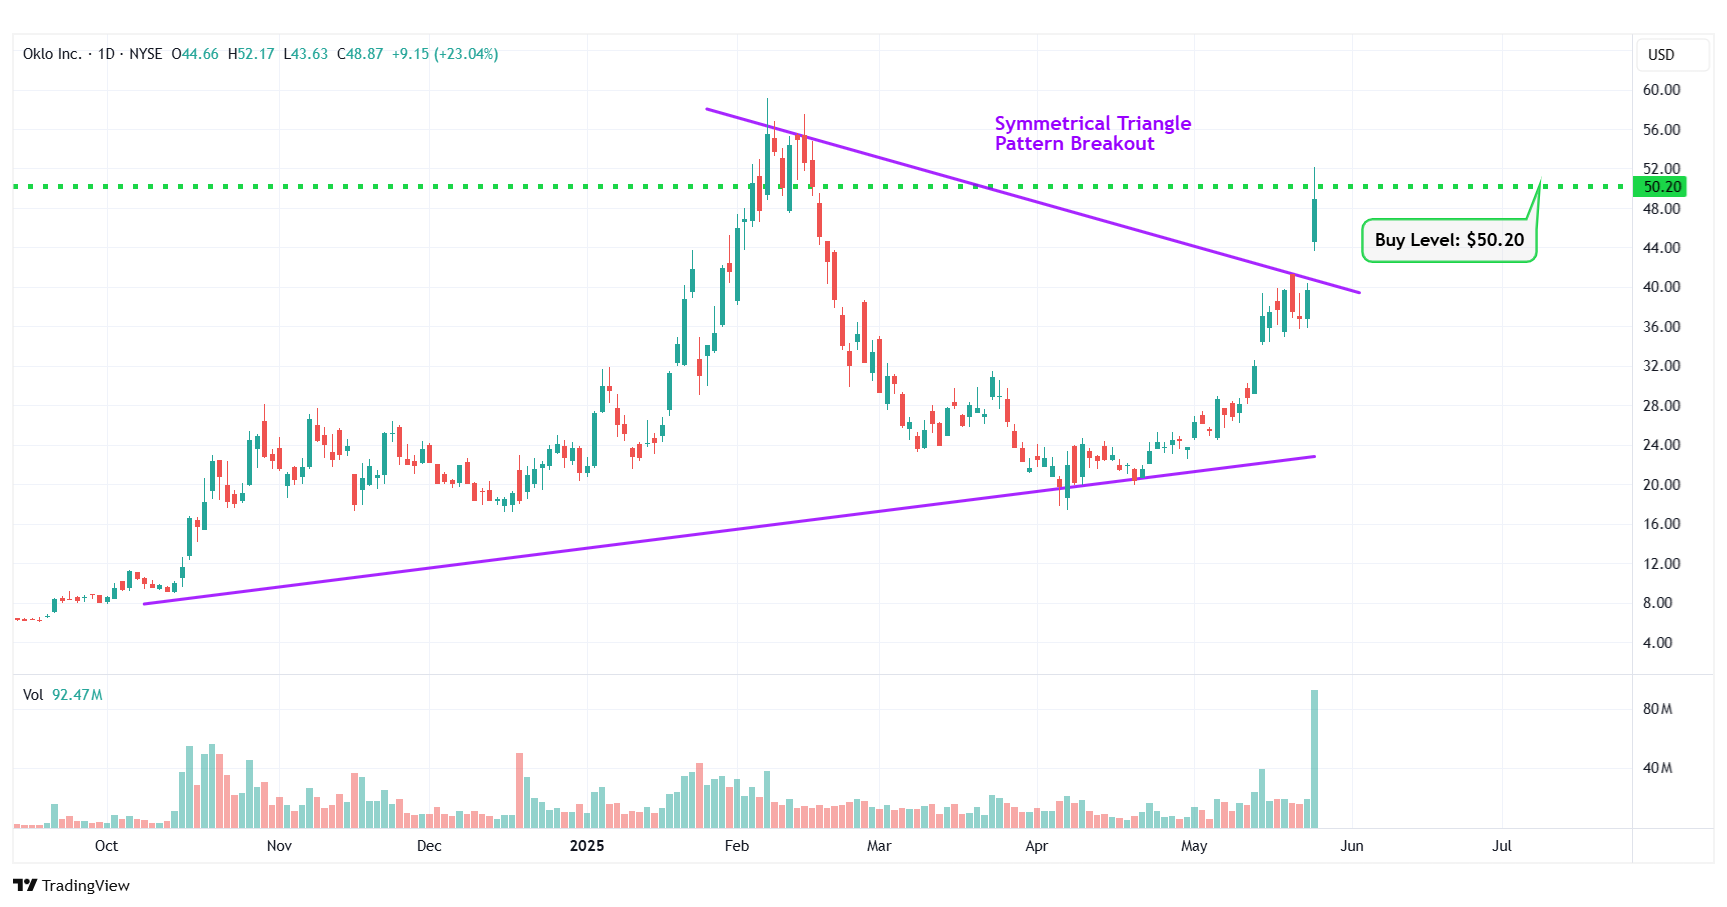
OKLO – Symmetrical Triangle Pattern Breakout
#7 Informatica Inc. (NYSE: INFA)
Sector: Technology • Software – Infrastructure
Reason: Falling Wedge Pattern Breakout
A falling wedge pattern is formed by joining two downward-sloping, converging trendlines having a contracting range. The pattern appears to be wide at the top and continues to contract as prices fall. A breakout from a falling wedge pattern can indicate either reversal or continuation depending on where the pattern appeared in the trend.
A stock that has broken out of a falling wedge pattern would have gained momentum and would have the potential to move higher.
Buy Level(s): The stock has currently broken out of a falling wedge pattern. However, the ideal buy level for INFA is above the nearest resistance level of $23.20. This is marked in the chart below as a green color dotted line.
Daily chart – INFA
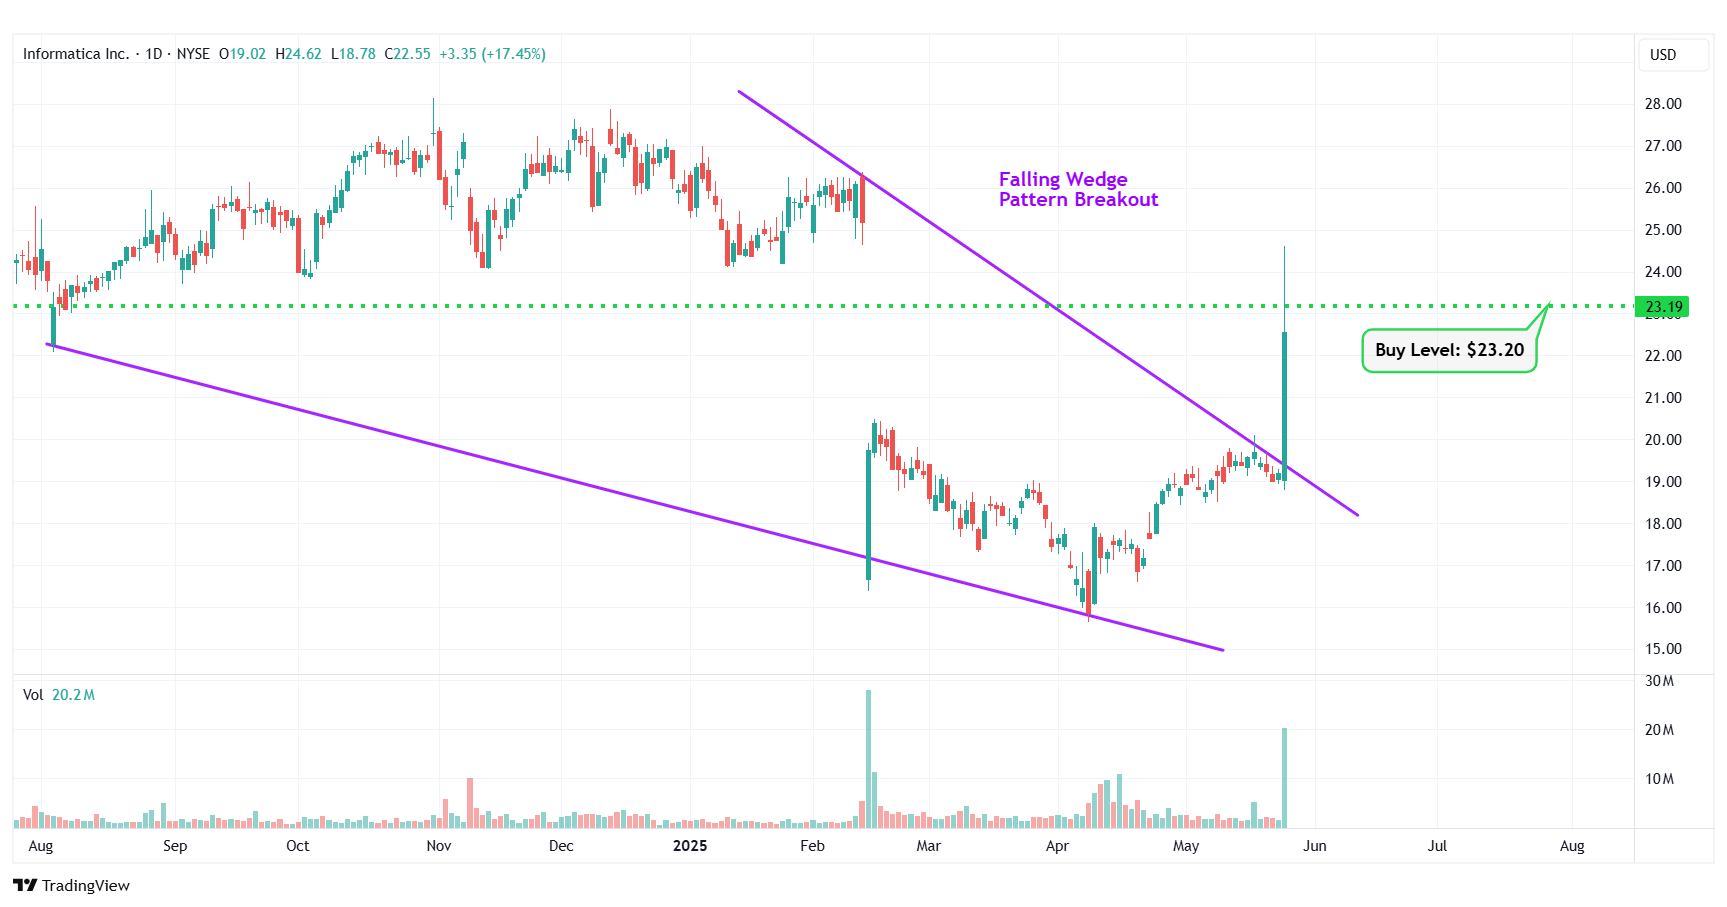
INFA – Falling Wedge Pattern Breakout
#8 Merus N.V (NASDAQ: MRUS)
Sector: Healthcare • Biotechnology
Reason: Downtrend Channel Breakout
A downtrend or descending channel is the price action contained between downward sloping parallel lines. It is formed by two lines that are drawn by connecting the lower highs and lower lows of a stock’s price. Even though this is typically a bearish pattern, a breakout from the upper rail of this pattern is considered a good bullish indication.
Buy Level(s): The daily chart shows that the stock has currently broken out of a downtrend channel. However, there is a near-term resistance level for the stock. Hence, the ideal buy level for MRUS is if the stock has a daily close above $55.50. This is marked in the chart below as a green color dotted line.
Daily chart – MRUS
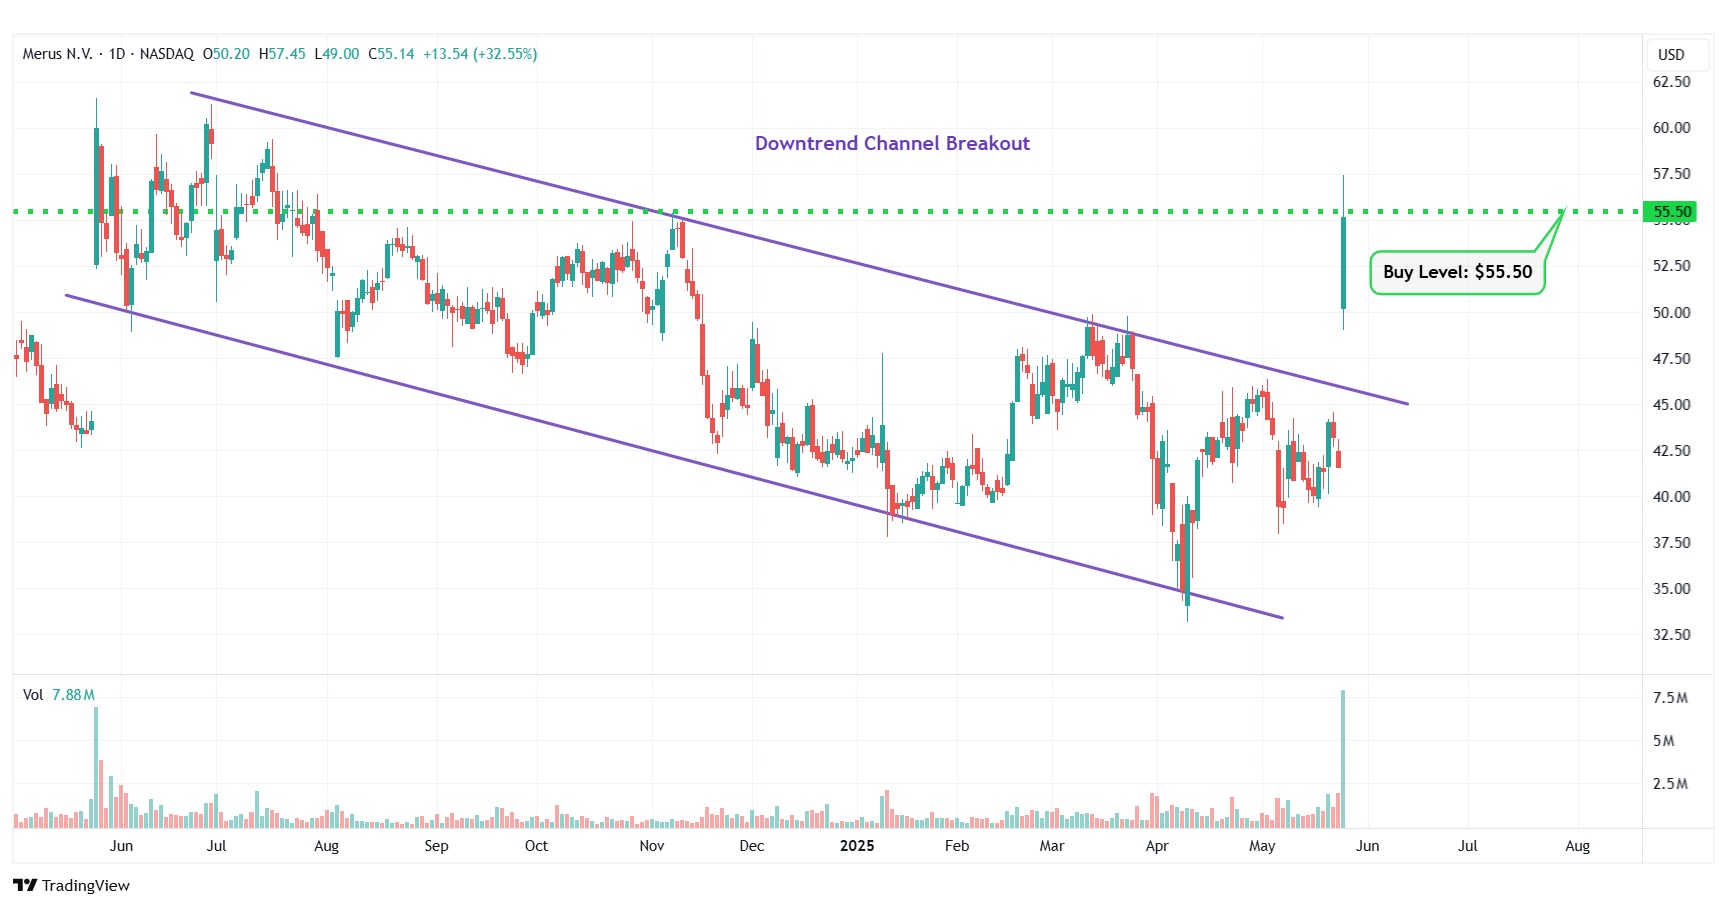
MRUS – Downtrend Channel Breakout
#9 Quantum Computing Inc. (NASDAQ: QUBT)
Sector: Technology • Computer Hardware
Reason: Symmetrical Triangle Pattern Breakout
A symmetrical triangle is a chart pattern formed by two converging trend lines connecting a series of sequential peaks and troughs. These two lines result in the formation of a triangle that appears to be symmetrical.
A symmetrical triangle pattern is usually formed when there is indecision in the price movements and there is uncertainty among the buyers and sellers. This chart pattern represents a period of consolidation before the price breaks out or breaks down. In case a breakout occurs from the upper trend line, it is a strong bullish indication as it signifies the start of a new bullish trend.
Buy Level(s): The stock has currently broken out of a symmetrical triangle pattern. However, the ideal buy level for QUBT is if the stock closes above the immediate resistance level of $14.15. This is marked in the chart below as a green color dotted line.
Daily chart – QUBT
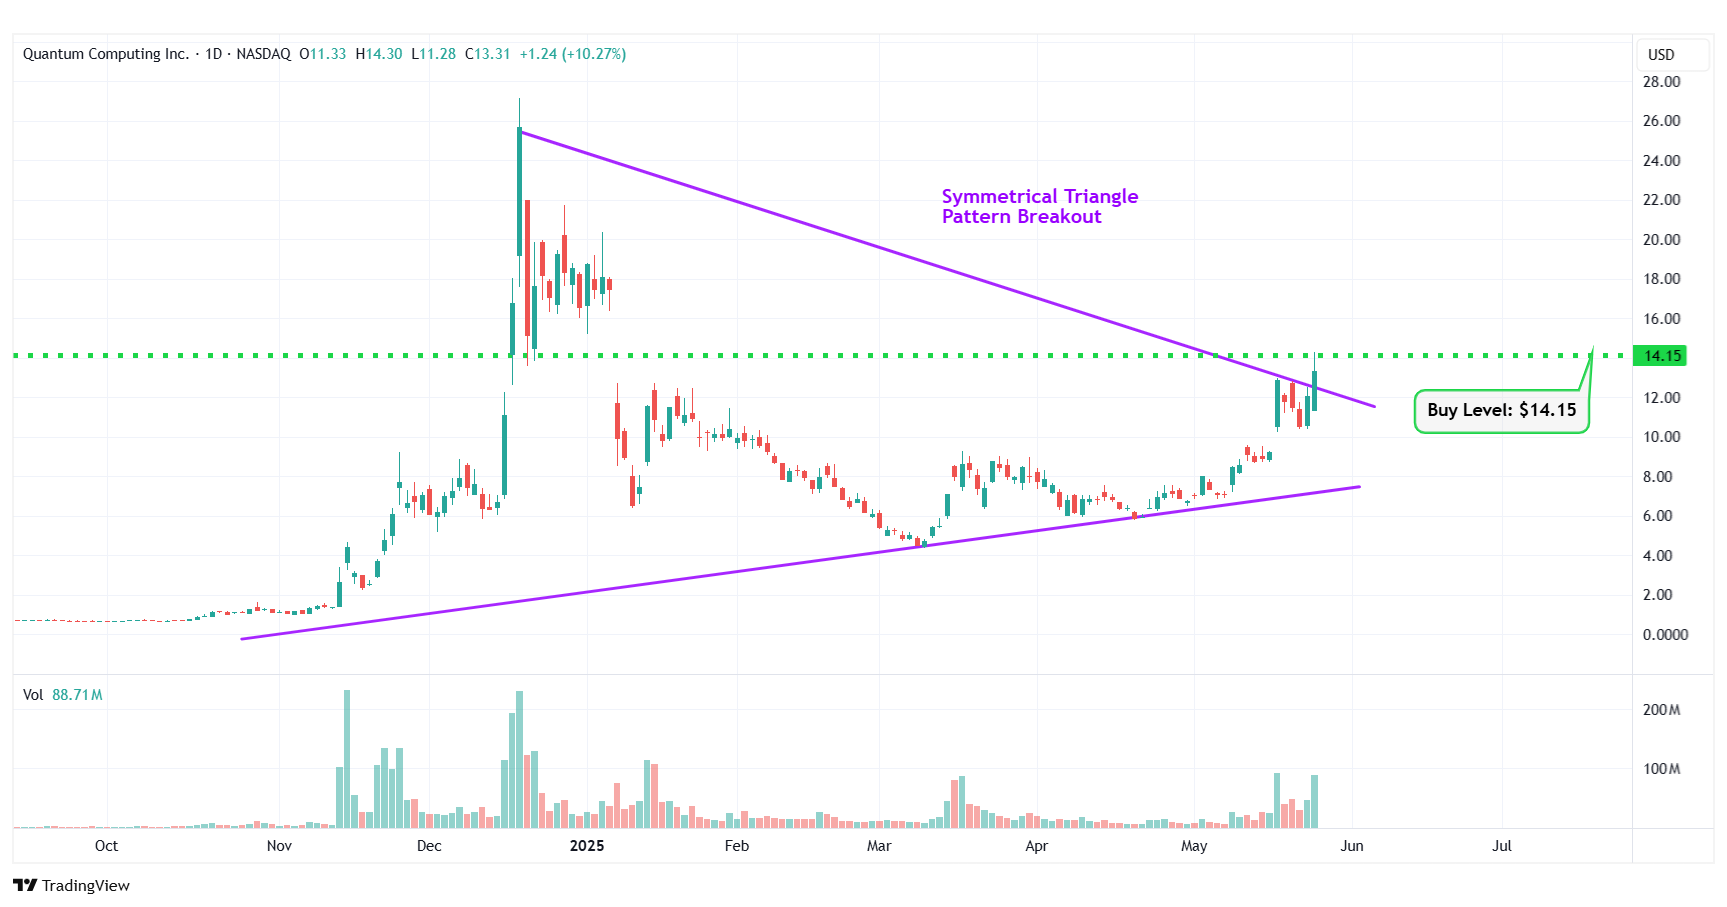
QUBT – Symmetrical Triangle Pattern Breakout
#10 Peloton Interactive Inc. (NASDAQ: PTON)
Sector: Consumer Cyclical • Leisure
Reason: Downtrend Channel Breakout
A downtrend or descending channel is the price action contained between downward sloping parallel lines. It is formed by two lines that are drawn by connecting the lower highs and lower lows of a stock’s price. Even though this is typically a bearish pattern, a breakout from the upper rail of this pattern is considered a good bullish indication.
Buy Level(s): The daily chart shows that the stock has currently broken out of a downtrend channel. However, there is a near-term resistance level for the stock. Hence, the ideal buy level for PTON is if the stock has a daily close above $7.70. This is marked in the chart below as a green color dotted line.
Daily chart – PTON
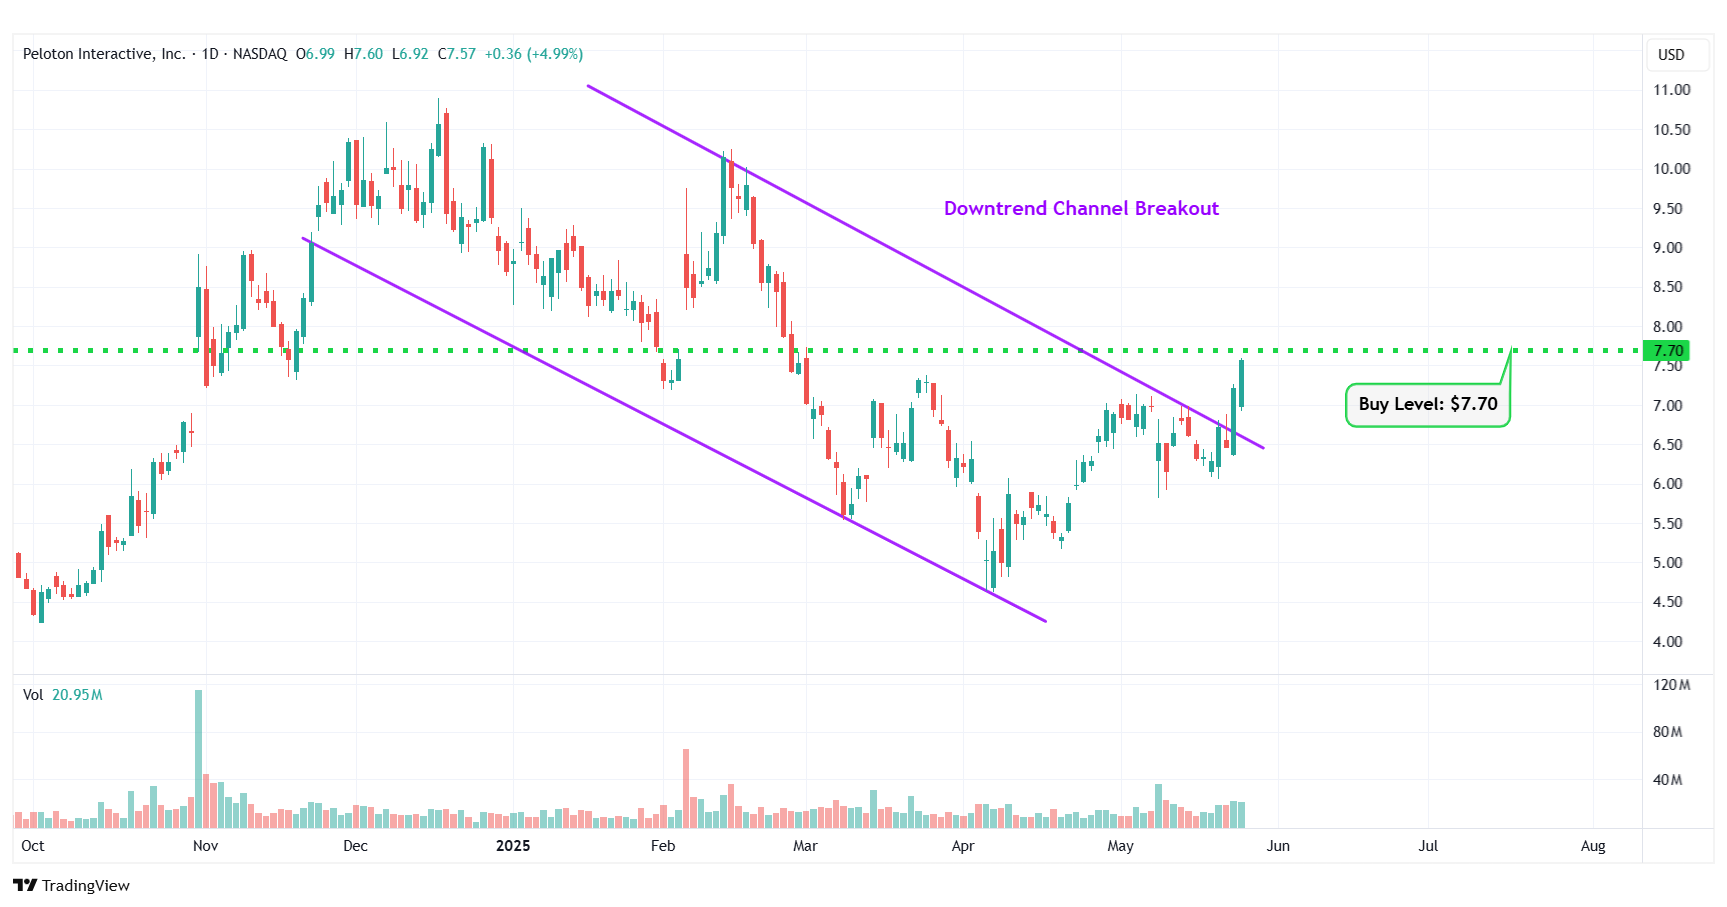
PTON – Downtrend Channel Breakout
Happy Trading!
Trades of The Day Research Team
Imagine having 12 new monthly income checks, carrying the potential of up to 21% yields.This is possible because of a tested strategy to get paid out regularly, like a paycheck. For over a decade, I have helped more than 26,000 investors secure 12 new monthly payouts. Meaning, you know exactly how much you'll make every month... Because of some stocks that pay us 8%,13.4%, and even 21.6% yields. See it for yourself here.
Source: Trades of the Day
