Pony AI Inc. (NASDAQ: PONY) seems poised for a price surge based on its latest charts. The company engages in autonomous mobility in the People’s Republic of China and the United States. The company provides robotruck services, such as transportation services to the logistics platforms. It also offers robotaxi services, including a suite of AV engineering solutions.
Bullish Indications
#1 Falling Wedge Pattern Breakout: As you can see from the daily chart, the stock had been forming a falling wedge pattern for the past few weeks. These are marked as purple color lines. The stock has currently broken out of the falling wedge pattern with a high volume and looks poised for an upmove. A falling wedge is a bullish pattern and a breakout from it implies that the stock may move higher in the short term.

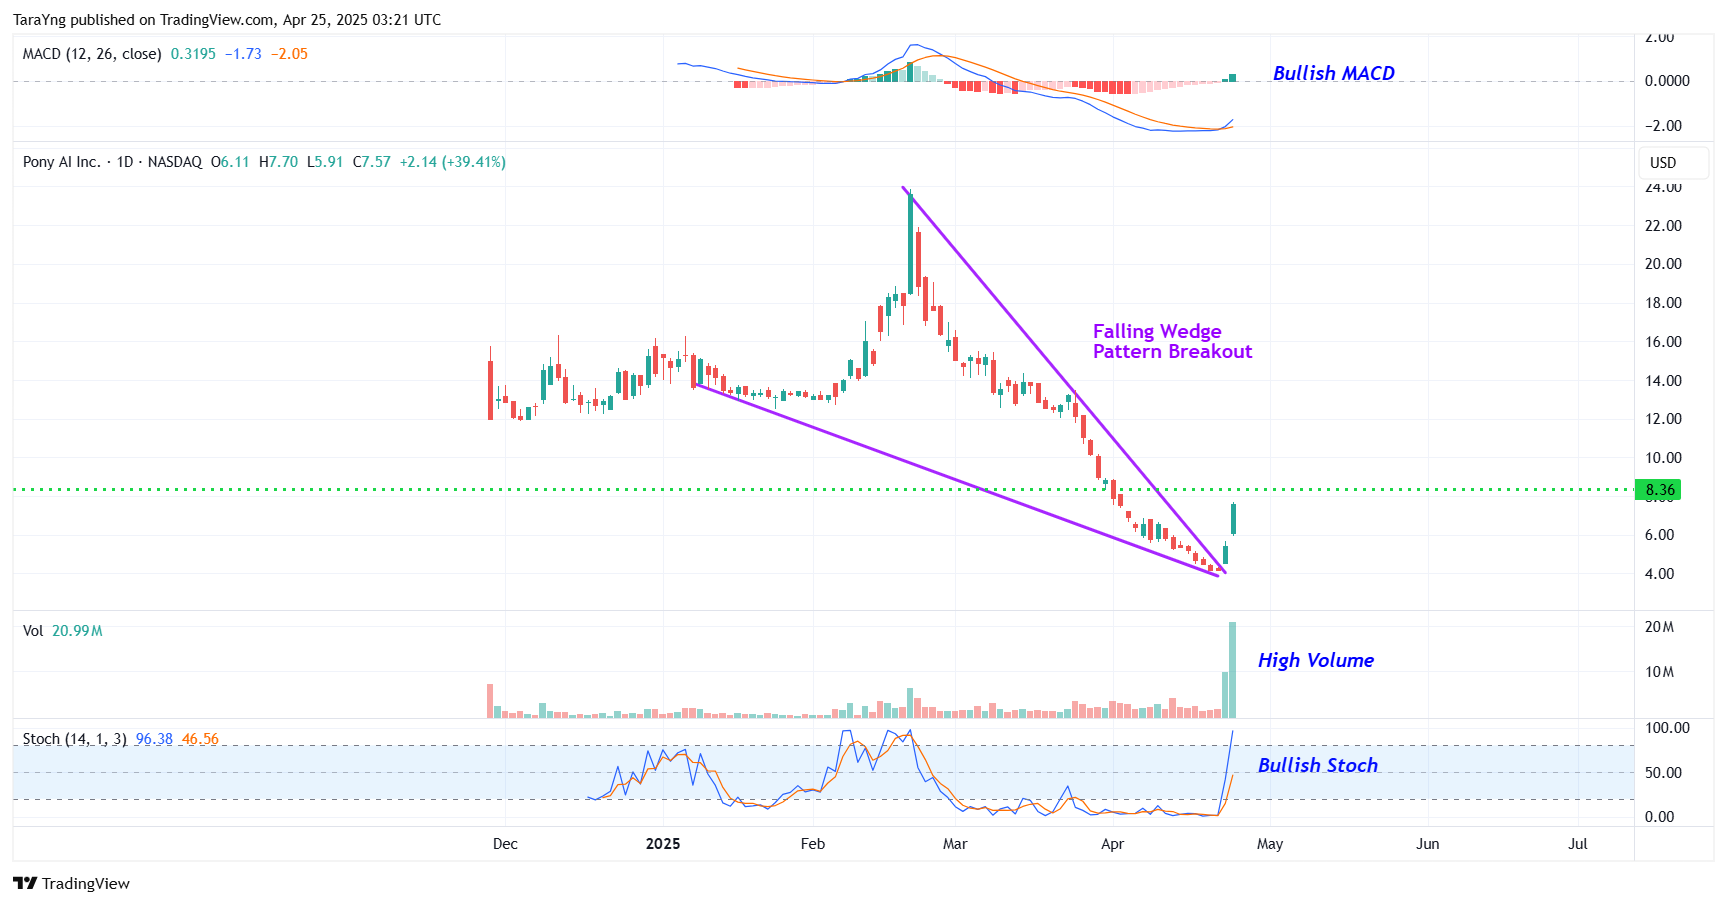
PONY – Daily Chart
#2 MACD Above Signal Line: In the daily chart, the MACD line (light blue color) is currently above the MACD signal line (orange color) which is typically considered bullish.
#3 Bullish Stoch: The %K line is above the %D line of the stochastic in the daily chart, indicating possible bullishness.
#4 Above Support Area: As you can see from the weekly chart, the stock has currently moved up from a support level. This level is marked as a pink color dotted line. This looks like a good area for the stock to move higher.
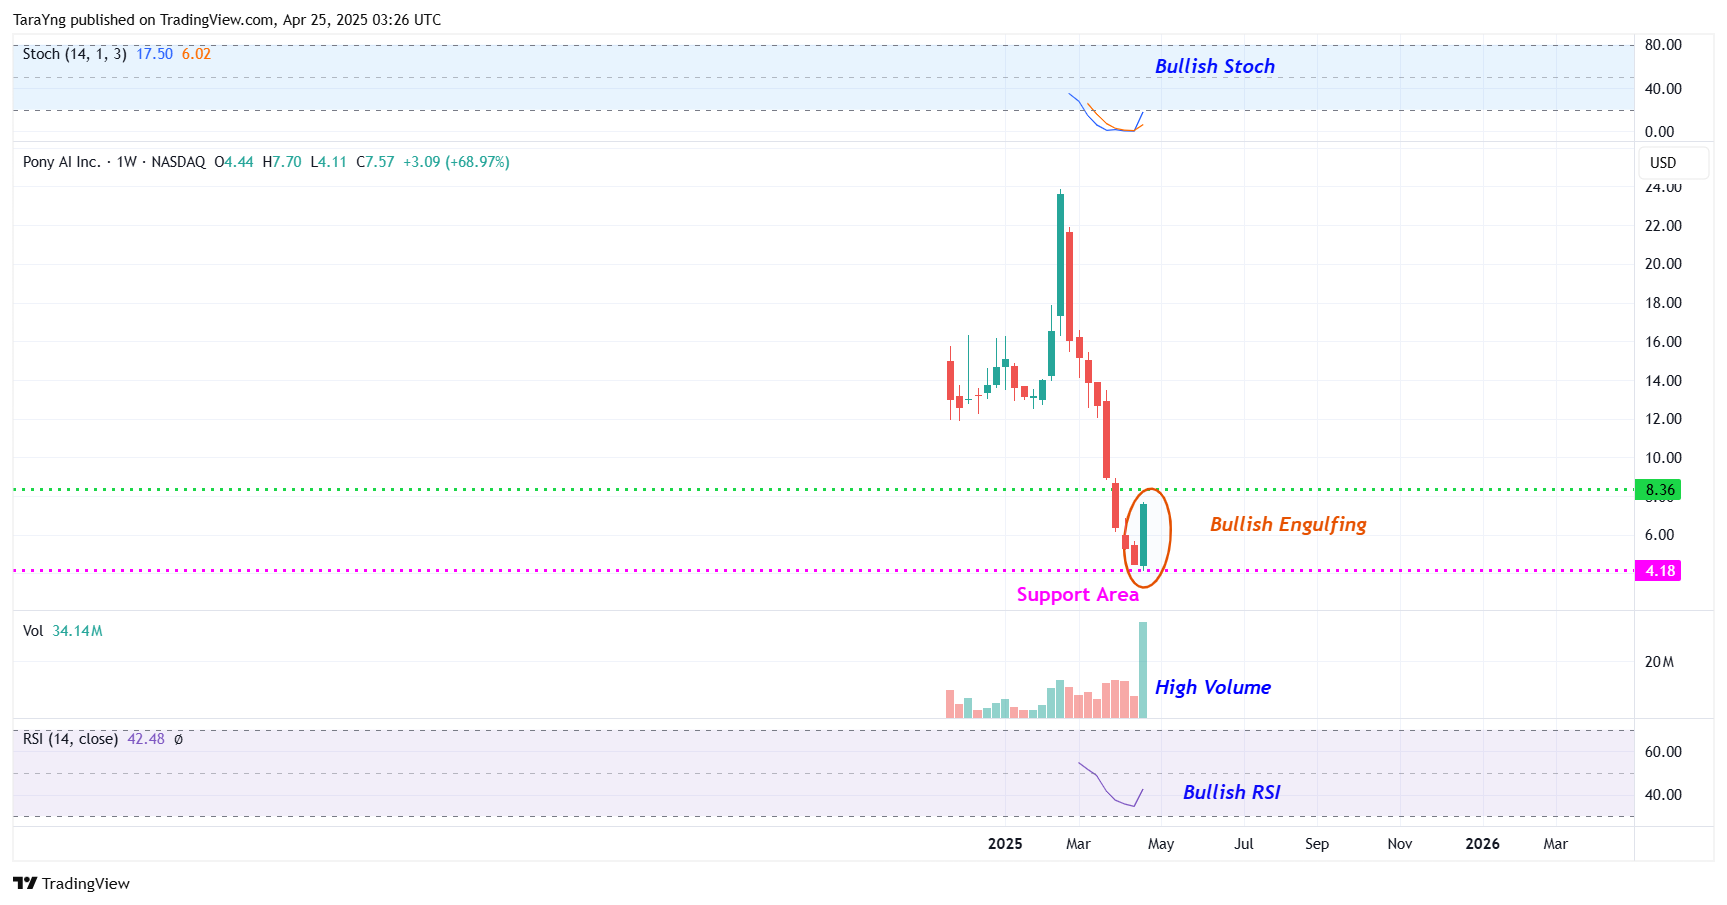
PONY – Weekly Chart
#5 %K above %D: The %K (blue) line of stochastic has currently crossed above the %D (Orange) line in the weekly chart as well, and is also moving higher from oversold levels. This is a possible bullish indication.
#6 Bullish Engulfing Candlestick Pattern: The weekly chart shows that the stock has formed a bullish engulfing candlestick pattern. This is marked as an orange color ellipse in the weekly chart. A bullish engulfing candlestick pattern is a two-candle reversal pattern. It appears in a downtrend and consists of a smaller bearish candle followed by a larger bullish candle, and the bullish candle completely engulfs the real body of the bearish candle. It signals a potential trend reversal from bearish to bullish.
#7 Bullish RSI: In the weekly chart, the RSI is currently moving higher from oversold levels. This is a possible bullish sign.
Recommended Trade (based on the charts)
Buy Levels: If you want to get in on this trade, you can purchase shares of PONY above the price of around $8.10.
TP: Our target prices are $12.50 and $15.00 in the next 3-6 months.
SL: To limit risk, place stop-loss at $5.90. Note that the stop-loss is on a closing basis.
Our target potential upside is 54% to 85% in the next 3 to 6 months.
For a risk of $2.20, our target rewards are $4.40 and $6.90. This is a nearly 1:2 and 1:3 risk-reward trade.
In other words, this trade offers nearly 2x to 3x more potential upside than downside.
Risks to Consider
The stock may reverse its overall trend if it breaks down from the falling wedge pattern with a high volume. The sell-off of the stock could also be triggered in case of any negative news, overall weakness in the market, or any regulatory changes in the sector.
Happy Trading!
Tara
Imagine having 12 new monthly income checks, carrying the potential of up to 21% yields.This is possible because of a tested strategy to get paid out regularly, like a paycheck. For over a decade, I have helped more than 26,000 investors secure 12 new monthly payouts. Meaning, you know exactly how much you'll make every month... Because of some stocks that pay us 8%,13.4%, and even 21.6% yields. See it for yourself here.
Source: Trades of the Day
