
First Solar, Inc. (NASDAQ: FSLR) seems poised for a price surge based on its latest charts. The company provides photovoltaic (PV) solar energy solutions in the United States, France, India, Chile, and internationally. The company manufactures and sells PV solar modules with a thin film semiconductor technology and also designs, manufactures, and sells cadmium telluride solar modules that convert sunlight into electricity.
Bullish Indications
#1 Downtrend Channel: As you can see from the daily chart, the stock has been trading within a downtrend channel during the past few months. This is marked in the daily chart in purple color. Currently, the stock is moving higher within the channel with a high volume. Once the stock breaks out from a downtrend channel, it has the potential to move further up.
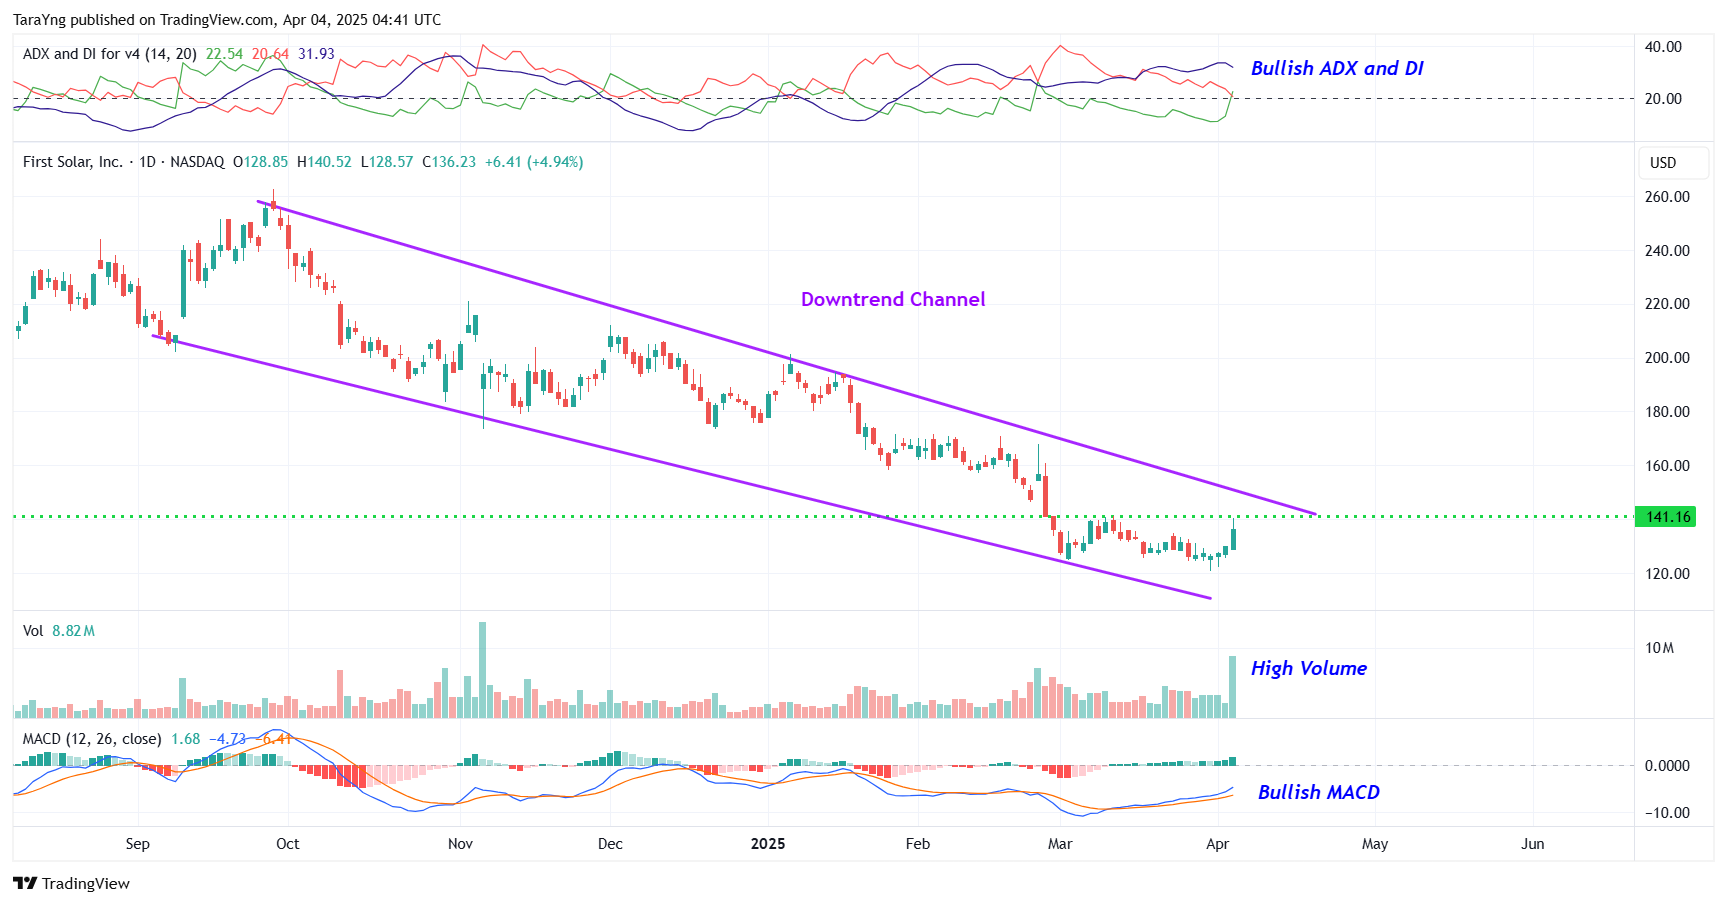
FSLR – Daily Chart
#2 MACD Above Signal Line: In the daily chart, the MACD line (light blue color) is currently above the MACD signal line (orange color) which is typically considered bullish.
#3 Bullish ADX: The ADX indicator shows that the +DI line is currently above the –DI line and the ADX line has started to move up from below the –DI and +DI lines. This indicates possible bullishness.
#4 Above Support Area: As you can see from the weekly chart, the stock has currently moved up from a support level. This level is marked as a pink color dotted line. This looks like a good area for the stock to move higher.
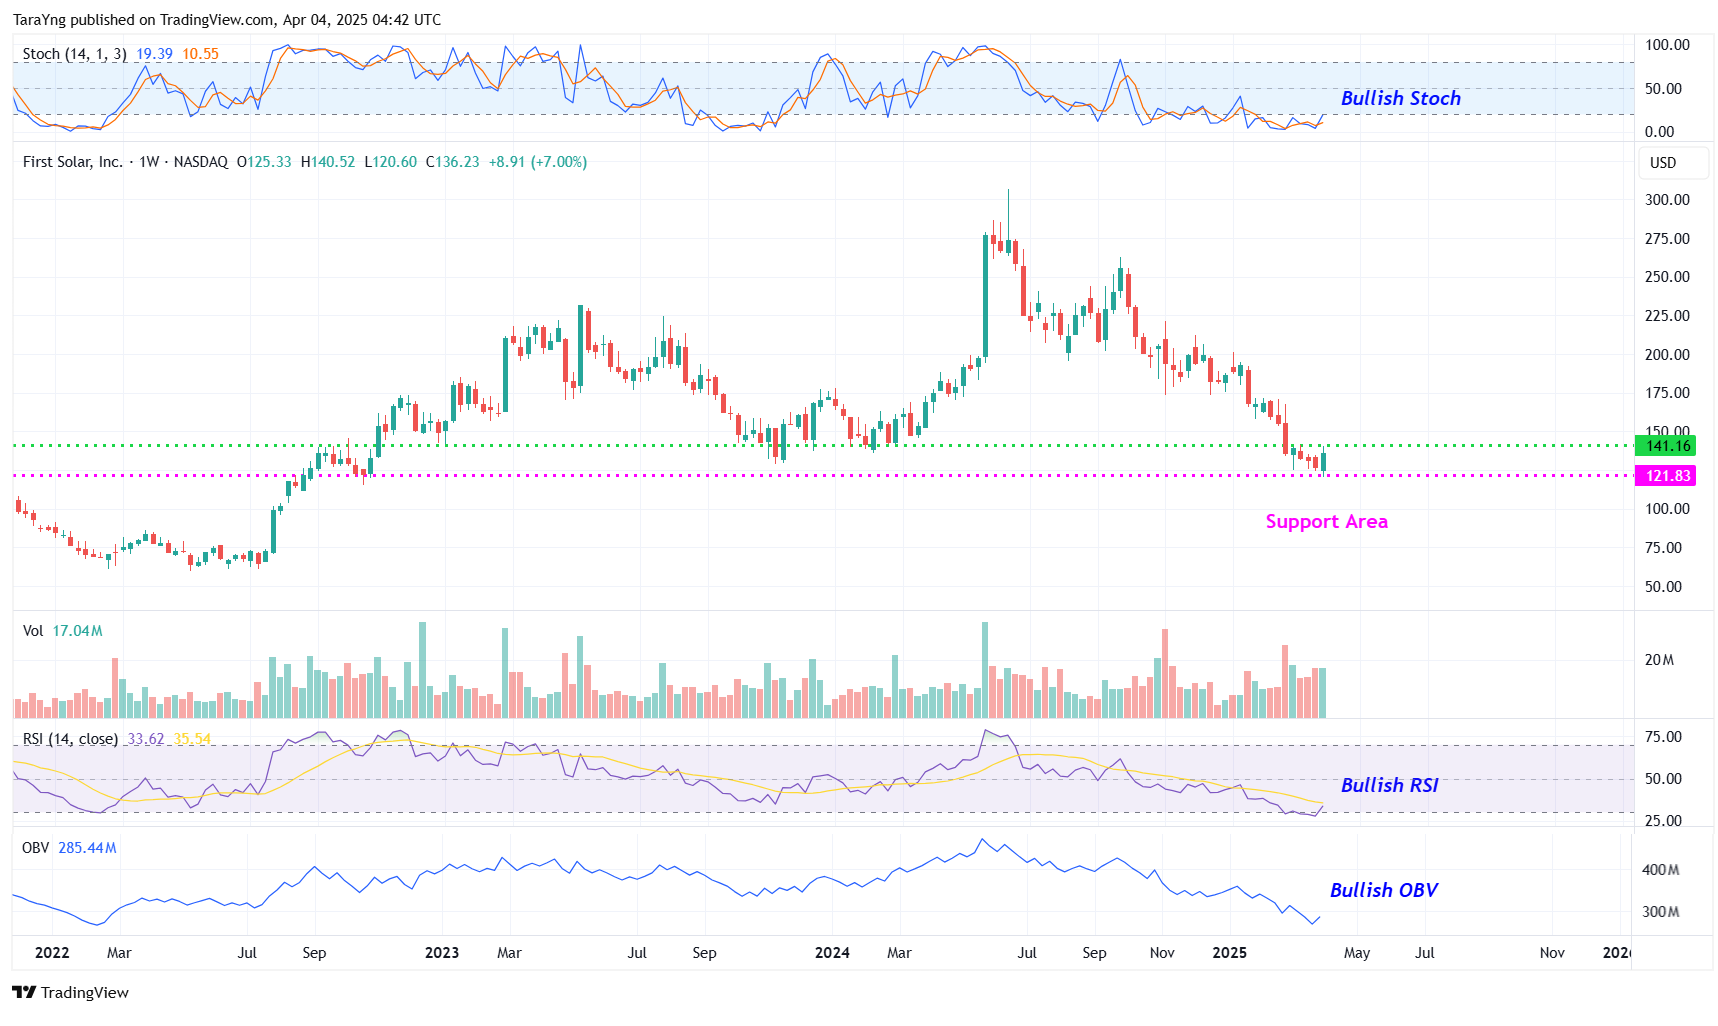
FSLR – Weekly Chart
#5 %K above %D: The %K (blue) line of stochastic has currently crossed above the %D (Orange) line in the weekly chart and is also moving higher from oversold levels. This is a possible bullish indication.
#6 Bullish RSI: In the weekly chart, the RSI is moving higher from oversold levels. This is a possible sign of a bullish reversal.
#7 Positive OBV: The weekly chart shows that the OBV indicator is currently rising. OBV rises when volume on up weeks outpaces volume on down weeks. A rising OBV typically reflects positive volume pressure that can lead to higher prices.
Recommended Trade (based on the charts)
Buy Levels: If you want to get in on this trade, you can purchase shares of FSLR above the price of around $141.20.
TP: Our target prices are $155.00 and $168.00 in the next 3-6 months.
SL: To limit risk, place stop-loss at $133.00. Note that the stop-loss is on a closing basis.
Our target potential upside is 10% to 19% in the next 3 to 6 months.
For a risk of $8.20, our target rewards are $13.80 and $26.80. This is a nearly 1:2 and 1:3 risk-reward trade.
In other words, this trade offers nearly 2x to 3x more potential upside than downside.
Risks to Consider
The stock may reverse its overall trend if it breaks down from the trend channel with a high volume. The sell-off of the stock could also be triggered in case of any negative news, overall weakness in the market, or any regulatory changes in the sector.
Happy Trading!
Tara
To carry out Trump's Executive Order #14196 initiative, the administration will have to partner with a handful of U.S. companies that control the "reserve accounts" sitting on trillions of dollars' worth of untapped natural resources. I've spent months digging into this – and I've identified three companies that have already been granted "emergency status" and fast-track approvals. I believe their shares could skyrocket once new capital starts moving into the sector. See the three stocks that I expect to be the biggest winners as this plan rolls.
Source: Trades of the Day
