Flutter Entertainment plc (NYSE: FLUT) seems poised for a price surge based on its latest charts. The company operates as a sports betting and gaming company. It provides sportsbooks; iGaming products, such as blackjack, roulette, slot machines, poker, and rummy, as well as lottery products; and sports betting products.
The company offers sports betting and gaming services through fanduel.com, tvg.com, betfair.com, paddypower.com, and paddypower.ie, sportsbet.com.au, pokerstars.com, betfair.com, sisal.it, jungleegames.com, maxbet.rs, and adjarabet.com websites under the FanDuel, Sky Betting & Gaming, Sportsbet, PokerStars, Paddy Power, Sisal, tombola, Betfair, TVG, Junglee Games, Adjarabet, and MaxBet brands, as well as live poker tours and events.

Bullish Indications
#1 Falling Wedge Pattern: As you can see from the daily chart, the stock has been forming a falling wedge pattern for the past few weeks. These are marked as purple color lines. The stock currently looks poised for a breakout of the falling wedge pattern. A falling wedge is a bullish pattern and a breakout from it implies that the stock may move higher in the short term.
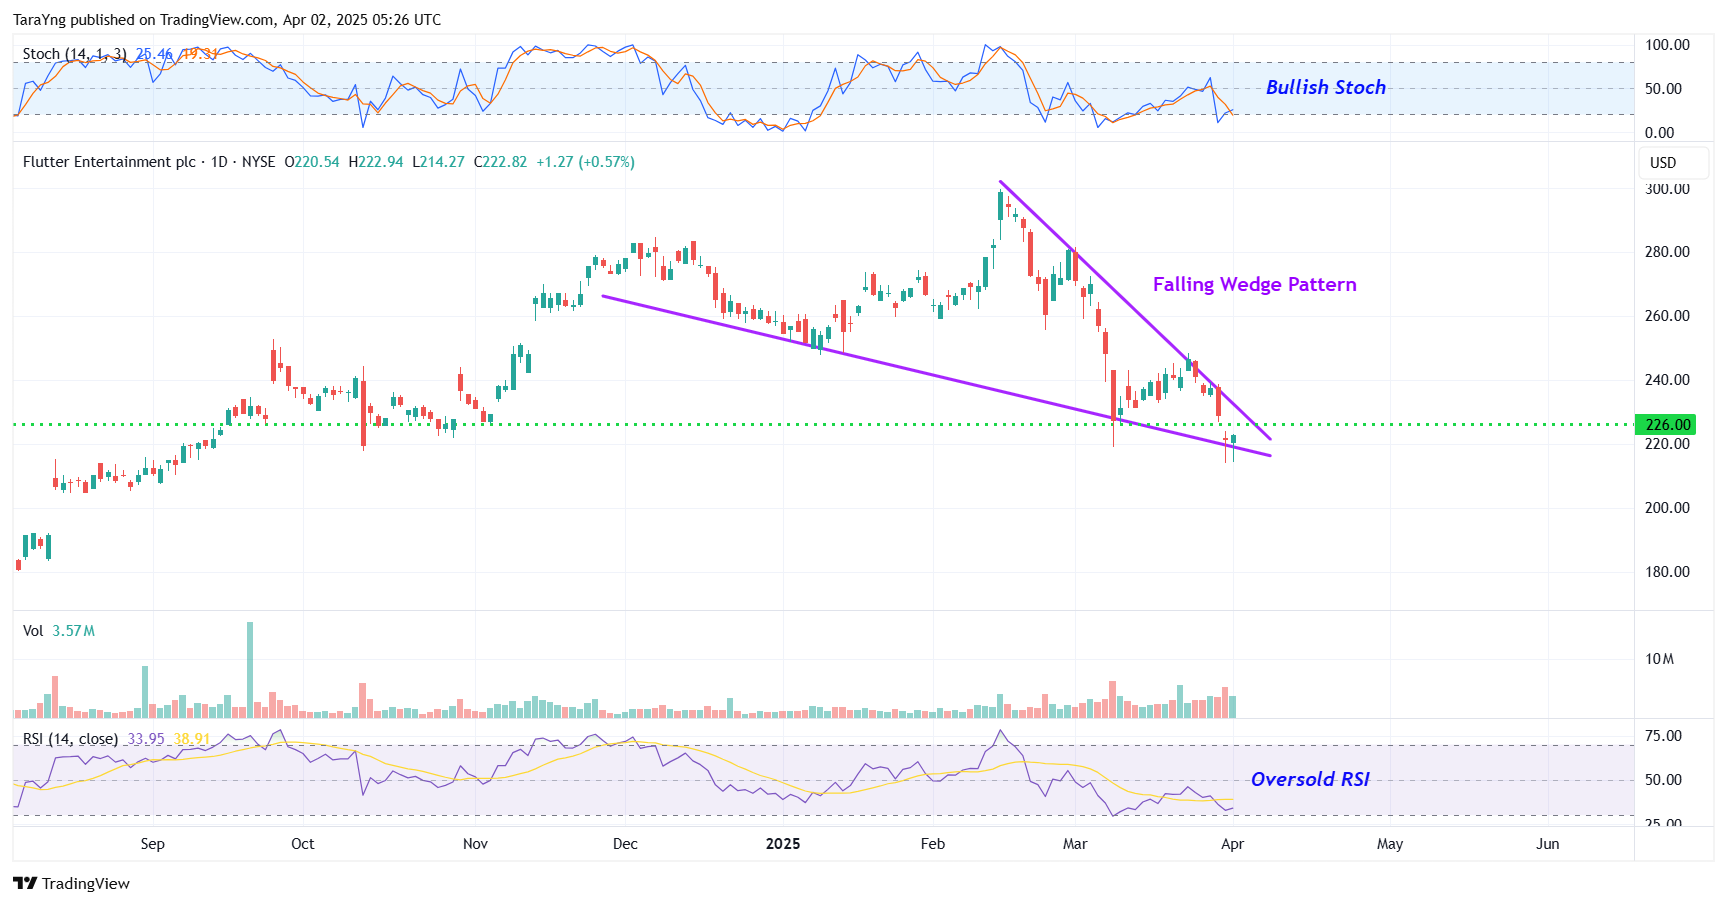
FLUT – Daily Chart
#2 Bullish Stoch: The %K (blue) line of stochastic has currently crossed above the %D (Orange) line in the daily chart and is also moving higher from oversold levels. This is a possible bullish indication.
#3 Oversold RSI: The RSI is currently moving higher after reaching oversold levels in the daily chart. This indicates possible bullishness.
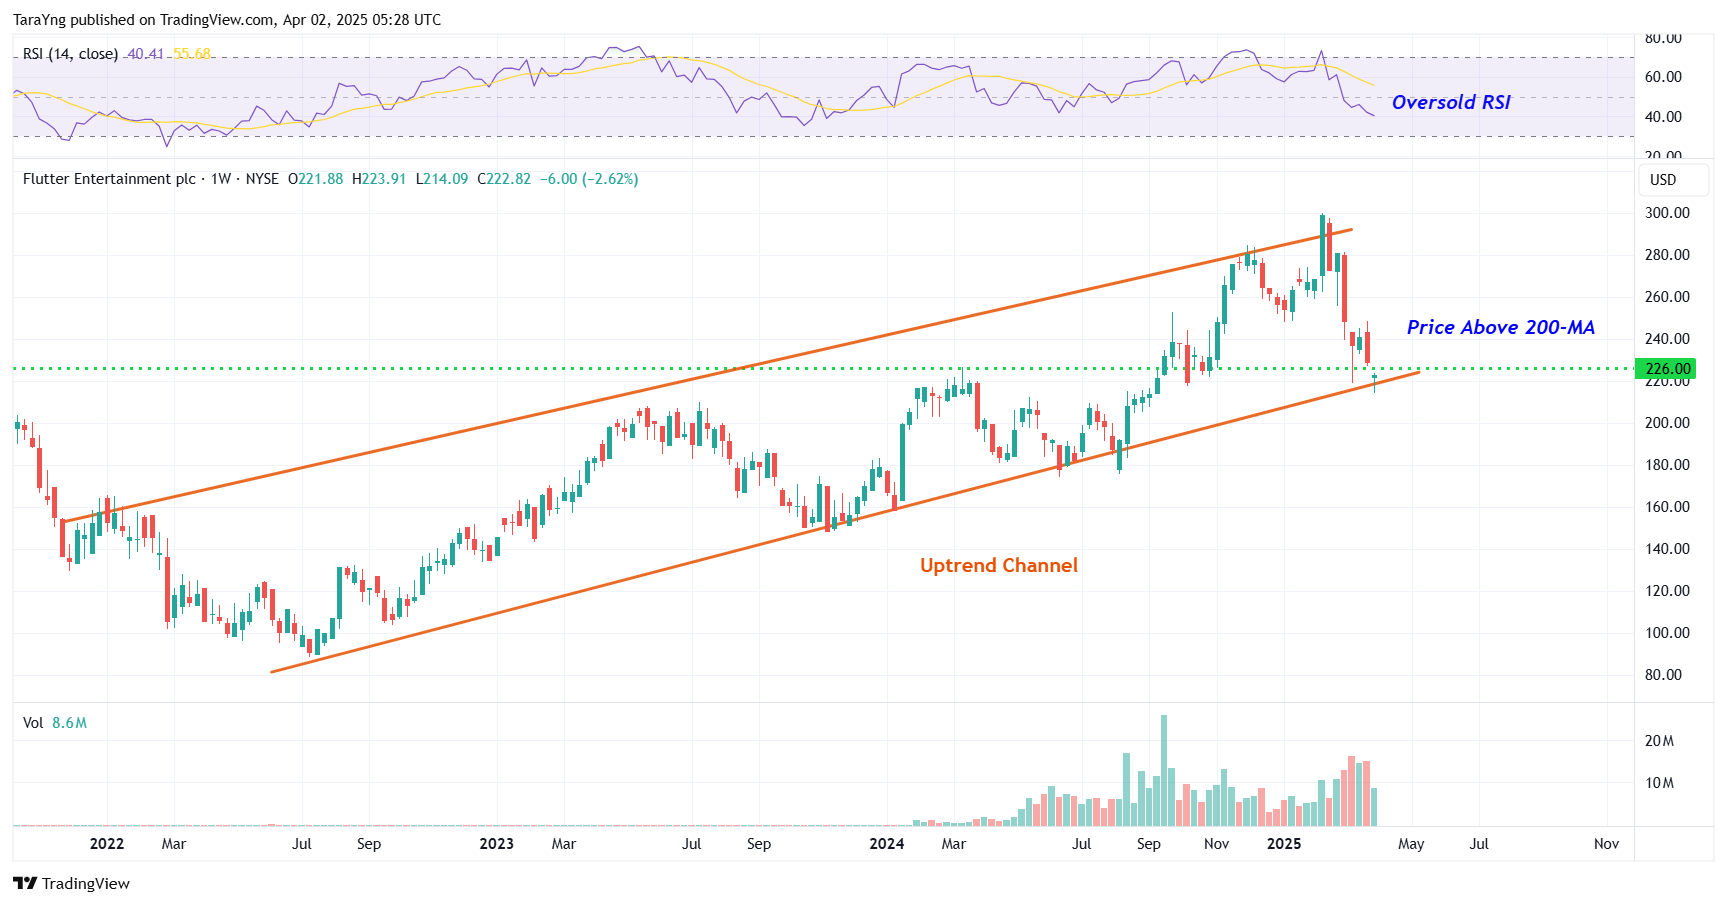
#4 Uptrend Channel: As you can see from the weekly chart, the stock has been trading within an uptrend channel for the past several months. This is marked in orange lines on the chart. The stock has currently taken support at the lower rail of the uptrend channel and looks poised to move higher. Once a stock breaks out from a channel, it has the potential to move further up. The stock is also trading above its 200-week SMA, indicating that the bulls are still in control.
FLUT – Weekly Chart
#5 Oversold RSI: In the weekly chart, the RSI is currently near oversold levels. This is a sign of a possible bullish reversal.
Recommended Trade (based on the charts)
Buy Levels: If you want to get in on this trade, you can purchase shares of FLUT above the price of around $226.00.
TP: Our target prices are $240.00 and $260.00 in the next 3-6 months.
SL: To limit risk, place stop-loss at $216.00. Note that the stop-loss is on a closing basis.
Our target potential upside is 7% to 15% in the next 3 to 6 months.
For a risk of $10.00, our target rewards are $15.00 and $34.00. This is a nearly 1:2 and 1:3 risk-reward trade.
In other words, this trade offers nearly 2x to 3x more potential upside than downside.
Risks to Consider
The stock may reverse its overall trend if it breaks down from the falling wedge pattern with a high volume. The sell-off of the stock could also be triggered in case of any negative news, overall weakness in the market, or any regulatory changes in the sector.
Happy Trading!
Tara
If you're buying rare earth or other critical mineral stocks, you're already one step behind - because we believe that political insiders in Washington are preparing to buy a whole new group of stocks, which could begin soaring 500%+ just days from now. The man once ranked in 2020 as America's #1 stock picker is doing something extraordinary and giving away the name and ticker of every single stock that could be next. Everything you need to know is here.
Source: Trades of the Day
