Picking a winning trade on a consistent basis is not simply a stroke of luck. It’s the result of calculated screening, planning, and deliberation.
With this in mind, we have started a new weekly series on our top 10 stocks to watch this week — stocks that look poised for a possible breakout in the coming days. Traders should add these stocks to their watchlist now.
The Top 10 Stocks to Watch This Week for Possible Breakouts
| Sl # | Name of the Stock | Stock Ticker | Last Close | Buy Level(s) | Reason |
| 1 | Ouster Inc. | NASDAQ: OUST | $11.05 | $11.50 | Cup and Handle Pattern Breakout |
| 2 | Jackson Financial Inc. | NYSE: JXN | $85.58 | $89.90 | Symmetrical Triangle Pattern |
| 3 | Crinetics Pharmaceuticals Inc. | NASDAQ: CRNX | $34.42 | $35.70 | Falling Wedge Pattern |
| 4 | Southwest Airlines Co. | NYSE: LUV | $34.83 | $35.40 | Symmetrical Triangle Pattern Breakout |
| 5 | C3.ai Inc. | NYSE: AI | $22.62 | $24.50 | Downtrend Channel |
| 6 | Meta Platforms Inc. | NASDAQ: META | $596.25 | $608.50 | Symmetrical Triangle Pattern |
| 7 | Luminar Technologies Inc. | NASDAQ: LAZR | $8.35 | $8.90 | Falling Wedge Pattern Breakout |
| 8 | Genius Sports Limited | NYSE: GENI | $10.41 | $10.70 | Breakout From Consolidation Area |
| 9 | Wabash National Corp. | NYSE: WNC | $11.50 | $11.80 | Falling Wedge Pattern |
| 10 | Pfizer Inc. | NYSE: PFE | $26.28 | $26.50 | Symmetrical Triangle Pattern |
Important: Typically, these trades offer a risk: reward ratio of 1:2 or 1:3 in the next 6 months, which implies 2x to 3x rewards when compared to risks. So, be sure to set your stop-loss levels and target prices accordingly to manage your risk. In addition, these trade ideas are triggered using daily closing prices, not intra-day pricing. So, if you participate in these trades, make sure that you only buy the stock once its daily close is above the recommended price level.
That said, here are the top 10 stocks to watch for a breakout, in no particular order.
#1 Ouster Inc. (NASDAQ: OUST)
Sector: Technology • Electronic Components
Reason: Cup and Handle Pattern Breakout
A Cup and Handle pattern resembles a cup with a handle, where the cup is in the shape of a “u” and the handle has a slight downward drift. A Cup and Handle pattern breakout occurs when the price breaks above the resistance level of the handle formation, signaling a potential continuation of the uptrend, and is considered a bullish continuation pattern.
A stock that has broken out of a cup and handle pattern would have the potential to move higher.
Buy Level(s): The stock has currently broken out of a cup and handle pattern. However, the ideal buy level for OUST is above the nearest resistance level of $11.50. This is marked in the chart below as a green color dotted line.
Daily chart – OUST
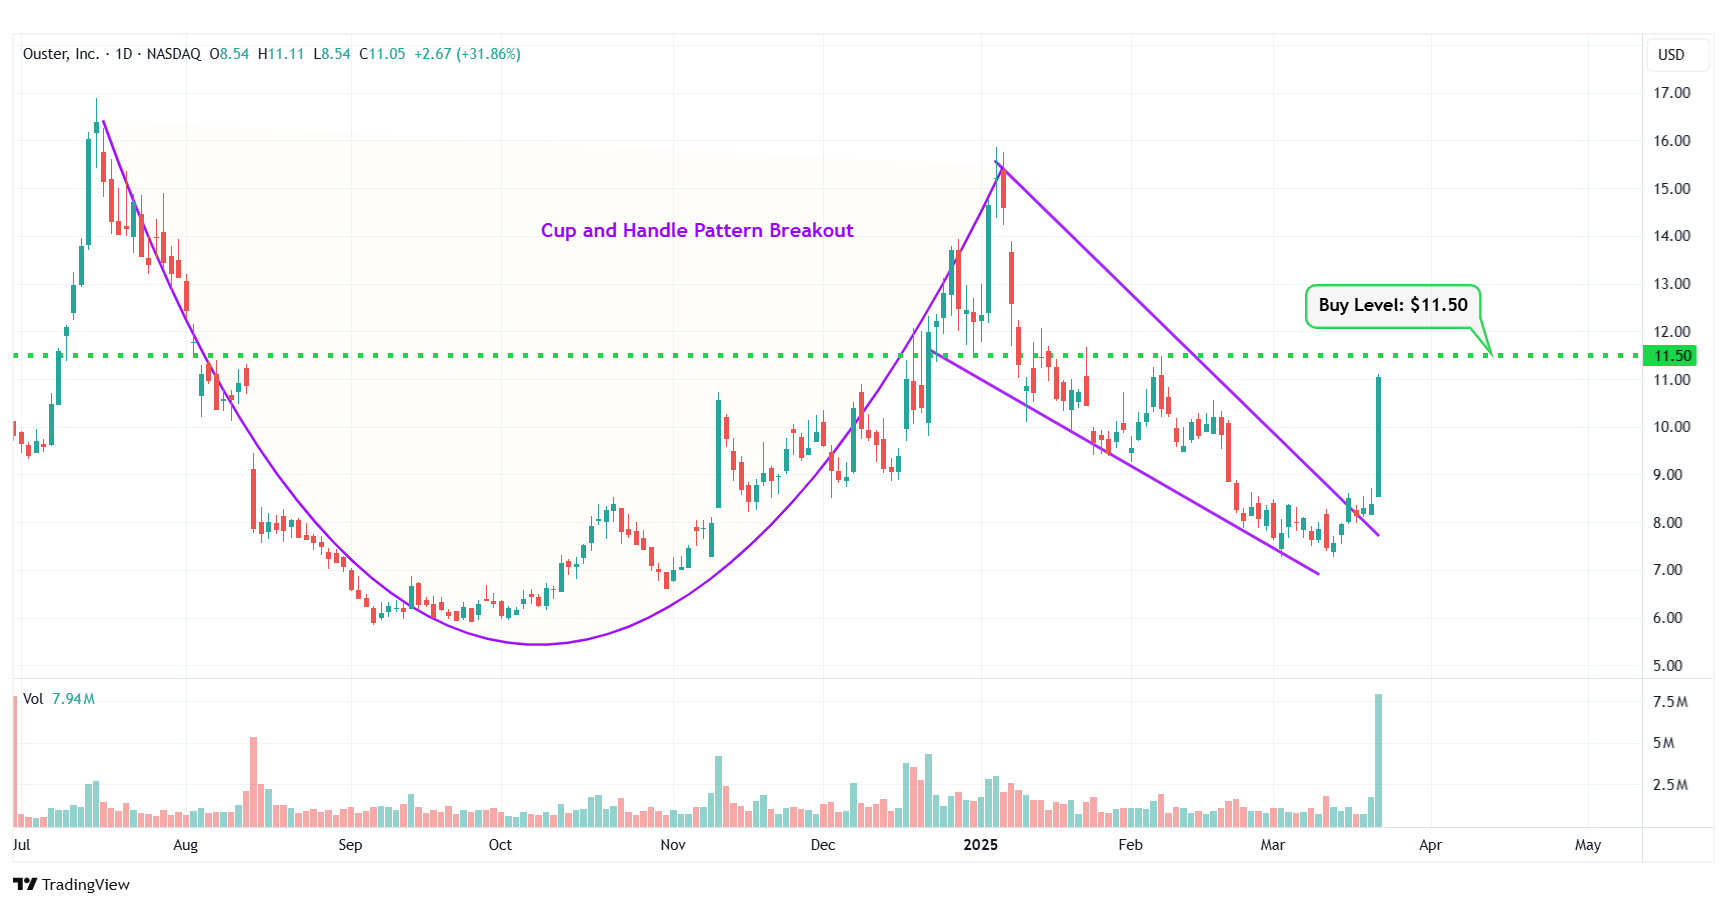
OUST – Cup and Handle Pattern Breakout
#2 Jackson Financial Inc. (NYSE: JXN)
Sector: Financial • Insurance – Life
Reason: Formation of a Symmetrical Triangle Pattern
A symmetrical triangle is a chart pattern formed by two converging trend lines connecting a series of sequential peaks and troughs. These two lines result in the formation of a triangle that appears to be symmetrical.
A symmetrical triangle pattern is usually formed when there is indecision in the price movements and there is uncertainty among the buyers and sellers. This chart pattern represents a period of consolidation before the price breaks out or breaks down. In case a breakout occurs from the upper trend line, it is a strong bullish indication as it signifies the start of a new bullish trend.
Buy Level(s): The ideal buy level for JXN is if the stock has a daily close above the breakout level of the symmetrical triangle pattern, at around $89.90. This is marked in the chart below as a green color dotted line.
Daily chart – JXN
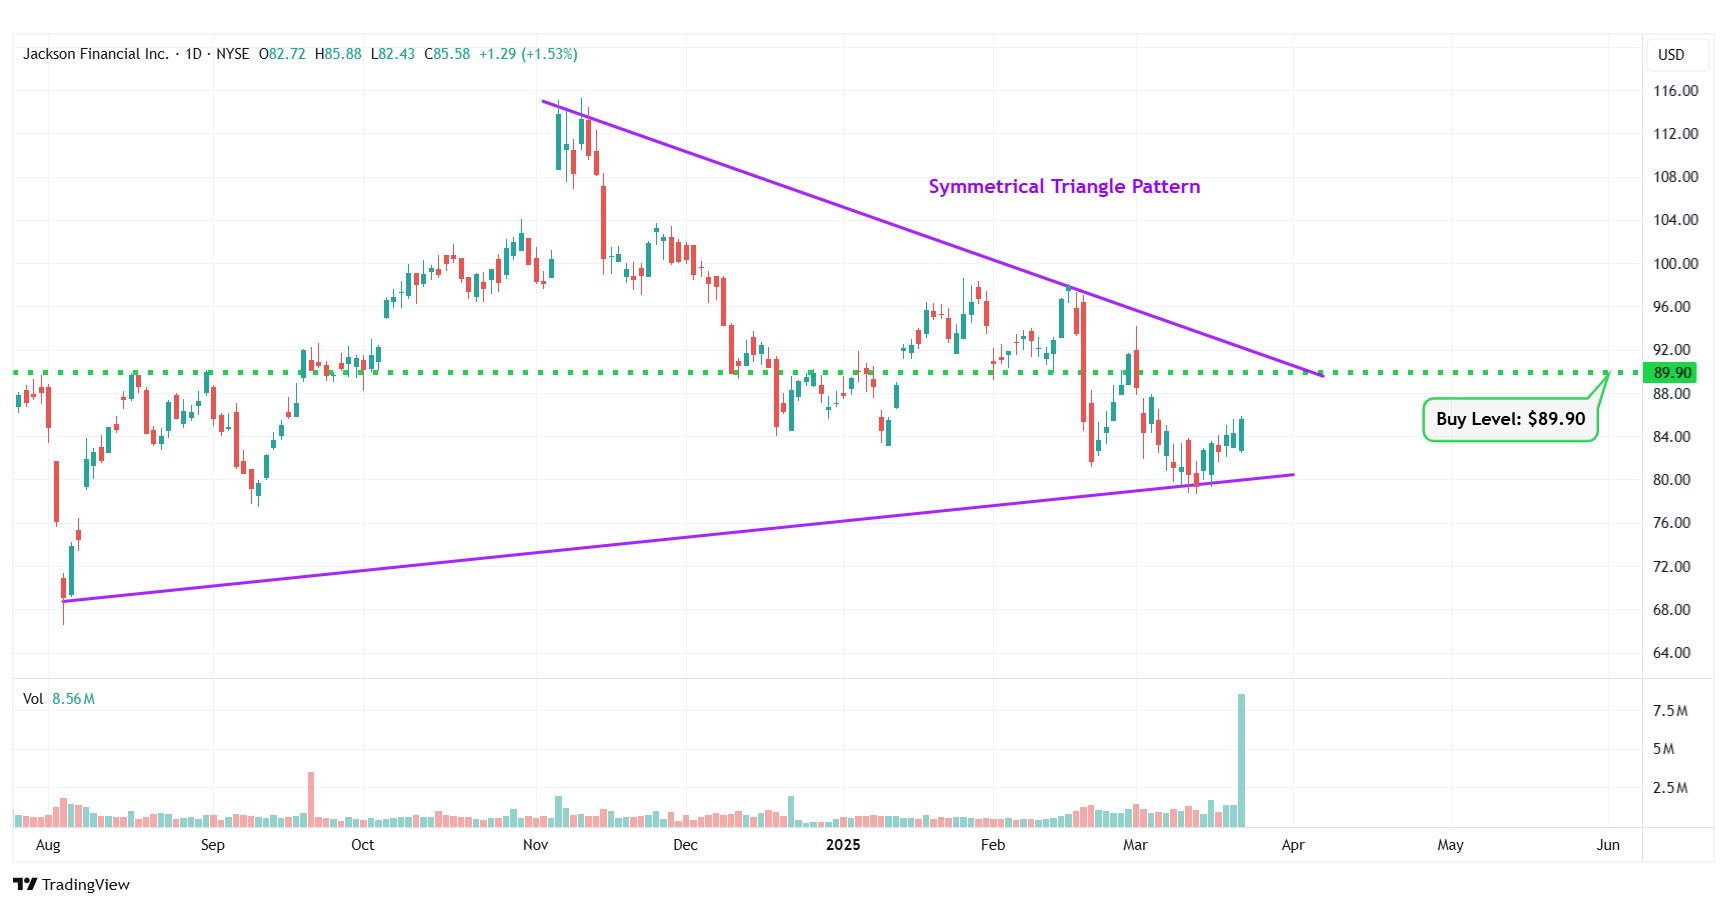
JXN – Symmetrical Triangle Pattern
#3 Crinetics Pharmaceuticals Inc. (NASDAQ: CRNX)
Sector: Healthcare • Biotechnology
Reason: Formation of a Falling Wedge Pattern
A falling wedge pattern is formed by joining two downward-sloping, converging trendlines having a contracting range. The pattern appears to be wide at the top and continues to contract as prices fall. A breakout from a falling wedge pattern can indicate either reversal or continuation depending on where the pattern appeared in the trend.
A stock that has broken out of a falling wedge pattern would have gained momentum and would have the potential to move higher.
Buy Level(s): The ideal buy level for CRNX is if the stock breaks out of the falling wedge pattern, at a price of around $35.70. This is marked in the chart below as a green color dotted line.
Daily chart – CRNX
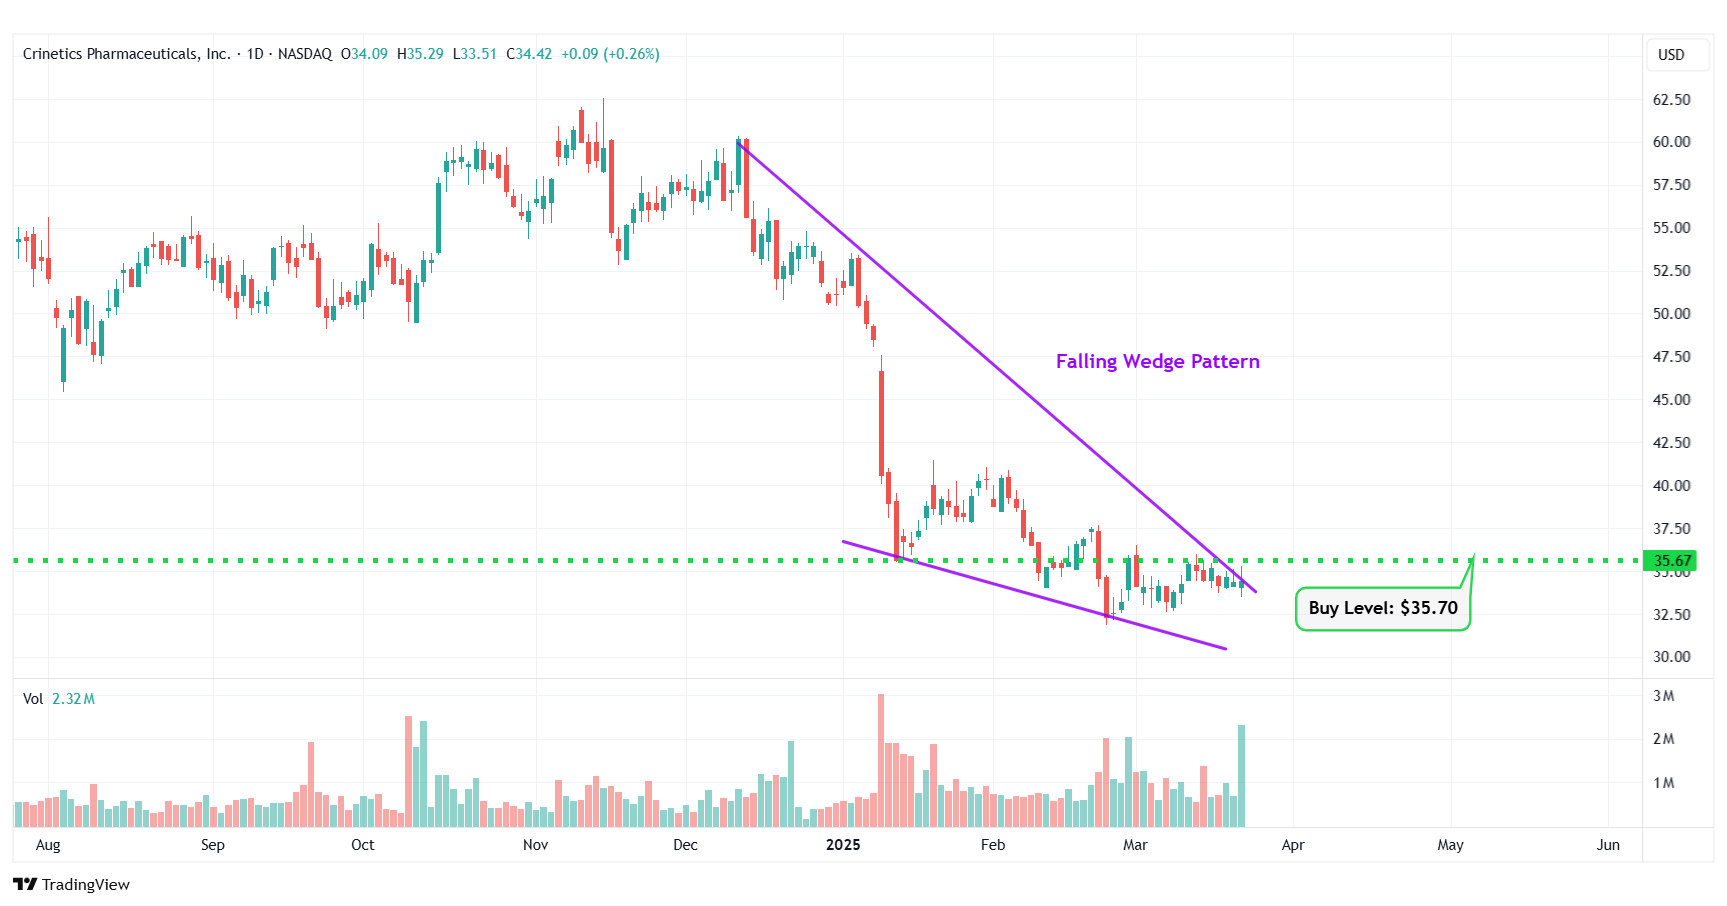
CRNX – Falling Wedge Pattern
#4 Southwest Airlines Co. (NYSE: LUV)
Sector: Industrials • Airlines
Reason: Symmetrical Triangle Pattern Breakout
A symmetrical triangle is a chart pattern formed by two converging trend lines connecting a series of sequential peaks and troughs. These two lines result in the formation of a triangle that appears to be symmetrical.
A symmetrical triangle pattern is usually formed when there is indecision in the price movements and there is uncertainty among the buyers and sellers. This chart pattern represents a period of consolidation before the price breaks out or breaks down. In case a breakout occurs from the upper trend line, it is a strong bullish indication as it signifies the start of a new bullish trend.
Buy Level(s): The stock has currently broken out of a symmetrical triangle pattern. However, the ideal buy level for LUV is if the stock closes above the immediate resistance level of $35.40. This is marked in the chart below as a green color dotted line.
Daily chart – LUV
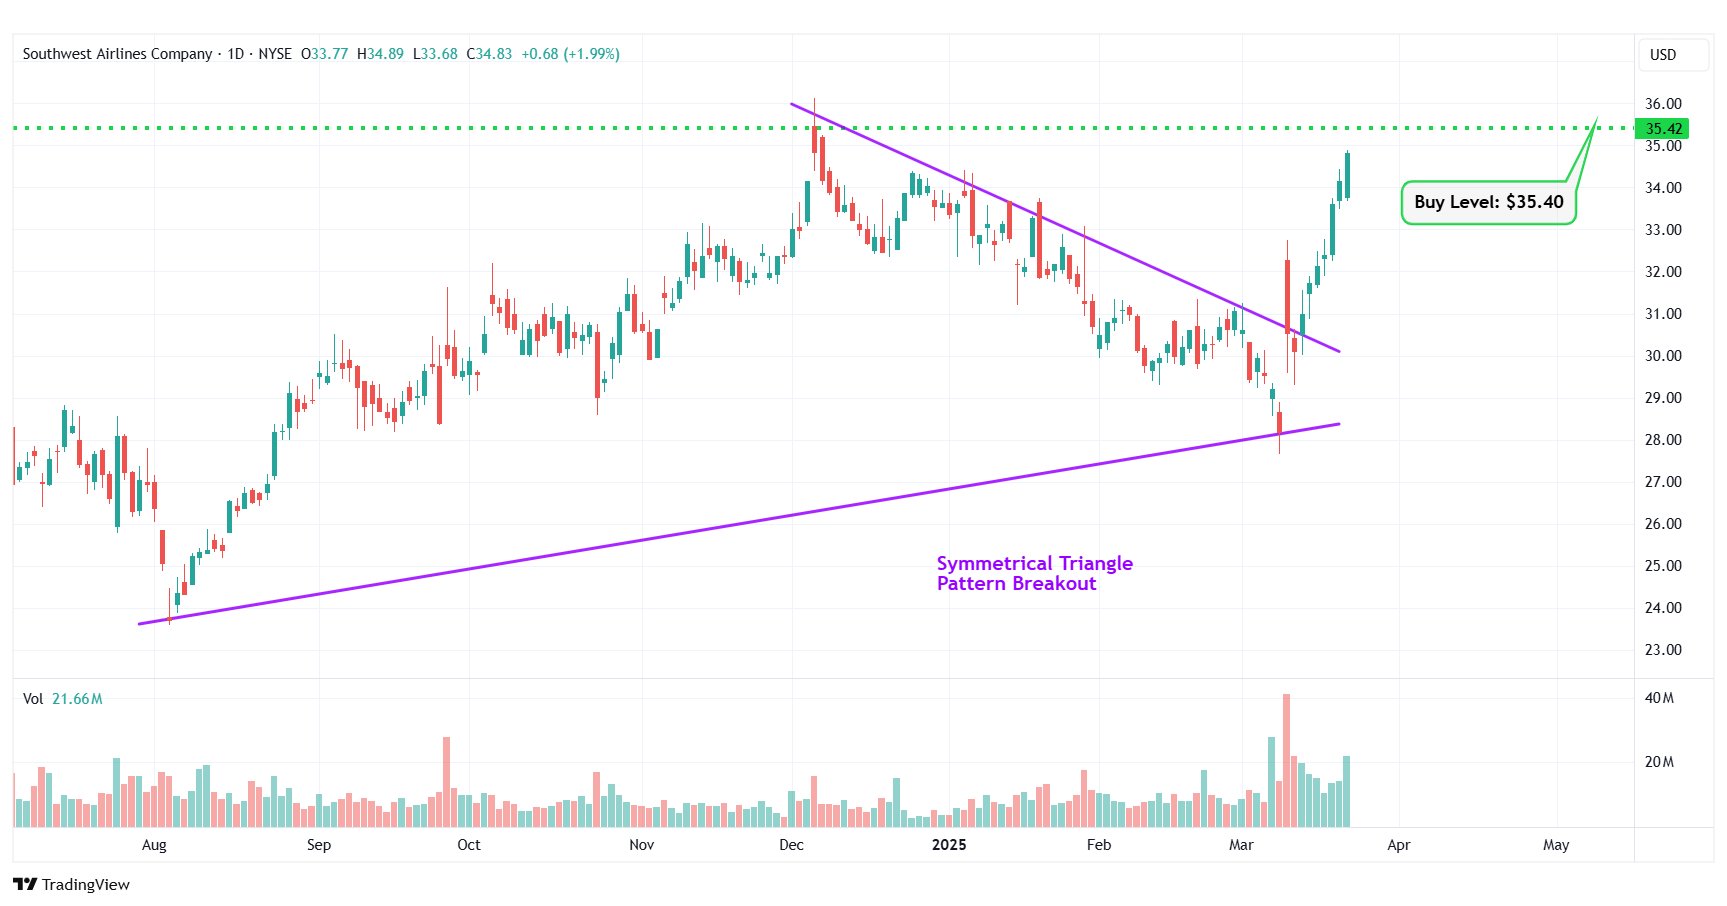
LUV – Symmetrical Triangle Pattern Breakout
#5 C3.ai Inc. (NYSE: AI)
Sector: Technology • Software – Application
Reason: Formation of a Downtrend Channel
A downtrend or descending channel is the price action contained between downward sloping parallel lines. It is formed by two lines that are drawn by connecting the lower highs and lower lows of a stock’s price. Even though this is typically a bearish pattern, a breakout from the upper rail of this pattern is considered a good bullish indication.
Buy Level(s): The daily chart shows that the stock is currently forming a downtrend channel. The ideal buy level for AI is if the stock breaks out of the downtrend channel and has a daily close above $24.50. This is marked in the chart below as a green color dotted line.
Daily chart – AI
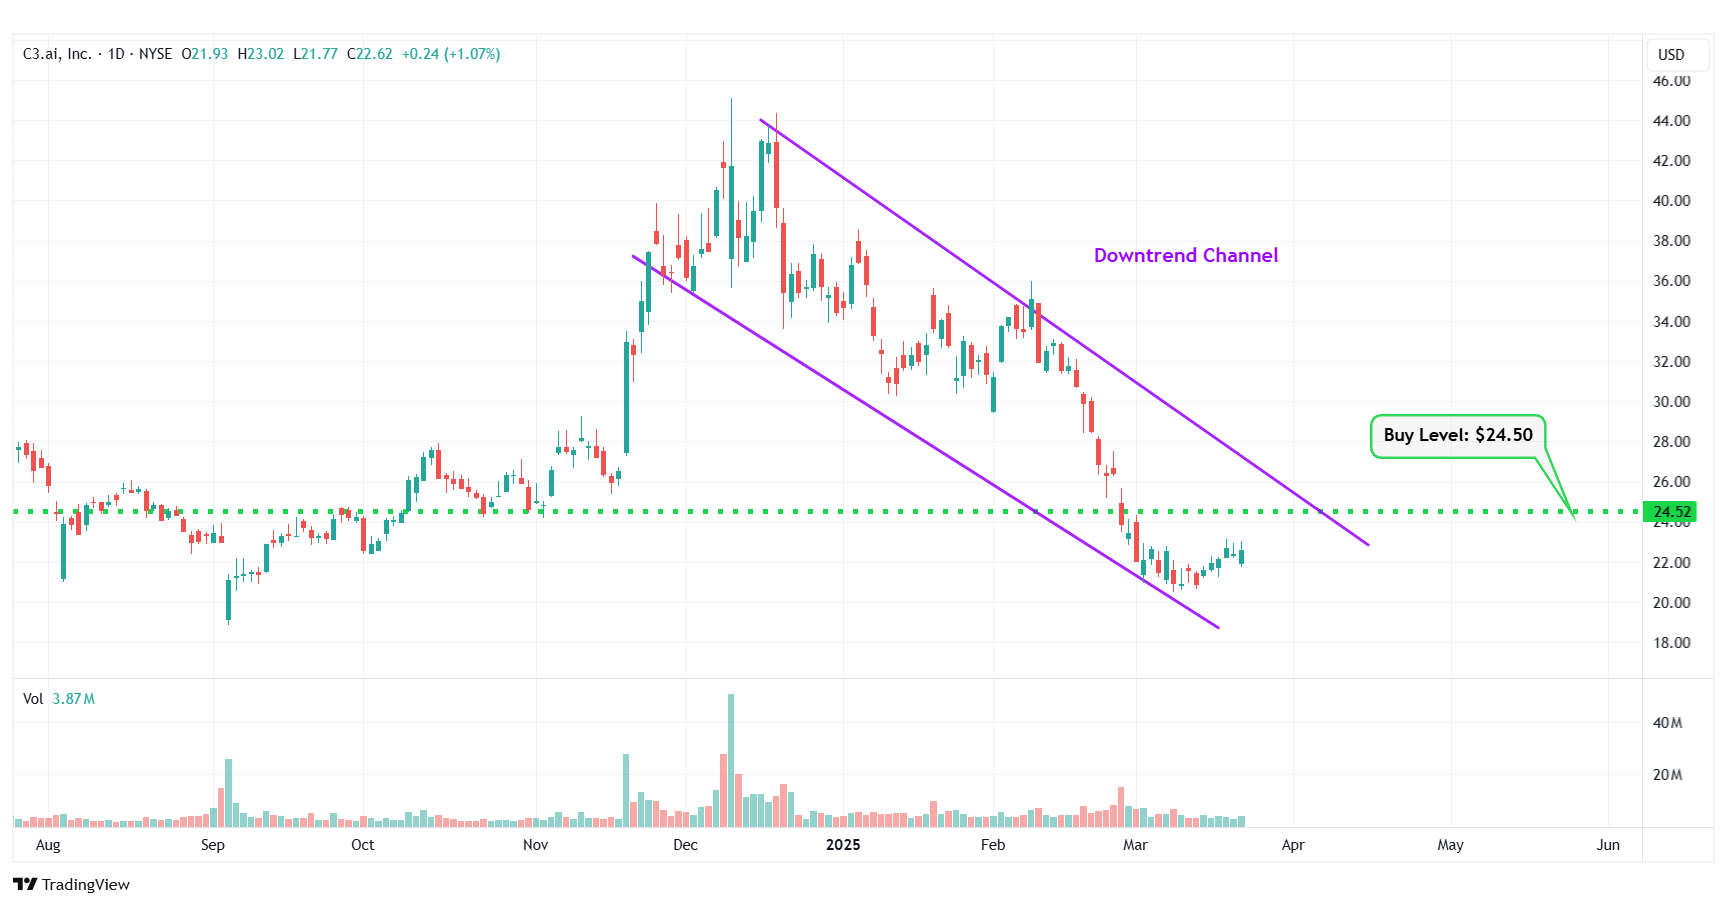
AI – Downtrend Channel
#6 Meta Platforms Inc. (NASDAQ: META)
Sector: Communication Services • Internet Content & Information
Reason: Formation of a Symmetrical Triangle Pattern
A symmetrical triangle is a chart pattern formed by two converging trend lines connecting a series of sequential peaks and troughs. These two lines result in the formation of a triangle that appears to be symmetrical.
A symmetrical triangle pattern is usually formed when there is indecision in the price movements and there is uncertainty among the buyers and sellers. This chart pattern represents a period of consolidation before the price breaks out or breaks down. In case a breakout occurs from the upper trend line, it is a strong bullish indication as it signifies the start of a new bullish trend.
Buy Level(s): The ideal buy level for META is if the stock has a daily close above the breakout level of the symmetrical triangle pattern, at around $608.50. This is marked in the chart below as a green color dotted line.
Daily chart – META
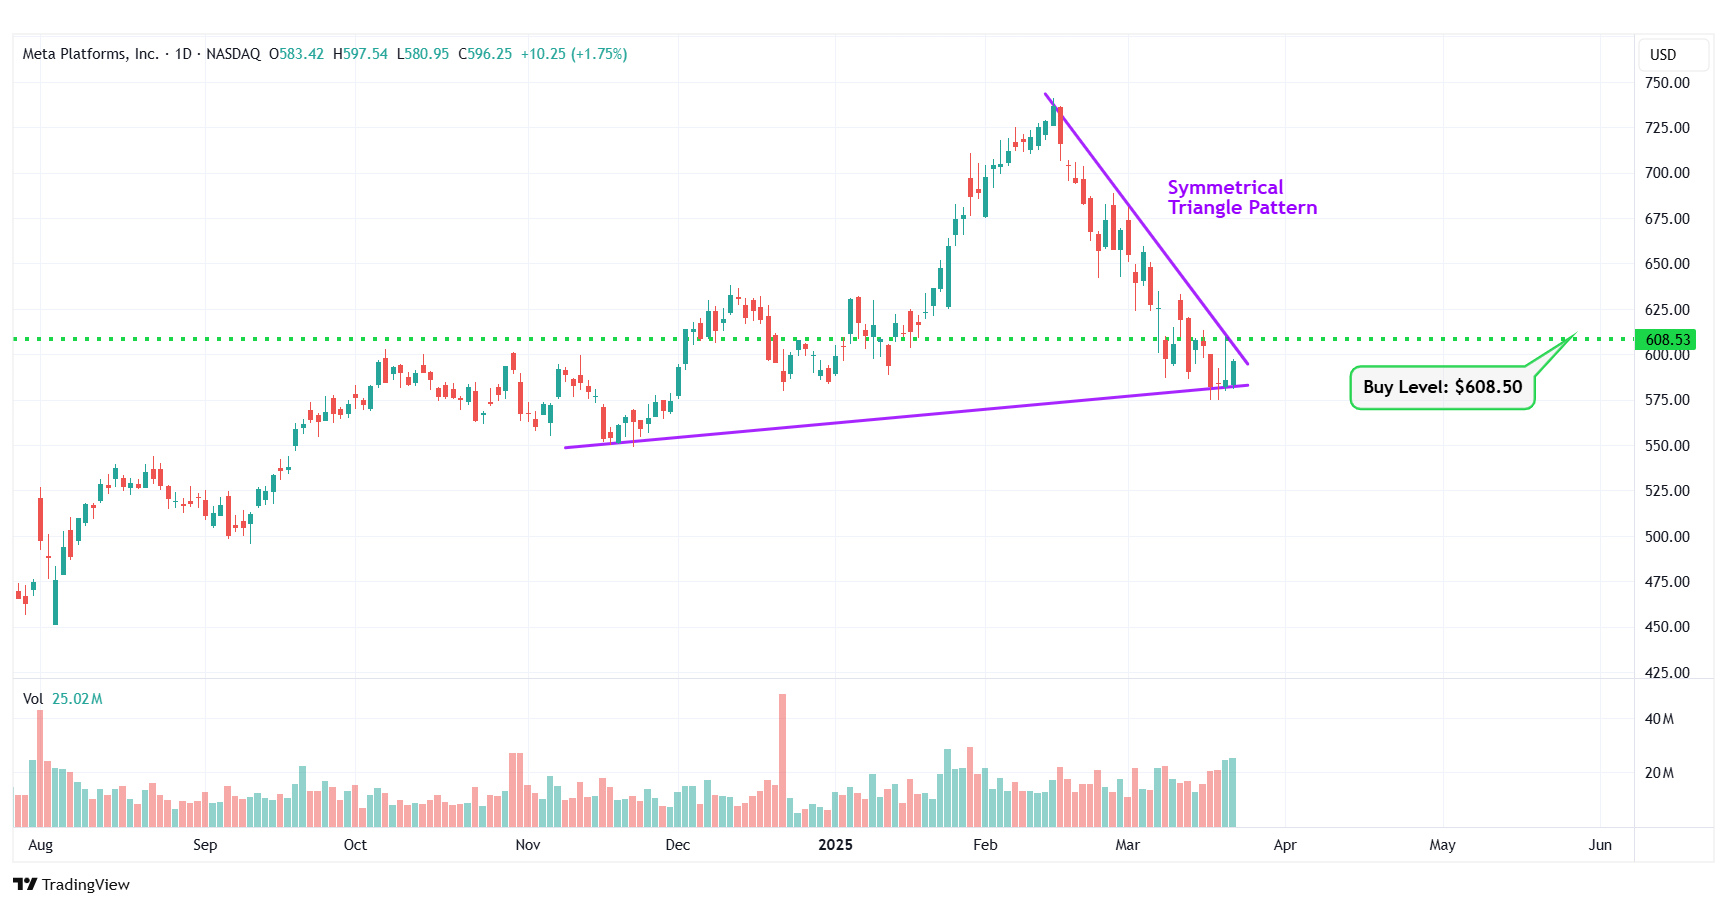
META – Symmetrical Triangle Pattern
#7 Luminar Technologies Inc. (NASDAQ: LAZR)
Sector: Consumer Cyclical • Auto Parts
Reason: Falling Wedge Pattern Breakout
A falling wedge pattern is formed by joining two downward-sloping, converging trendlines having a contracting range. The pattern appears to be wide at the top and continues to contract as prices fall. A breakout from a falling wedge pattern can indicate either reversal or continuation depending on where the pattern appeared in the trend.
A stock that has broken out of a falling wedge pattern would have gained momentum and would have the potential to move higher.
Buy Level(s): The stock has currently broken out of a falling wedge pattern. However, the ideal buy level for LAZR is above the nearest resistance level of $8.90. This is marked in the chart below as a green color dotted line.
Daily chart – LAZR
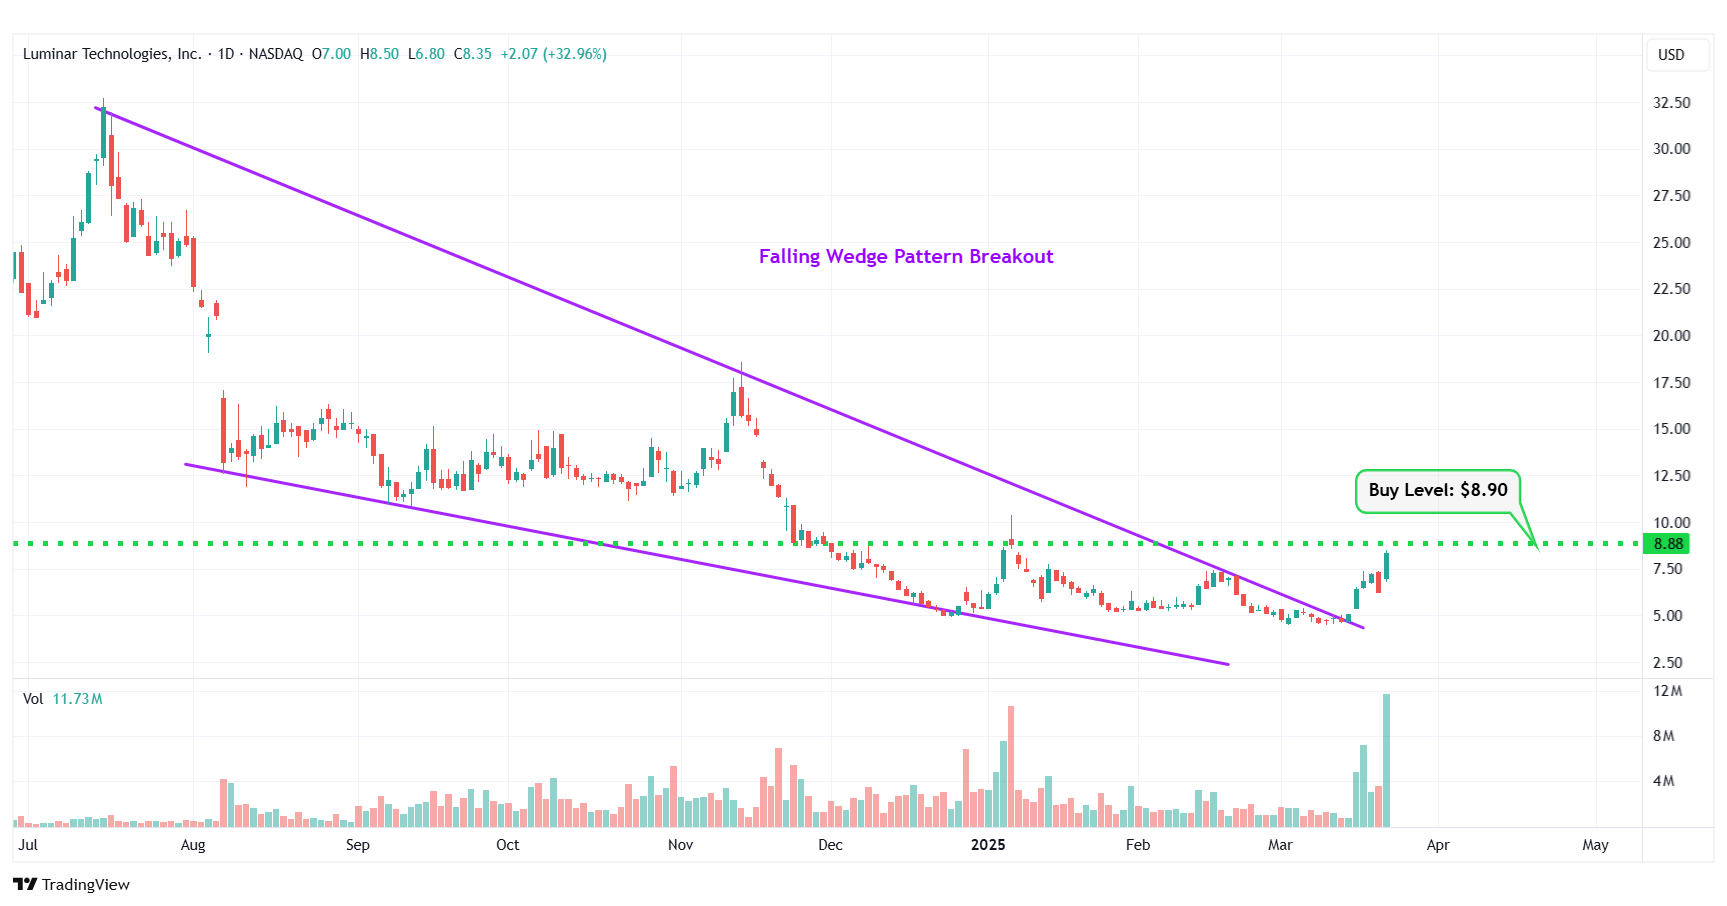
LAZR – Falling Wedge Pattern Breakout
#8 Genius Sports Limited (NYSE: GENI)
Sector: Communication Services • Internet Content & Information
Reason: Breakout From a Consolidation Area in the Daily Chart
A Consolidation Area is a price action contained between two parallel lines. It is formed by a lower line that connects the lows, and an upper line that joins the highs. A stock usually trades between the two lines of the consolidation area before finally breaking out from the upper rail.
Buy Level(s): Although the stock has currently broken out of a consolidation area, the ideal buy level for GENI is above the near-term resistance area, which translates to a price of around $10.70. This is marked in the chart below as a green color dotted line.
Daily chart – GENI
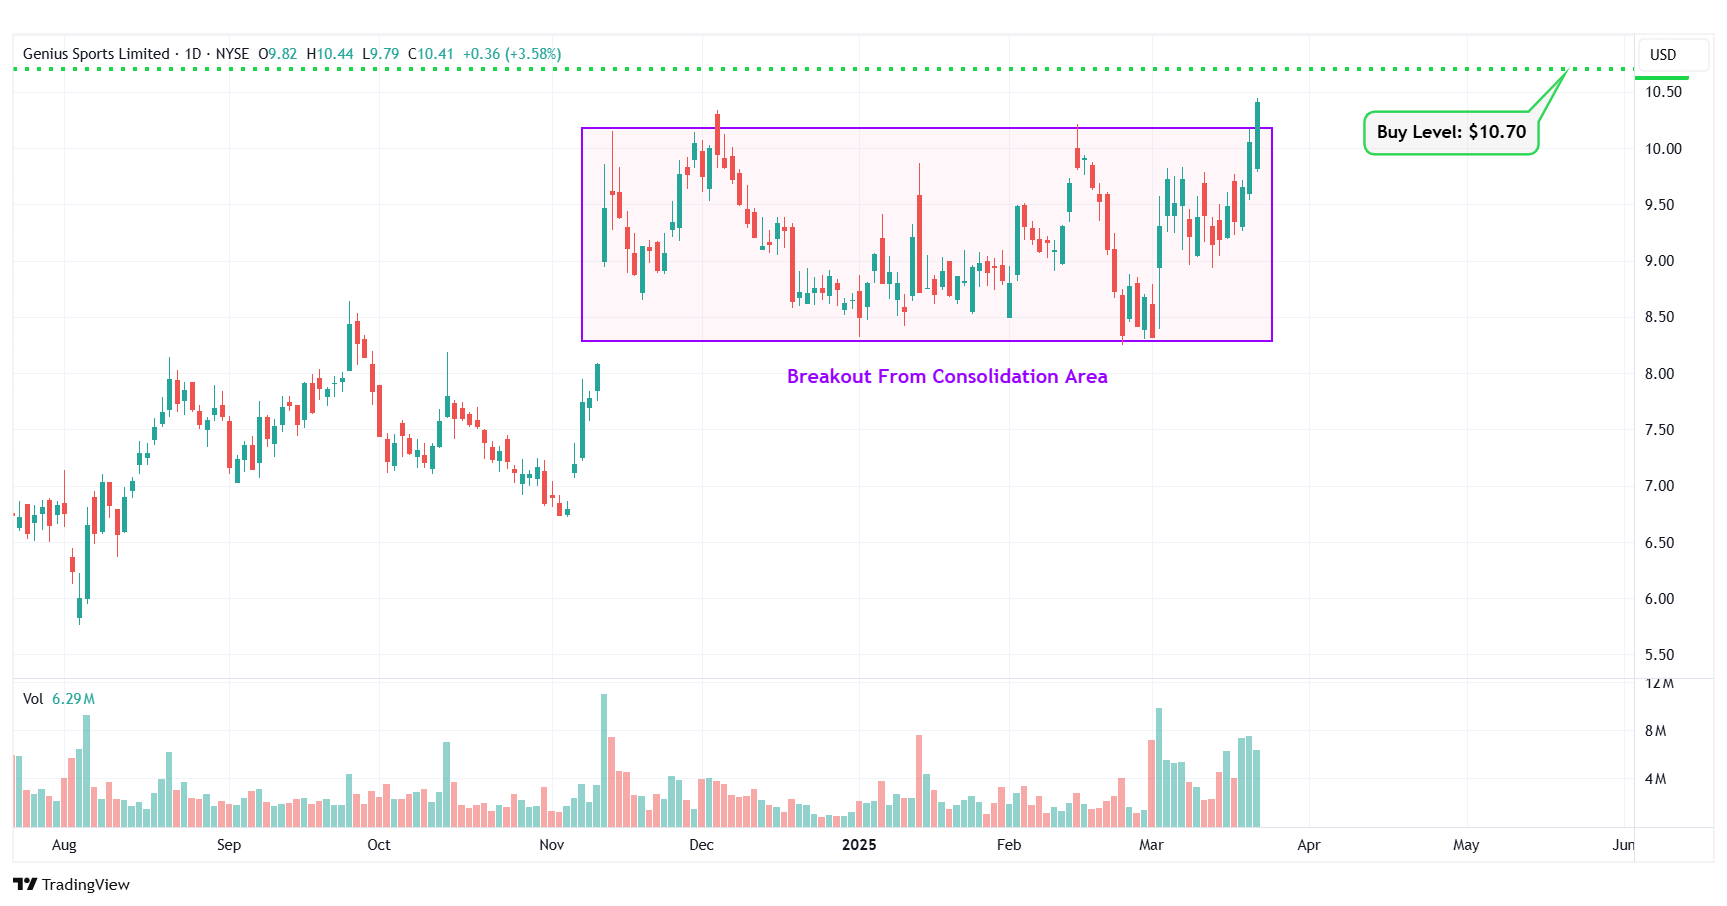
GENI – Breakout From Consolidation Area
#9 Wabash National Corp. (NYSE: WNC)
Sector: Industrials • Farm & Heavy Construction Machinery
Reason: Formation of a Falling Wedge Pattern
A falling wedge pattern is formed by joining two downward-sloping, converging trendlines having a contracting range. The pattern appears to be wide at the top and continues to contract as prices fall. A breakout from a falling wedge pattern can indicate either reversal or continuation depending on where the pattern appeared in the trend.
A stock that has broken out of a falling wedge pattern would have gained momentum and would have the potential to move higher.
Buy Level(s): The ideal buy level for WNC is if the stock breaks out of the falling wedge pattern, at a price of around $11.80. This is marked in the chart below as a green color dotted line.
Daily chart – WNC
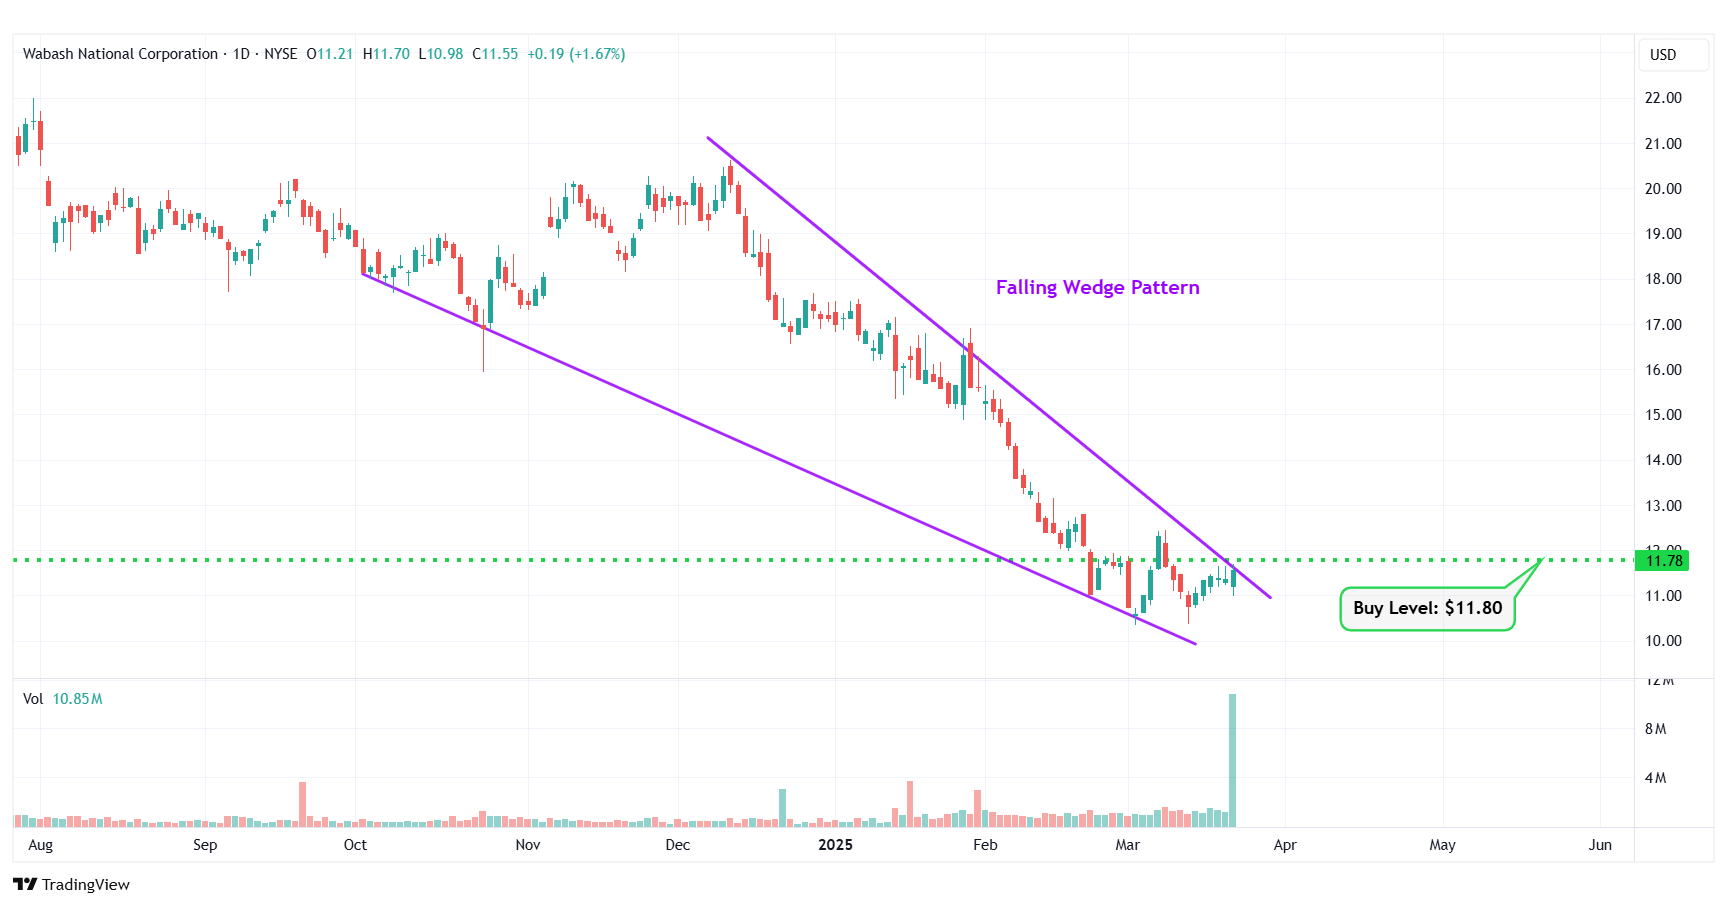
WNC – Falling Wedge Pattern
#10 Pfizer Inc. (NYSE: PFE)
Sector: Healthcare • Drug Manufacturers – General
Reason: Formation of a Symmetrical Triangle Pattern
A symmetrical triangle is a chart pattern formed by two converging trend lines connecting a series of sequential peaks and troughs. These two lines result in the formation of a triangle that appears to be symmetrical.
A symmetrical triangle pattern is usually formed when there is indecision in the price movements and there is uncertainty among the buyers and sellers. This chart pattern represents a period of consolidation before the price breaks out or breaks down. In case a breakout occurs from the upper trend line, it is a strong bullish indication as it signifies the start of a new bullish trend.
Buy Level(s): The ideal buy level for PFE is if the stock has a daily close above the breakout level of the symmetrical triangle pattern, at around $26.50. This is marked in the chart below as a green color dotted line.
Daily chart – PFE
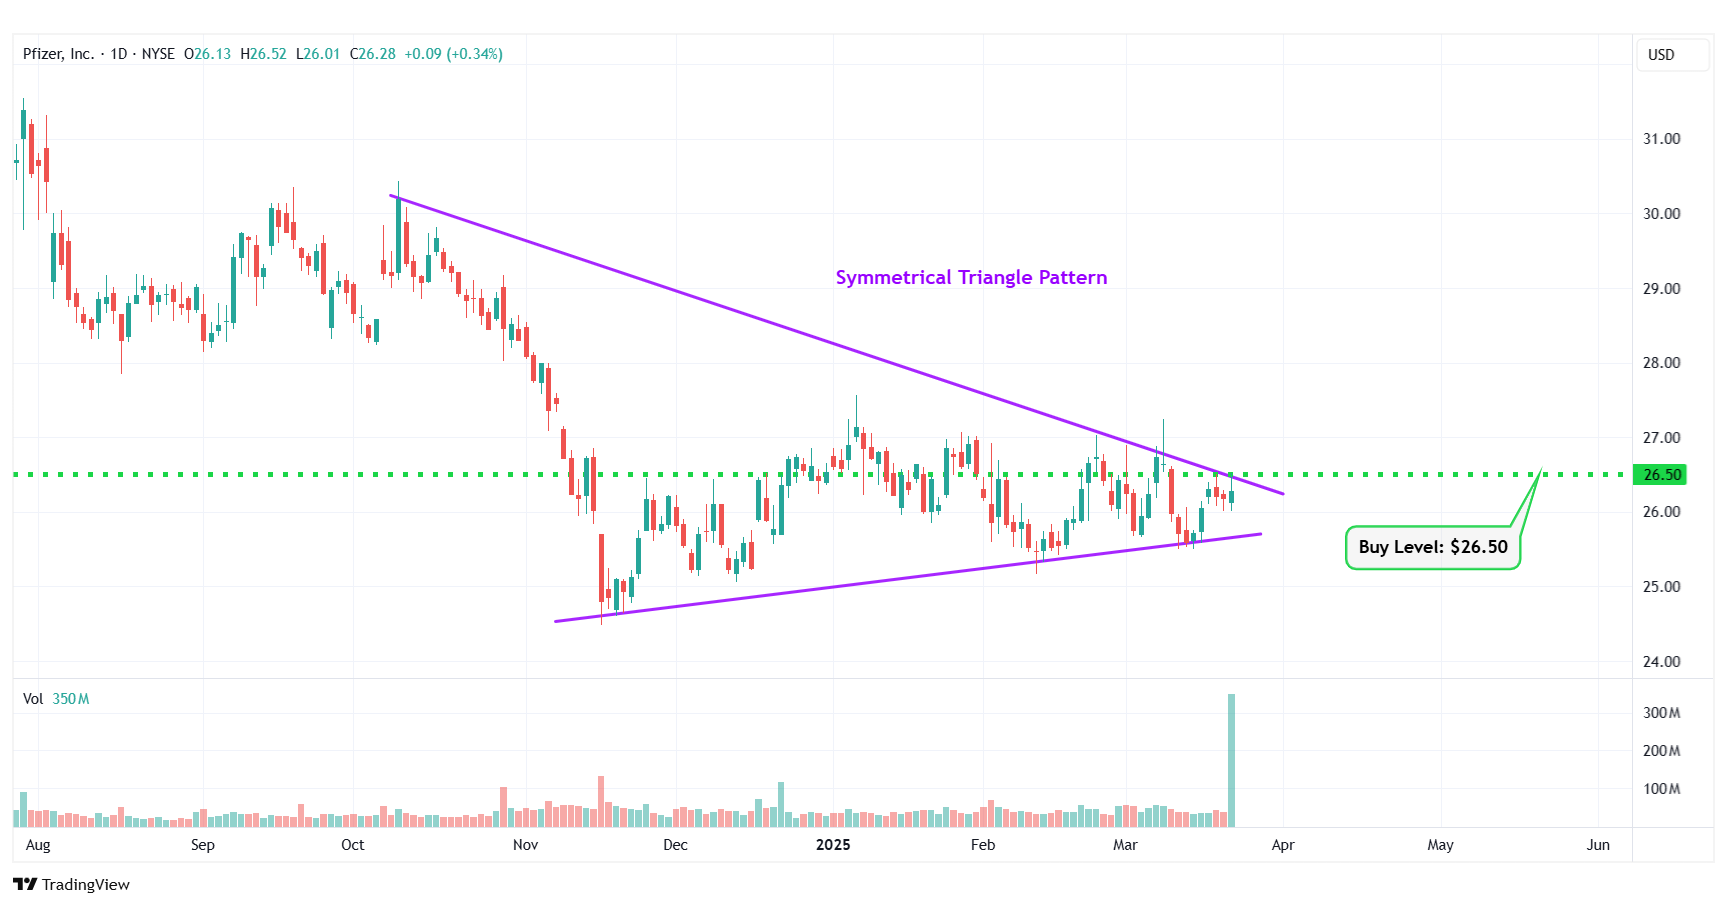
PFE – Symmetrical Triangle Pattern
Happy Trading!
Trades of The Day Research Team
The old way of investing in tech giants is over. A NEW strategy unlocks 146X more income on the SAME underlying stocks (like Meta, Apple, and Amazon) -- WITHOUT options trading. Click here to uncover the NEW MAG-7 alternative.
Source: Trades of the Day

