Oscar Health, Inc. (NYSE: OSCR) seems poised for a price surge based on its latest charts. The company operates as a health insurance in the United States. It offers health plans in individual and small group markets, as well as +Oscar, a technology driven platform that helps providers and payors directly enable their shift to value-based care. It also provides reinsurance products.
Bullish Indications
#1 Falling Wedge Pattern: As you can see from the daily chart, the stock has been forming a falling wedge pattern for the past few weeks. These are marked as purple color lines. The stock currently looks poised for a breakout from the falling wedge pattern. A falling wedge is a bullish pattern and a breakout from it implies that the stock may move higher in the short term.

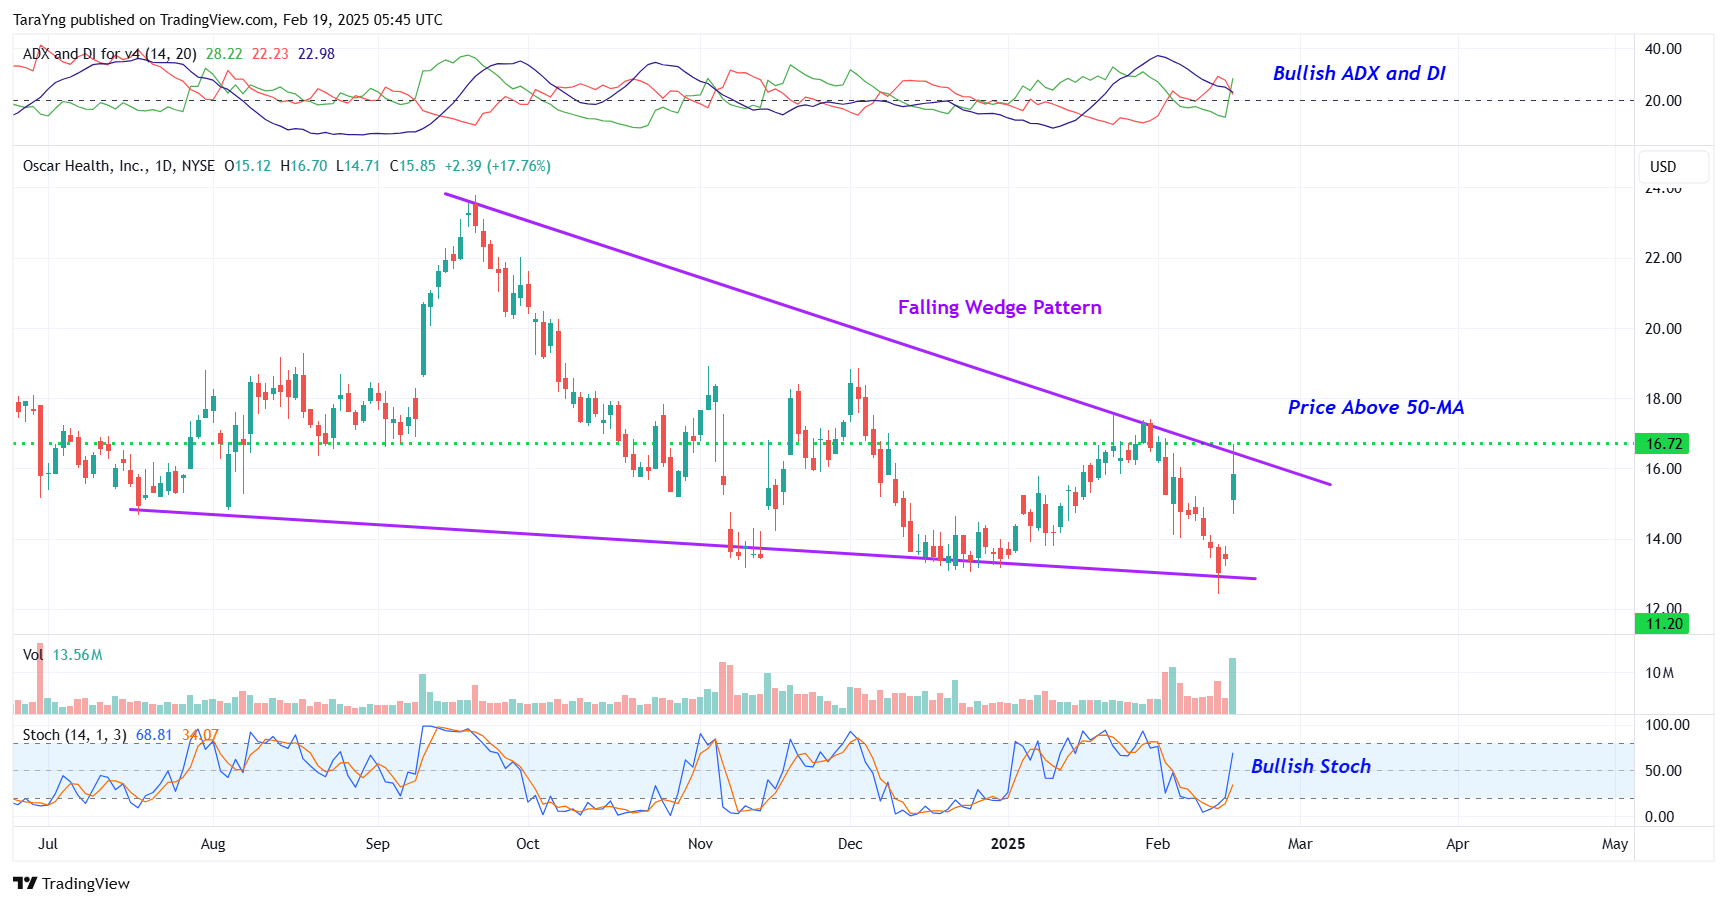
OSCR – Daily Chart
#2 Price above MA: The price is currently above the short-term moving average of 50-day SMA, indicating that the bulls are gaining control. This is a positive indication.
#3 Bullish ADX: The ADX indicator shows that the +DI line is currently above the –DI line and the ADX line has started to move up from below the –DI and +DI lines. This indicates possible bullishness.
#4 Bullish Stoch: The %K line is above the %D line of the stochastic in the daily chart, indicating possible bullishness.
#5 Above Support Area: As you can see from the weekly chart, the stock has currently moved up from a resistance-turned-support level. This level is marked as a pink color dotted line. This looks like a good area for the stock to move higher. The stock is also trading above its 200-week SMA, indicating that the bulls are still in control.
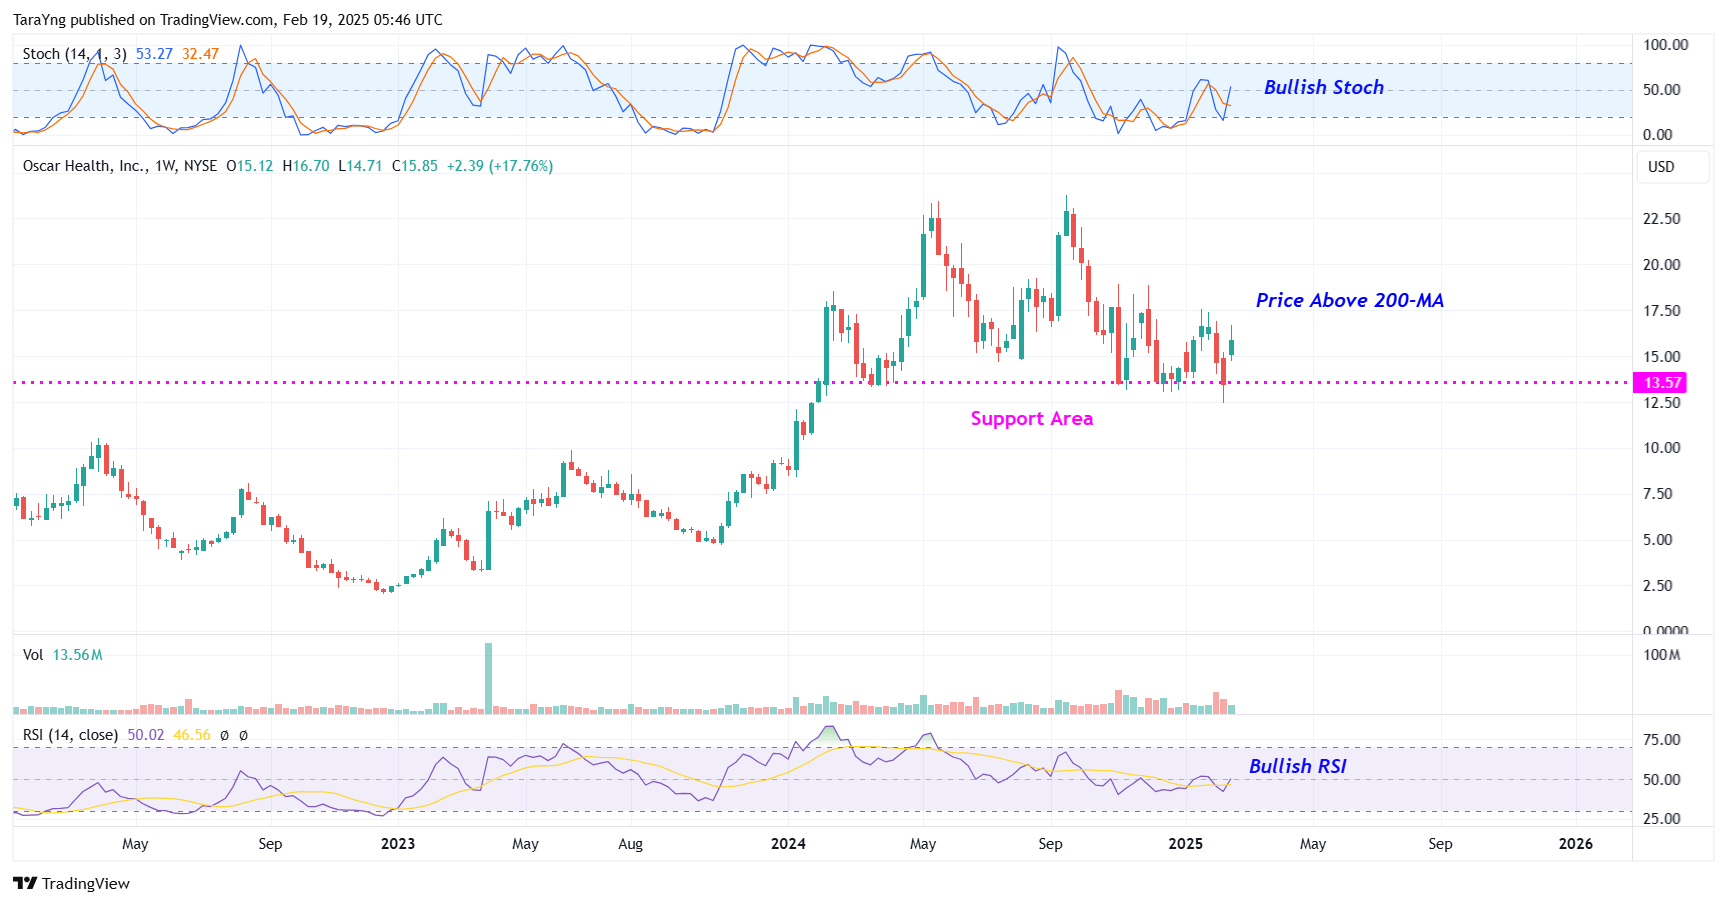
OSCR – Weekly Chart
#6 %K above %D: The %K (blue) line of stochastic has currently crossed above the %D (Orange) line in the weekly chart and is also moving higher from oversold levels. This is a possible bullish indication.
#7 Bullish RSI: In the weekly chart, the RSI is currently above 50 and moving higher. This is a possible bullish sign.
Recommended Trade (based on the charts)
Buy Levels: If you want to get in on this trade, you can purchase shares of OSCR above the price of around $16.70.
TP: Our target prices are $19.00 and $20.50 in the next 3-6 months.
SL: To limit risk, place stop-loss at $15.50. Note that the stop-loss is on a closing basis.
Our target potential upside is 14% to 23% in the next 3 to 6 months.
For a risk of $1.20, our target rewards are $2.30 and $3.80. This is a nearly 1:2 and 1:3 risk-reward trade.
In other words, this trade offers nearly 2x to 3x more potential upside than downside.
Risks to Consider
The stock may reverse its overall trend if it breaks down from the falling wedge pattern with a high volume. The sell-off of the stock could also be triggered in case of any negative news, overall weakness in the market, or any regulatory changes in the sector.
Happy Trading!
Tara
Karim Rahemtulla, the trader behind a 400% gain in 24-months on Rolls-Royce, has uncovered another potential multi-bagger. This under-$20 stock gives you exposure to over 1-oz of gold with the lowest production costs in the industry. And an upcoming announcement could send this stock soaring. Get Karim's urgent briefing - click here now.
Source: Trades of the Day
