Picking a winning trade on a consistent basis is not simply a stroke of luck. It’s the result of calculated screening, planning, and deliberation.
With this in mind, we have started a new weekly series on our top 10 stocks to watch this week — stocks that look poised for a possible breakout in the coming days. Traders should add these stocks to their watchlist now.
The Top 10 Stocks to Watch This Week for Possible Breakouts
| Sl # | Name of the Stock | Stock Ticker | Last Close | Buy Level(s) | Reason |
| 1 | Affirm Holdings Inc. | NASDAQ: AFRM | $75.22 | $76.60 | Symmetrical Triangle Pattern Breakout |
| 2 | UP Fintech Holding Ltd ADR | NASDAQ: TIGR | $7.73 | $7.90 | Double Bottom Pattern |
| 3 | Centrus Energy Corp | AMEX: LEU | $108.91 | $110.00 | Symmetrical Triangle Pattern Breakout |
| 4 | Mondelez International Inc. | NASDAQ: MDLZ | $58.45 | $58.70 | Downtrend Channel Breakout |
| 5 | Centessa Pharmaceuticals plc ADR | NASDAQ: CNTA | $19.03 | $19.20 | Breakout From Consolidation Area |
| 6 | EHang Holdings Ltd ADR | NASDAQ: EH | $20.40 | $20.60 | Symmetrical Triangle Pattern Breakout |
| 7 | American Electric Power Company Inc. | NASDAQ: AEP | $100.35 | $102.00 | Downtrend Channel Breakout |
| 8 | Futu Holdings Ltd ADR | NASDAQ: FUTU | $105.64 | $107.30 | Symmetrical Triangle Pattern Breakout |
| 9 | Super Micro Computer Inc. | NASDAQ: SMCI | $36.28 | $40.00 | Downtrend Channel Breakout |
| 10 | Monolithic Power System Inc. | NASDAQ: MPWR | $720.25 | $735.00 | Symmetrical Triangle Pattern Breakout |
Important: Typically, these trades offer a risk: reward ratio of 1:2 or 1:3 in the next 6 months, which implies 2x to 3x rewards when compared to risks. So, be sure to set your stop-loss levels and target prices accordingly to manage your risk. In addition, these trade ideas are triggered using daily closing prices, not intra-day pricing. So, if you participate in these trades, make sure that you only buy the stock once its daily close is above the recommended price level.
That said, here are the top 10 stocks to watch for a breakout, in no particular order.
#1 Affirm Holdings Inc. (NASDAQ: AFRM)
Sector: Technology • Software – Infrastructure
Reason: Symmetrical Triangle Pattern Breakout
A symmetrical triangle is a chart pattern formed by two converging trend lines connecting a series of sequential peaks and troughs. These two lines result in the formation of a triangle that appears to be symmetrical.
A symmetrical triangle pattern is usually formed when there is indecision in the price movements and there is uncertainty among the buyers and sellers. This chart pattern represents a period of consolidation before the price breaks out or breaks down. In case a breakout occurs from the upper trend line, it is a strong bullish indication as it signifies the start of a new bullish trend.
Buy Level(s): The stock has currently broken out of a symmetrical triangle pattern. However, the ideal buy level for AFRM is if the stock closes above the immediate resistance level of $76.60. This is marked in the chart below as a green color dotted line.
Daily chart – AFRM
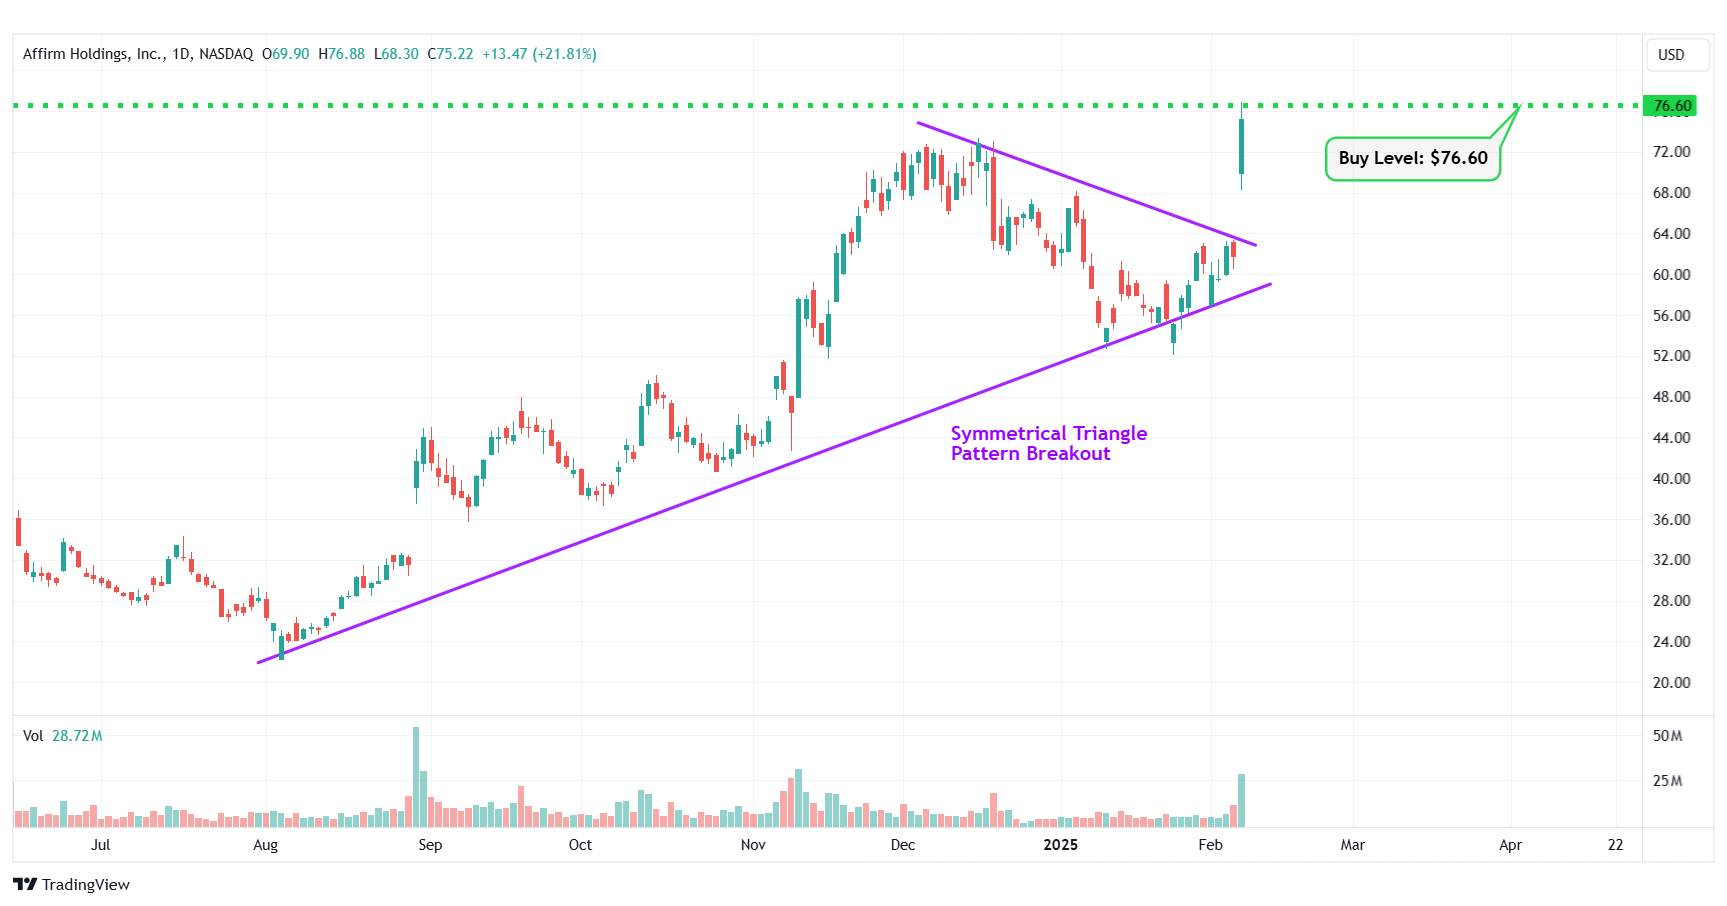
AFRM – Symmetrical Triangle Pattern Breakout
#2 UP Fintech Holding Ltd ADR (NASDAQ: TIGR)
Sector: Financial • Capital Markets
Reason: Formation of a Double Bottom Pattern
A Double Bottom Pattern looks like the letter W and is characterized by two well-defined lows at approximately the same price level. This twice-touched low is usually a very strong support level. The high point between the two bottoms’ resistance level is called a neckline. Once a breakout happens from this key price level (neckline), it signifies the start of a bullish move.
Buy Level(s): The ideal buy level for TIGR is above the breakout level of the double bottom pattern around $7.90. This is marked in the chart below as a green color dotted line.
Daily chart – TIGR
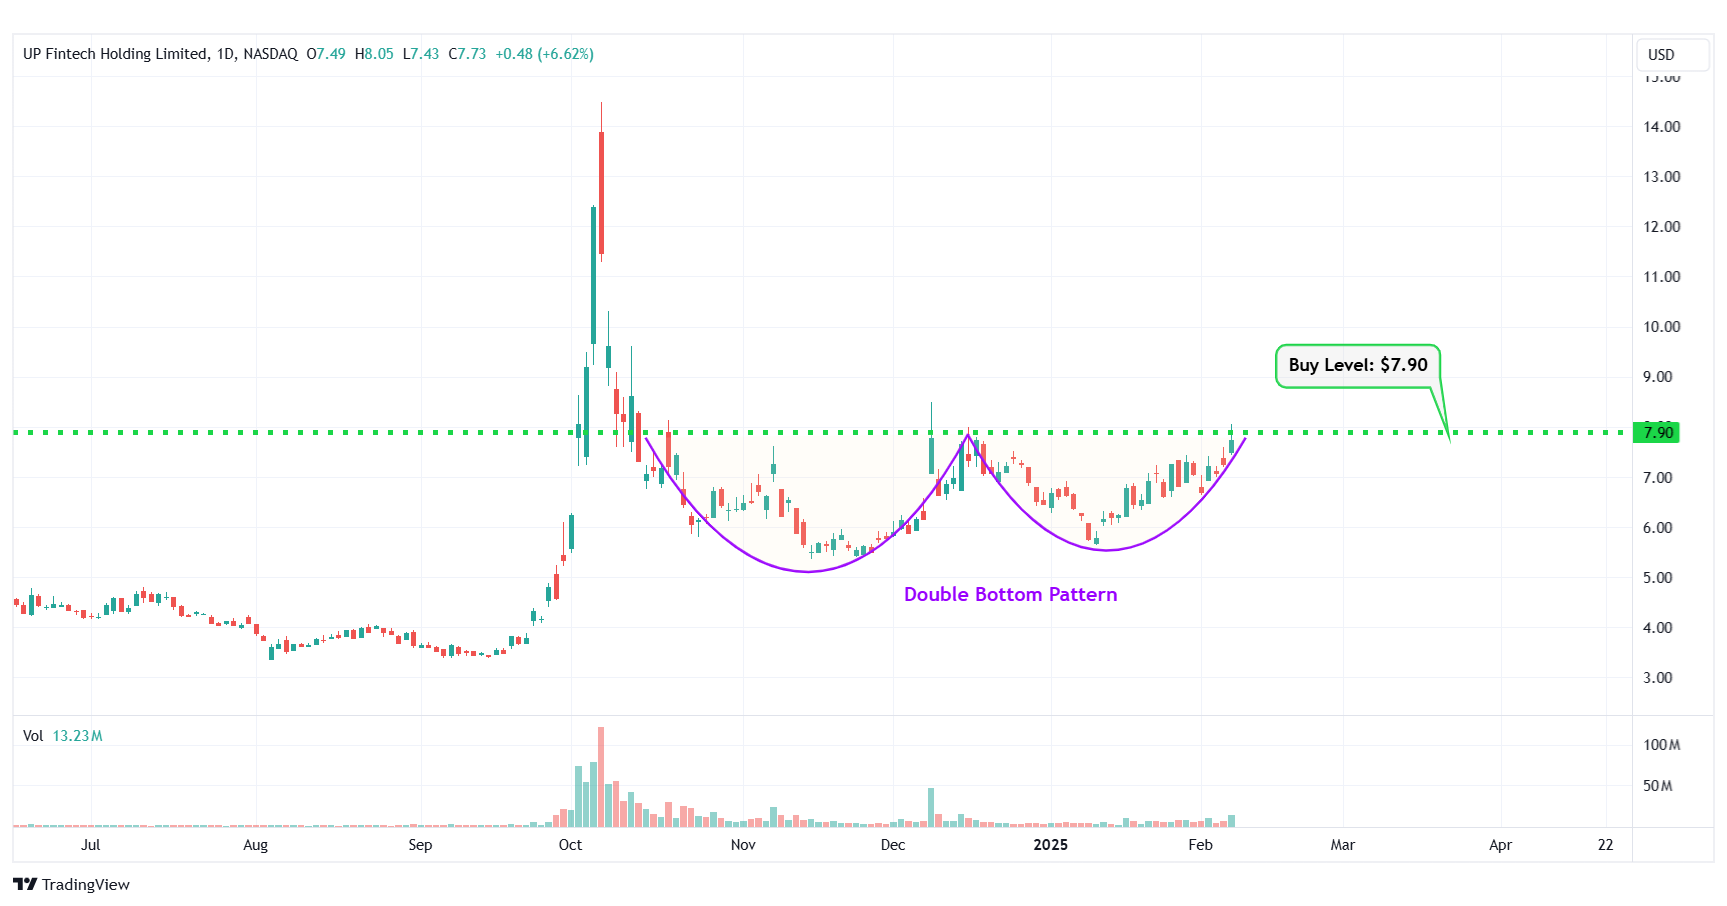
TIGR – Double Bottom Pattern
#3 Centrus Energy Corp (AMEX: LEU)
Sector: Energy • Uranium
Reason: Symmetrical Triangle Pattern Breakout
A symmetrical triangle is a chart pattern formed by two converging trend lines connecting a series of sequential peaks and troughs. These two lines result in the formation of a triangle that appears to be symmetrical.
A symmetrical triangle pattern is usually formed when there is indecision in the price movements and there is uncertainty among the buyers and sellers. This chart pattern represents a period of consolidation before the price breaks out or breaks down. In case a breakout occurs from the upper trend line, it is a strong bullish indication as it signifies the start of a new bullish trend.
Buy Level(s): The stock has currently broken out of a symmetrical triangle pattern. However, the ideal buy level for LEU is if the stock closes above the immediate resistance level of $110.00. This is marked in the chart below as a green color dotted line.
Daily chart – LEU
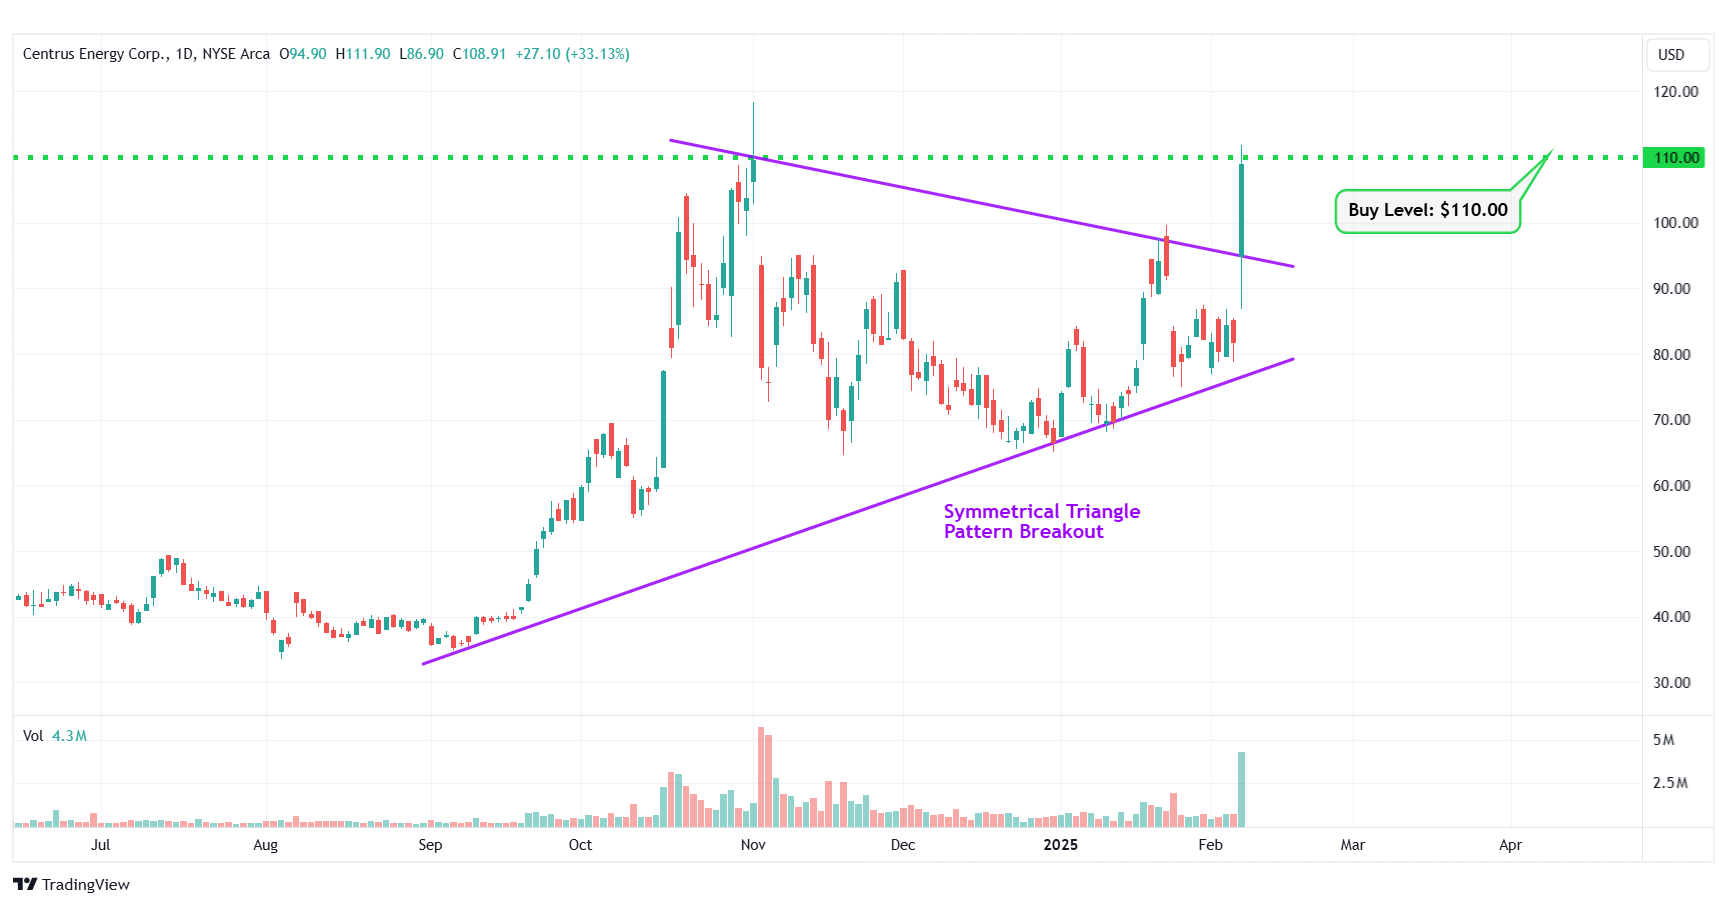
LEU – Symmetrical Triangle Pattern Breakout
#4 Mondelez International Inc. (NASDAQ: MDLZ)
Sector: Consumer Defensive • Confectioners
Reason: Downtrend Channel Breakout
A downtrend or descending channel is the price action contained between downward sloping parallel lines. It is formed by two lines that are drawn by connecting the lower highs and lower lows of a stock’s price. Even though this is typically a bearish pattern, a breakout from the upper rail of this pattern is considered a good bullish indication.
Buy Level(s): The daily chart shows that the stock has currently broken out of a downtrend channel. However, there is a near-term resistance level for the stock. Hence, the ideal buy level for MDLZ is if the stock has a daily close above $58.70. This is marked in the chart below as a green color dotted line.
Daily chart – MDLZ
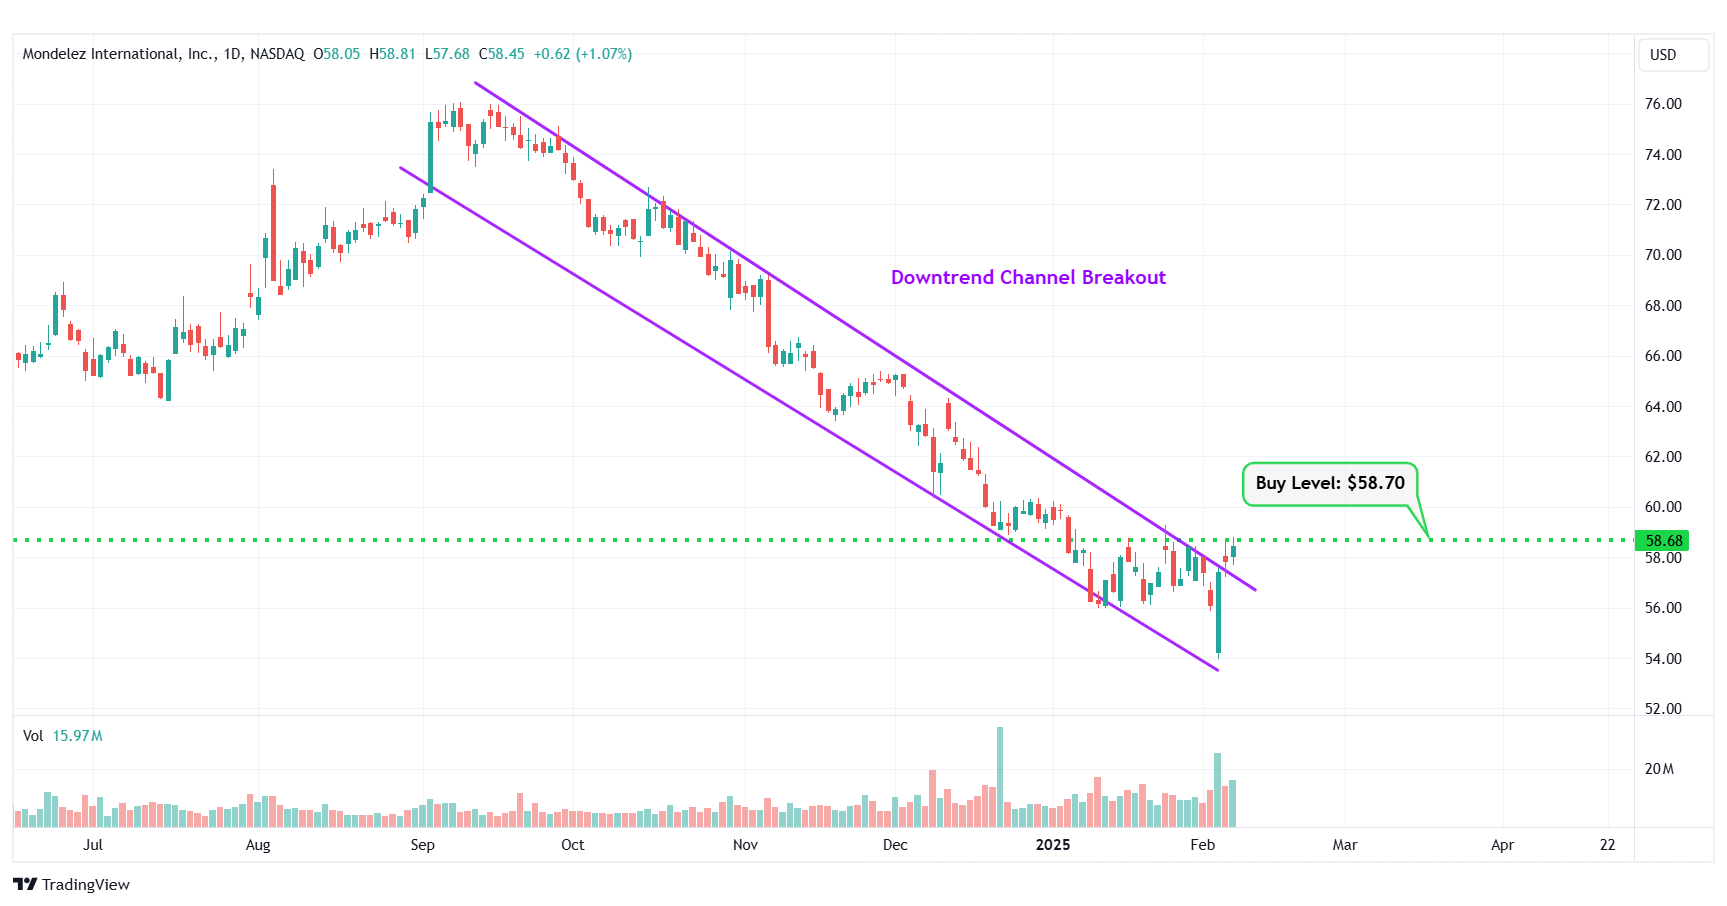
MDLZ – Downtrend Channel Breakout
#5 Centessa Pharmaceuticals plc ADR (NASDAQ: CNTA)
Sector: Healthcare • Biotechnology
Reason: Breakout From a Consolidation Area in the Daily Chart
A Consolidation Area is a price action contained between two parallel lines. It is formed by a lower line that connects the lows, and an upper line that joins the highs. A stock usually trades between the two lines of the consolidation area before finally breaking out from the upper rail.
Buy Level(s): Although the stock has currently broken out of a consolidation area, the ideal buy level for CNTA is above the near-term resistance area, which translates to a price of around $19.20. This is marked in the chart below as a green color dotted line.
Daily chart – CNTA
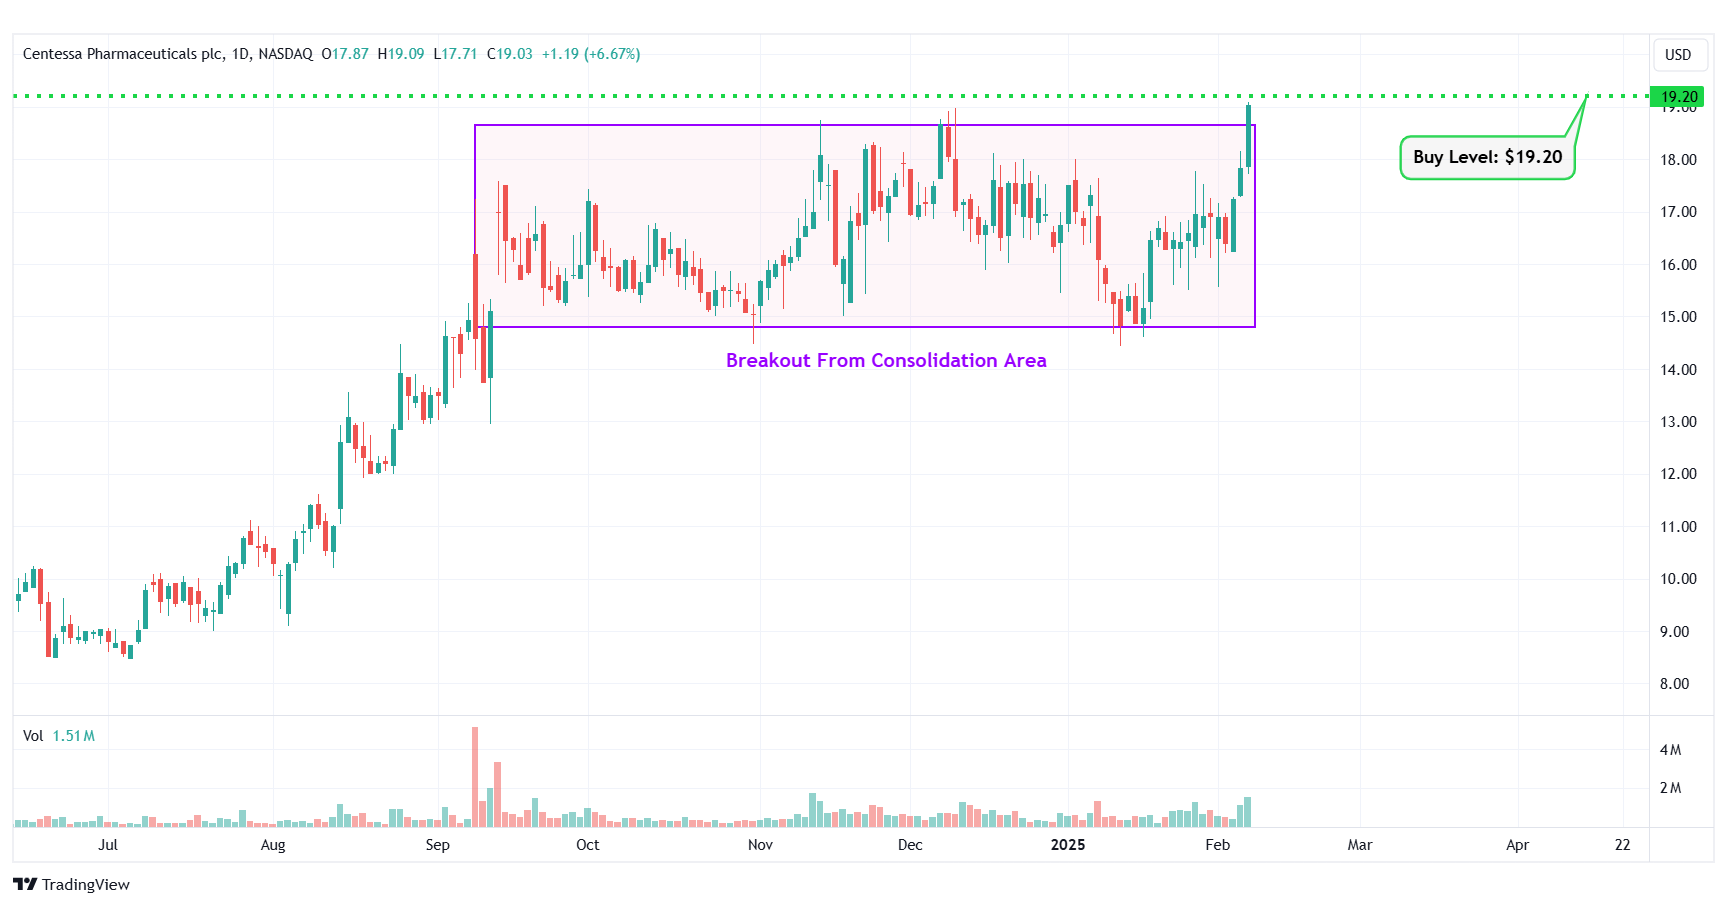
CNTA – Breakout From Consolidation Area
#6 EHang Holdings Ltd ADR (NASDAQ: EH)
Sector: Industrials • Aerospace & Defense
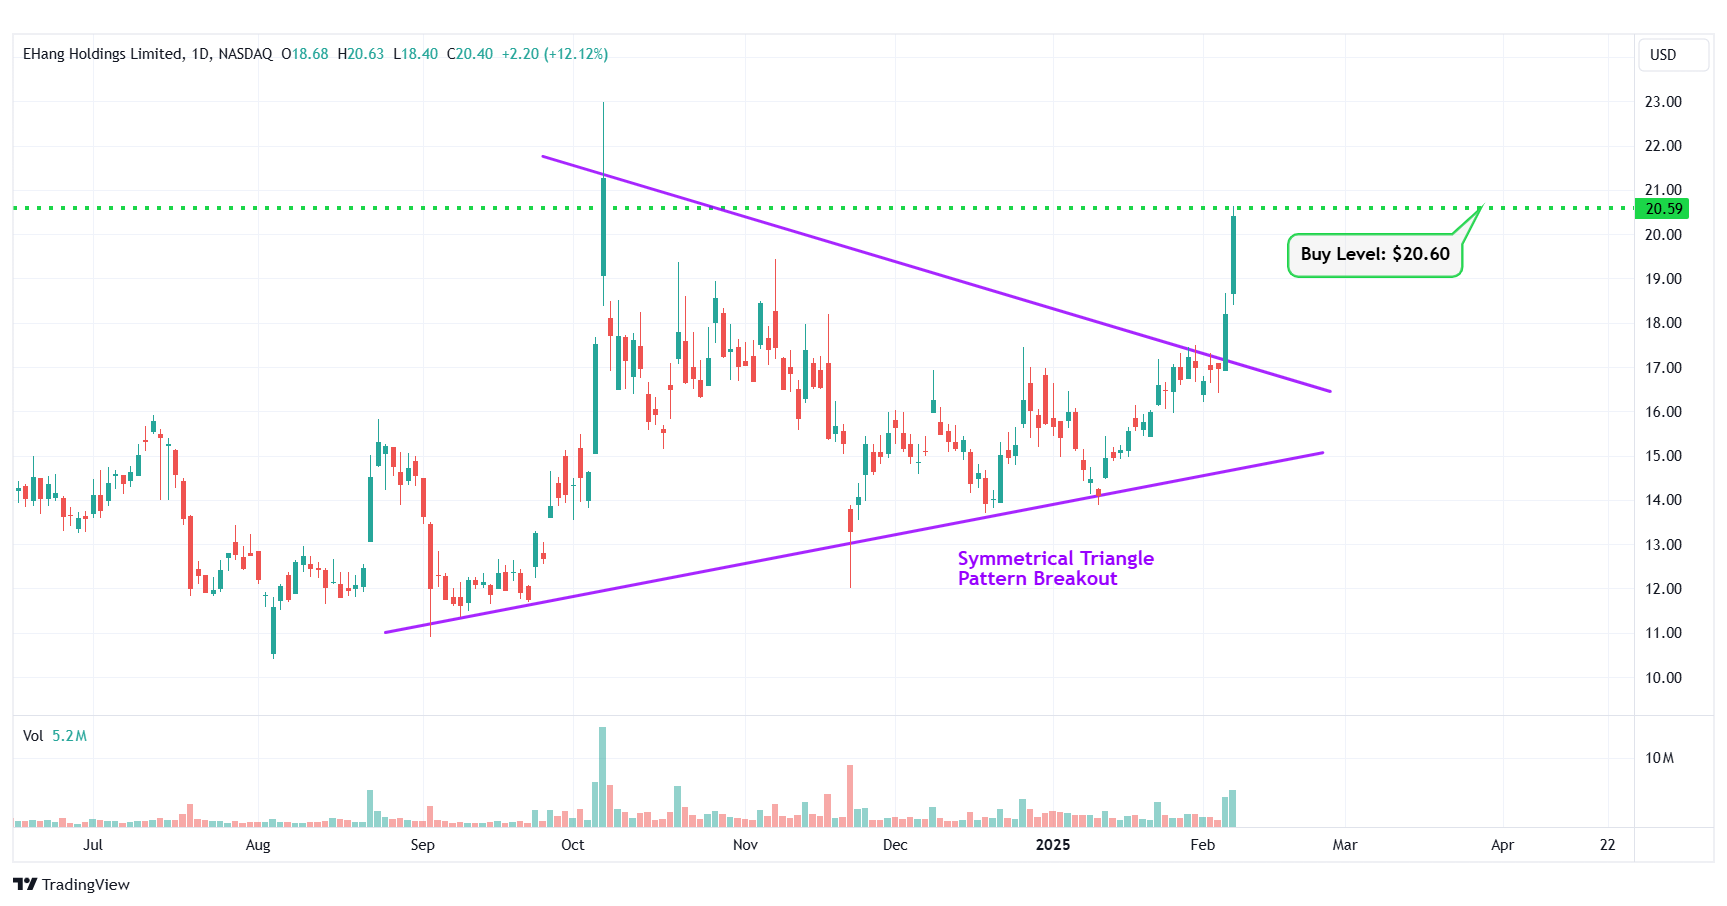
Reason: Symmetrical Triangle Pattern Breakout
A symmetrical triangle is a chart pattern formed by two converging trend lines connecting a series of sequential peaks and troughs. These two lines result in the formation of a triangle that appears to be symmetrical.
A symmetrical triangle pattern is usually formed when there is indecision in the price movements and there is uncertainty among the buyers and sellers. This chart pattern represents a period of consolidation before the price breaks out or breaks down. In case a breakout occurs from the upper trend line, it is a strong bullish indication as it signifies the start of a new bullish trend.
Buy Level(s): The stock has currently broken out of a symmetrical triangle pattern. However, the ideal buy level for EH is if the stock closes above the immediate resistance level of $20.60. This is marked in the chart below as a green color dotted line.
Daily chart – EH
EH – Symmetrical Triangle Pattern Breakout
#7 American Electric Power Company Inc. (NASDAQ: AEP)
Sector: Utilities • Utilities – Regulated Electric
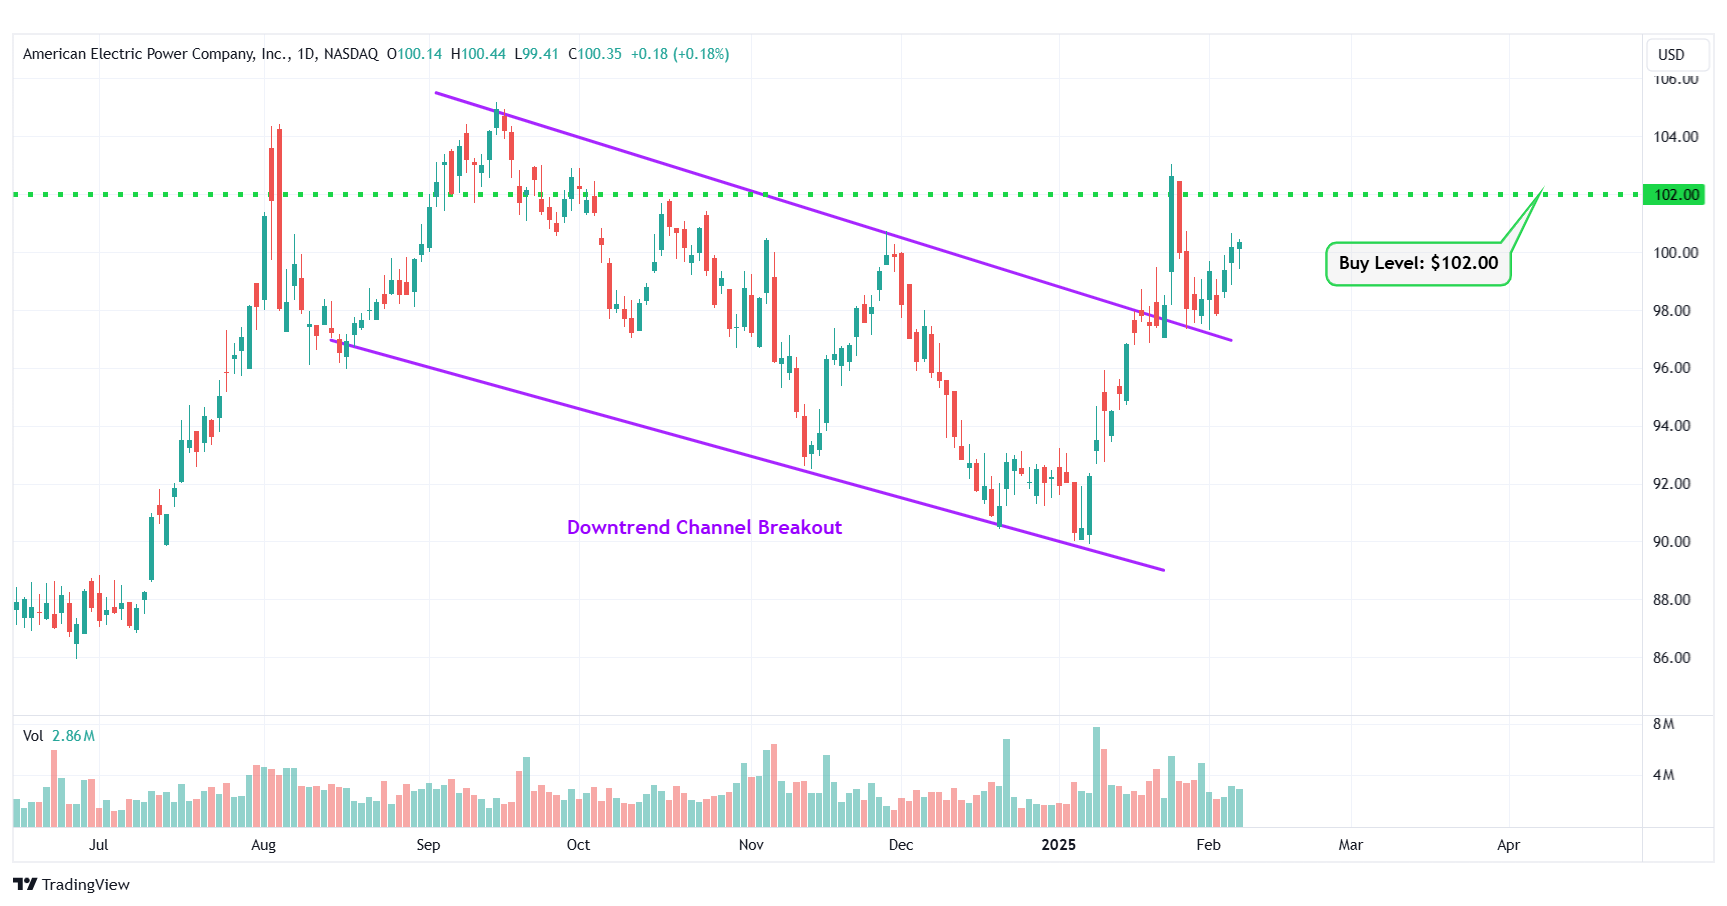
Reason: Downtrend Channel Breakout
A downtrend or descending channel is the price action contained between downward sloping parallel lines. It is formed by two lines that are drawn by connecting the lower highs and lower lows of a stock’s price. Even though this is typically a bearish pattern, a breakout from the upper rail of this pattern is considered a good bullish indication.
Buy Level(s): The daily chart shows that the stock has currently broken out of a downtrend channel. However, there is a near-term resistance level for the stock. Hence, the ideal buy level for AEP is if the stock has a daily close above $102.00. This is marked in the chart below as a green color dotted line.
Daily chart – AEP
AEP – Downtrend Channel Breakout
#8 Futu Holdings Ltd ADR (NASDAQ: FUTU)
Sector: Financial • Capital Markets
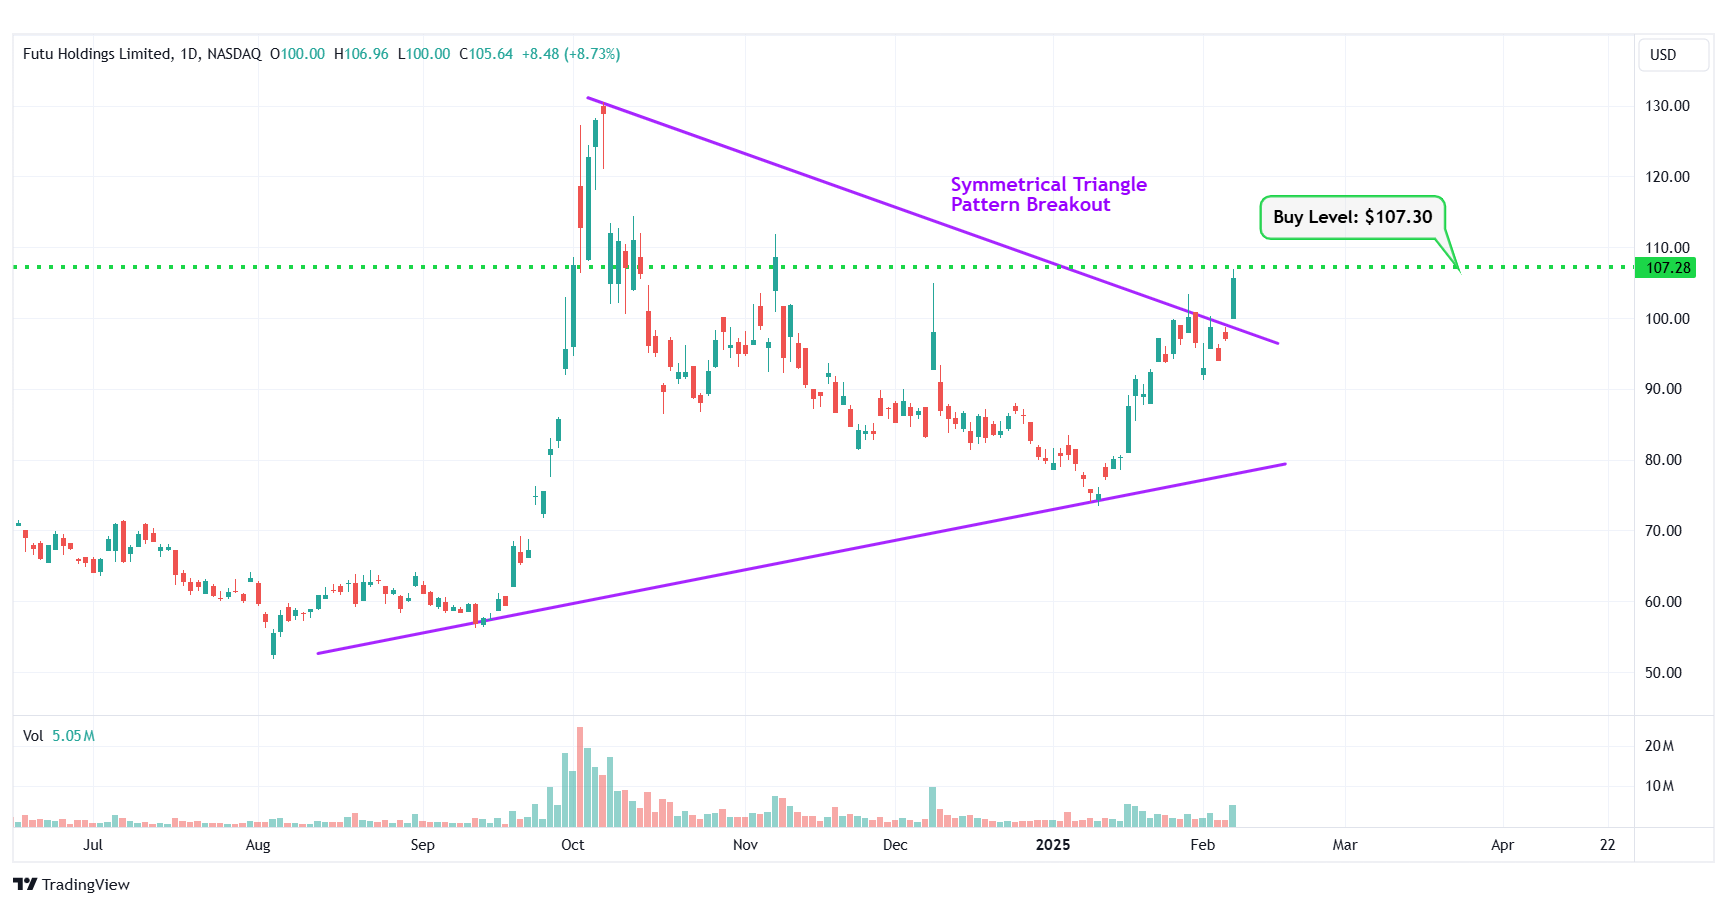
Reason: Symmetrical Triangle Pattern Breakout
A symmetrical triangle is a chart pattern formed by two converging trend lines connecting a series of sequential peaks and troughs. These two lines result in the formation of a triangle that appears to be symmetrical.
A symmetrical triangle pattern is usually formed when there is indecision in the price movements and there is uncertainty among the buyers and sellers. This chart pattern represents a period of consolidation before the price breaks out or breaks down. In case a breakout occurs from the upper trend line, it is a strong bullish indication as it signifies the start of a new bullish trend.
Buy Level(s): The stock has currently broken out of a symmetrical triangle pattern. However, the ideal buy level for FUTU is if the stock closes above the immediate resistance level of $107.30. This is marked in the chart below as a green color dotted line.
Daily chart – FUTU
FUTU – Symmetrical Triangle Pattern Breakout
#9 Super Micro Computer Inc. (NASDAQ: SMCI)
Sector: Technology • Computer Hardware
Reason: Downtrend Channel Breakout
A downtrend or descending channel is the price action contained between downward sloping parallel lines. It is formed by two lines that are drawn by connecting the lower highs and lower lows of a stock’s price. Even though this is typically a bearish pattern, a breakout from the upper rail of this pattern is considered a good bullish indication.
Buy Level(s): The daily chart shows that the stock has currently broken out of a downtrend channel. However, there is a near-term resistance level for the stock. Hence, the ideal buy level for SMCI is if the stock has a daily close above $40.00. This is marked in the chart below as a green color dotted line.
Daily chart – SMCI
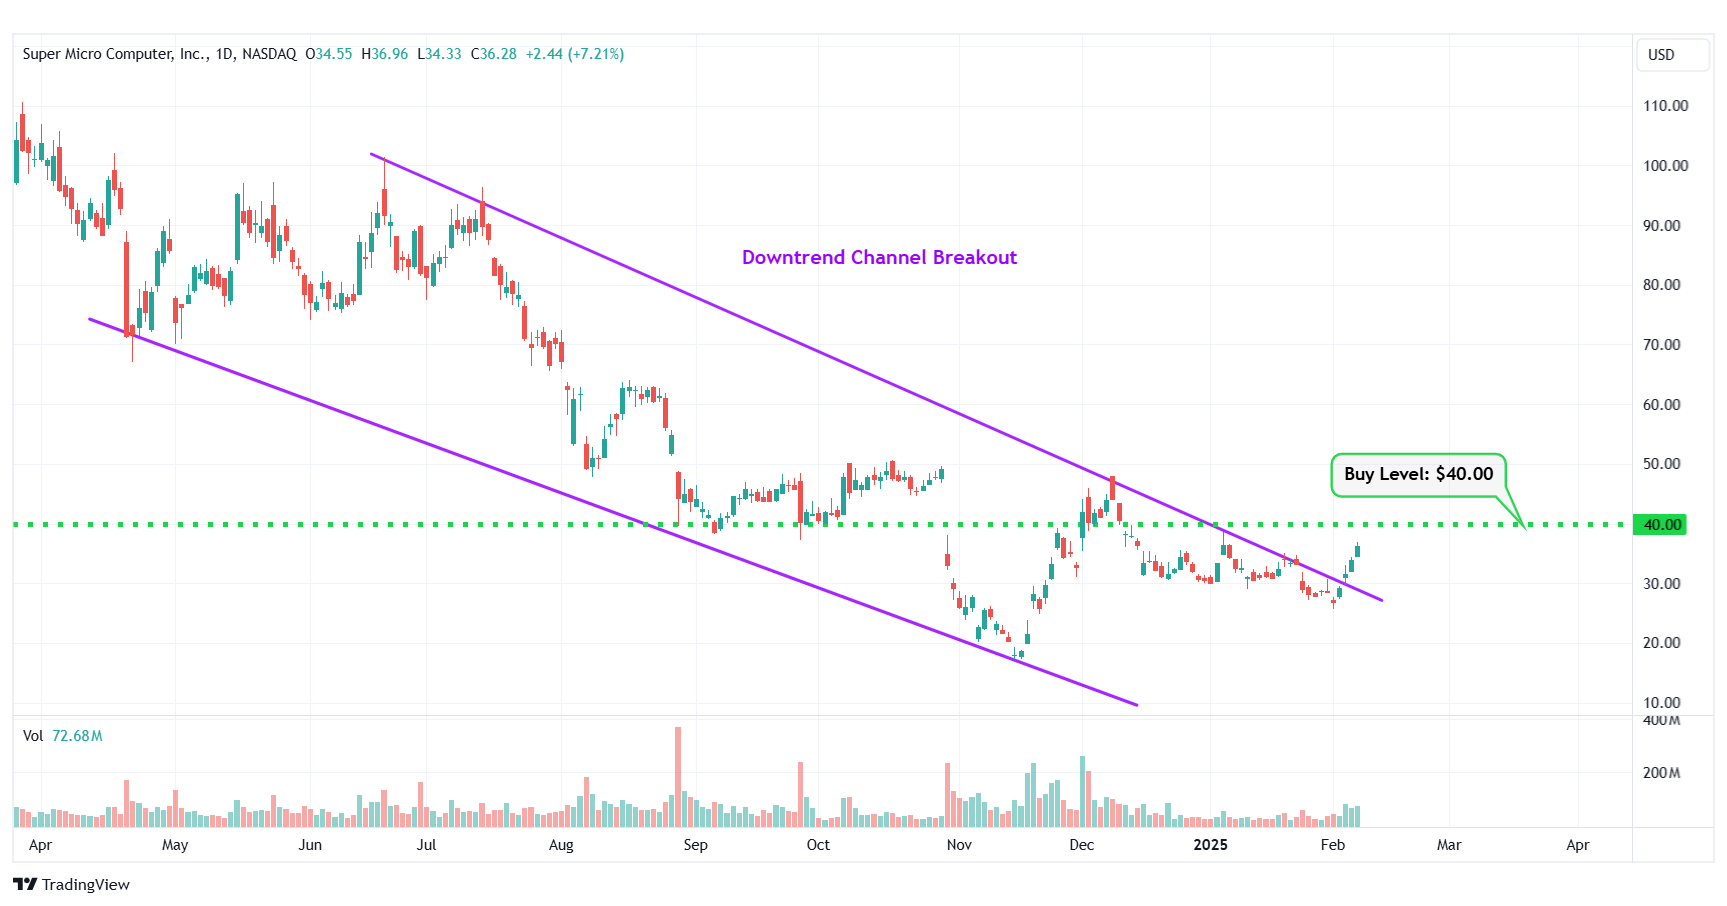
SMCI – Downtrend Channel Breakout
#10 Monolithic Power System Inc. (NASDAQ: MPWR)
Sector: Technology • Semiconductors
Reason: Symmetrical Triangle Pattern Breakout
A symmetrical triangle is a chart pattern formed by two converging trend lines connecting a series of sequential peaks and troughs. These two lines result in the formation of a triangle that appears to be symmetrical.
A symmetrical triangle pattern is usually formed when there is indecision in the price movements and there is uncertainty among the buyers and sellers. This chart pattern represents a period of consolidation before the price breaks out or breaks down. In case a breakout occurs from the upper trend line, it is a strong bullish indication as it signifies the start of a new bullish trend.
Buy Level(s): The stock has currently broken out of a symmetrical triangle pattern. However, the ideal buy level for MPWR is if the stock closes above the immediate resistance level of $735.00. This is marked in the chart below as a green color dotted line.
Daily chart – MPWR
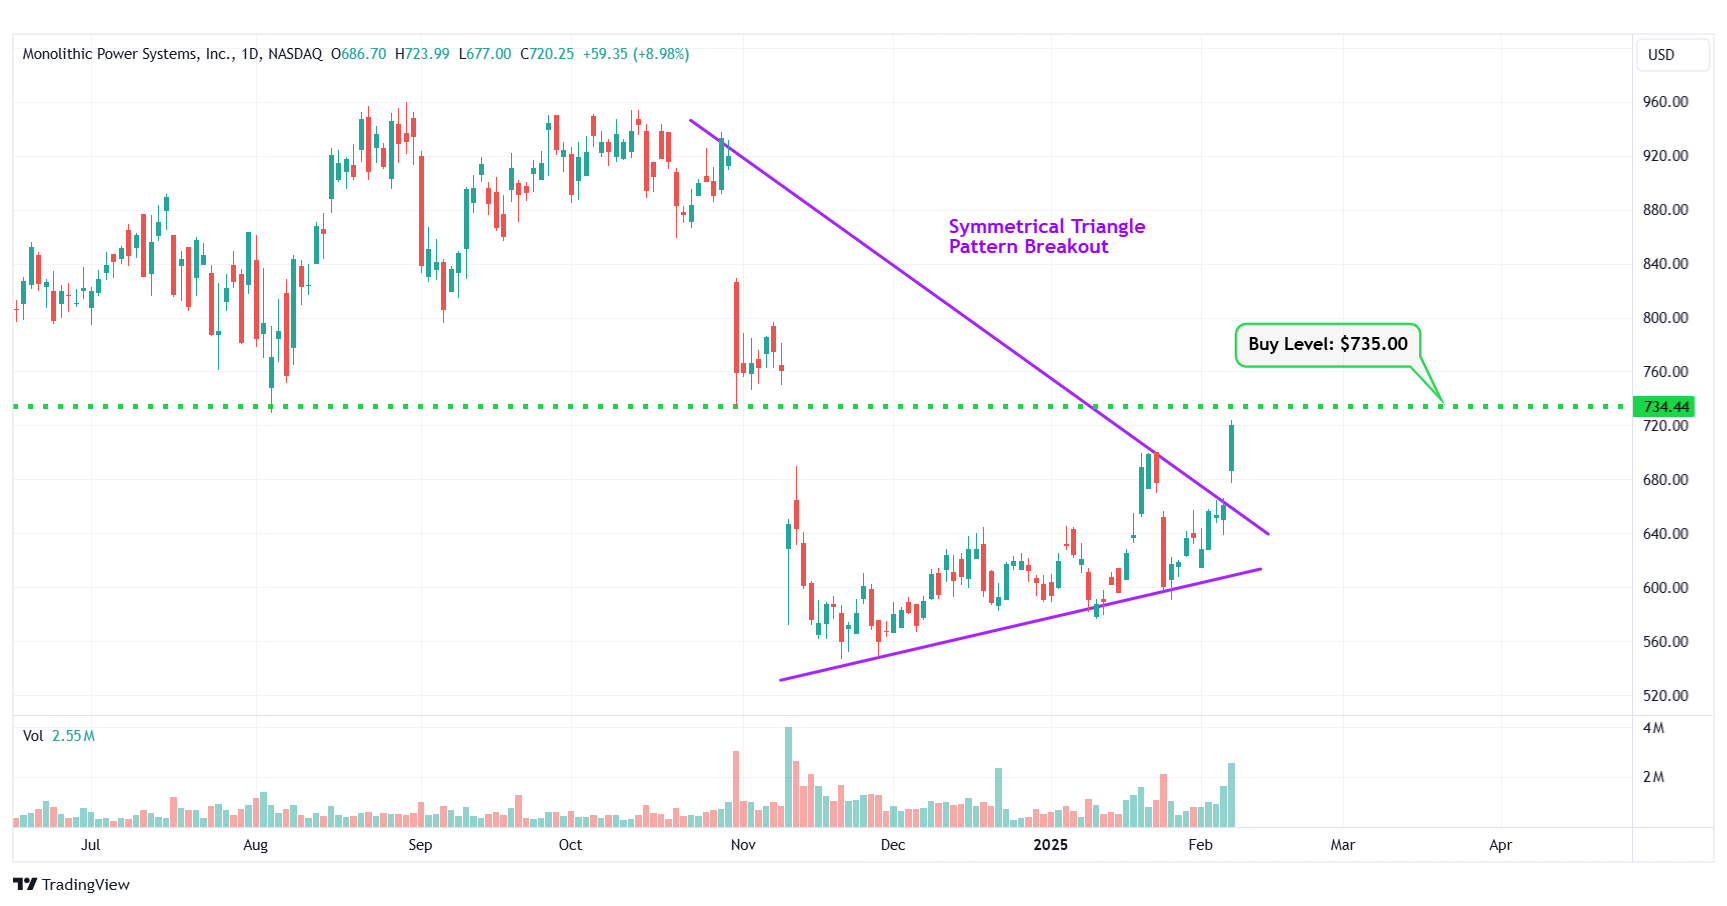
MPWR – Symmetrical Triangle Pattern Breakout
Happy Trading!
Trades of The Day Research Team
I recently visited Mar-a-Lago... And now I'm prepared to put my reputation on the line. Since 1998, my proprietary system would've returned 13,126% in backtests. (That's 13X the S&P and 106X the average investor, according to JP Morgan.) However, one investment I just uncovered could be my biggest winner of all... It involves President Trump, Elon Musk, trillions of dollars, China... And a MAJOR upgrade to the artificial intelligence revolution. See for yourself!
Source: Trades of the Day

