Picking a winning trade on a consistent basis is not simply a stroke of luck. It’s the result of calculated screening, planning, and deliberation.
With this in mind, we have started a new weekly series on our top 10 stocks to watch this week — stocks that look poised for a possible breakout in the coming days. Traders should add these stocks to their watchlist now.
The Top 10 Stocks to Watch This Week for Possible Breakouts
| Sl # | Name of the Stock | Stock Ticker | Last Close | Buy Level(s) | Reason |
| 1 | Rigetti Computing Inc. | NASDAQ: RGTI | $13.17 | $14.10 | Symmetrical Triangle Pattern |
| 2 | Sirius XM Holdings Inc. | NASDAQ: SIRI | $24.01 | $24.50 | Falling Wedge Pattern |
| 3 | Valley National Bancorp | NASDAQ: VLY | $10.28 | $10.60 | Flag Pattern Breakout |
| 4 | Blue Owl Capital Corp | NYSE: OBDC | $15.11 | $15.30 | Symmetrical Triangle Pattern |
| 5 | Franklin Resources, Inc. | NYSE: BEN | $22.24 | $22.70 | Falling Wedge Pattern Breakout |
| 6 |
Lightbridge Corp |
NASDAQ: LTBR | $9.05 | $9.80 | Symmetrical Triangle Pattern |
| 7 | Vertex Pharmaceuticals, Inc. | NASDAQ: VRTX | $461.68 | $469.00 | Downtrend Channel Breakout |
| 8 | Kroger Co. | NYSE: KR | $61.64 | $62.00 | Flag Pattern Breakout |
| 9 | MBIA Inc. | NYSE: MBI | $7.11 | $7.30 | Symmetrical Triangle Pattern Breakout |
| 10 | Parker-Hannifin Corp | NYSE: PH | $707.05 | $710.60 | Flag Pattern Breakout |
Important: Typically, these trades offer a risk: reward ratio of 1:2 or 1:3 in the next 6 months, which implies 2x to 3x rewards when compared to risks. So, be sure to set your stop-loss levels and target prices accordingly to manage your risk. In addition, these trade ideas are triggered using daily closing prices, not intra-day pricing. So, if you participate in these trades, make sure that you only buy the stock once its daily close is above the recommended price level.
That said, here are the top 10 stocks to watch for a breakout, in no particular order.
#1 Rigetti Computing Inc. (NASDAQ: RGTI)
Sector: Technology • Computer Hardware
Reason: Formation of a Symmetrical Triangle Pattern
A symmetrical triangle is a chart pattern formed by two converging trend lines connecting a series of sequential peaks and troughs. These two lines result in the formation of a triangle that appears to be symmetrical.
A symmetrical triangle pattern is usually formed when there is indecision in the price movements and there is uncertainty among the buyers and sellers. This chart pattern represents a period of consolidation before the price breaks out or breaks down. In case a breakout occurs from the upper trend line, it is a strong bullish indication as it signifies the start of a new bullish trend.
Buy Level(s): The ideal buy level for RGTI is if the stock has a daily close above the breakout level of the symmetrical triangle pattern, at around $14.10. This is marked in the chart below as a green color dotted line.
Daily chart – RGTI
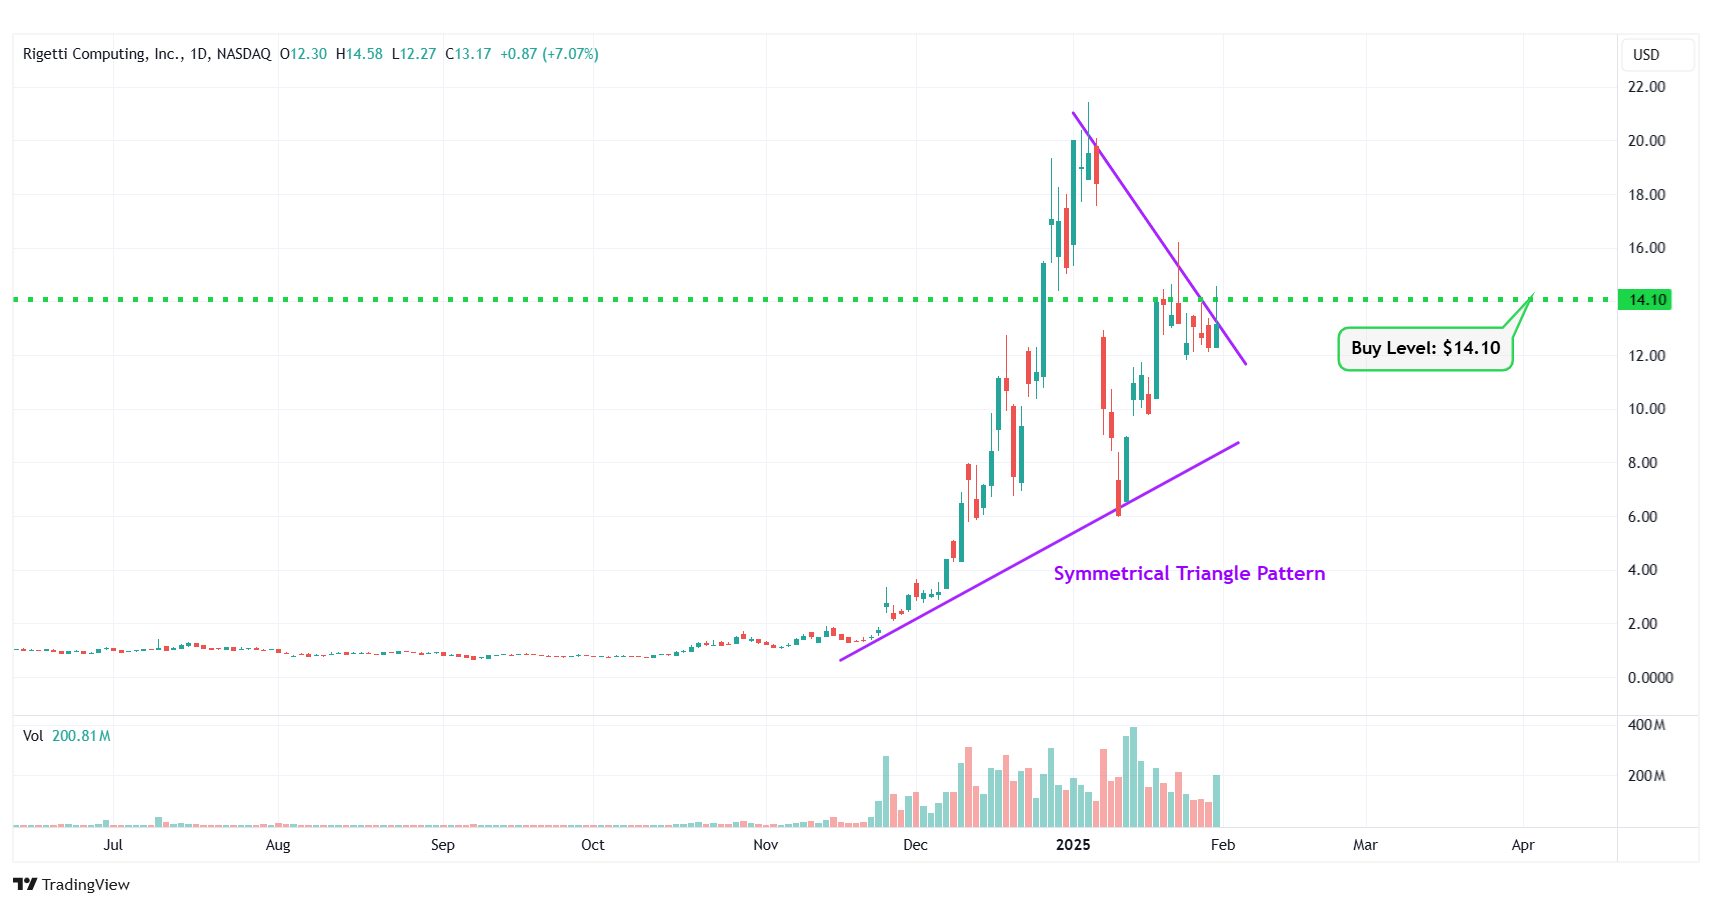
RGTI – Symmetrical Triangle Pattern
#2 Sirius XM Holdings Inc. (NASDAQ: SIRI)
Sector: Communication Services • Entertainment
Reason: Formation of a Falling Wedge Pattern
A falling wedge pattern is formed by joining two downward-sloping, converging trendlines having a contracting range. The pattern appears to be wide at the top and continues to contract as prices fall. A breakout from a falling wedge pattern can indicate either reversal or continuation depending on where the pattern appeared in the trend.
A stock that has broken out of a falling wedge pattern would have gained momentum and would have the potential to move higher.
Buy Level(s): The ideal buy level for SIRI is if the stock breaks out of the falling wedge pattern, at a price of around $24.50. This is marked in the chart below as a green color dotted line.
Daily chart – SIRI
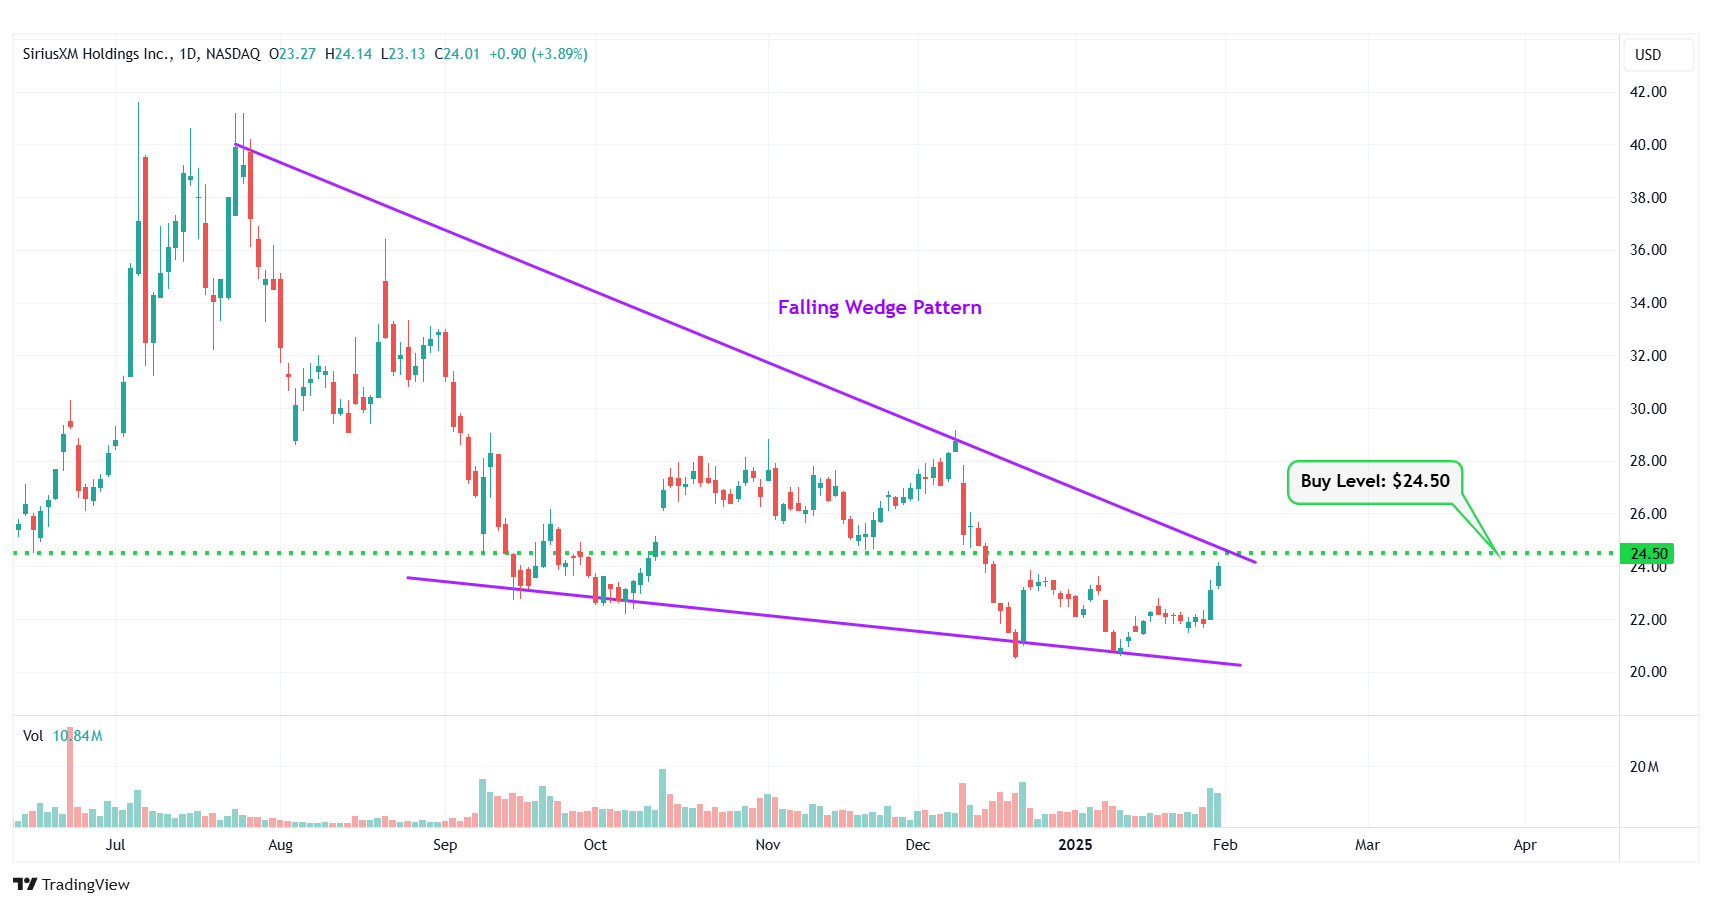
SIRI – Falling Wedge Pattern
#3 Valley National Bancorp (NASDAQ: VLY)
Sector: Financial • Banks – Regional
Reason: Breakout From a Flag Pattern
A flag pattern is a short-term continuation pattern that marks a small consolidation before the previous move resumes. The pattern is formed when the market consolidates in a narrow range after a sharp move. For a stock in an uptrend, a breakout from this pattern is typically a strong bullish indication.
Buy Level(s): Although the stock has currently broken out of the flag pattern, the ideal buy level for VLY is above the near-term resistance level of $10.60. This is marked in the chart below as a green color dotted line.
Daily chart – VLY
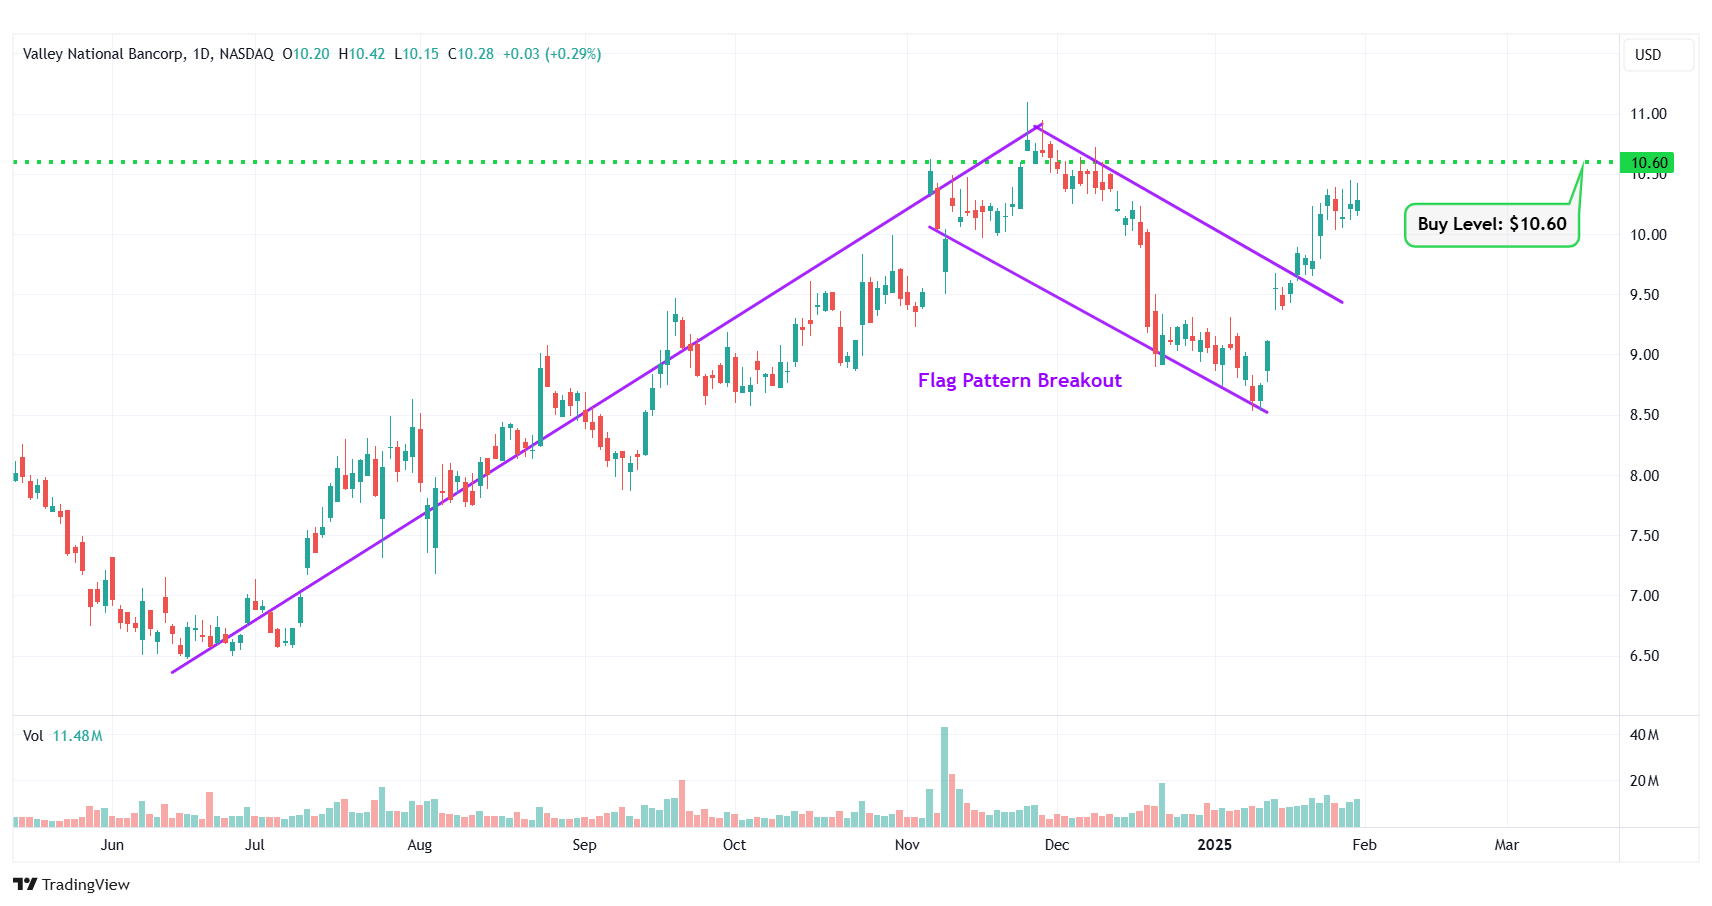
VLY – Flag Pattern Breakout
#4 Blue Owl Capital Corp (NYSE: OBDC)
Sector: Financial • Asset Management
Reason: Formation of a Symmetrical Triangle Pattern
A symmetrical triangle is a chart pattern formed by two converging trend lines connecting a series of sequential peaks and troughs. These two lines result in the formation of a triangle that appears to be symmetrical.
A symmetrical triangle pattern is usually formed when there is indecision in the price movements and there is uncertainty among the buyers and sellers. This chart pattern represents a period of consolidation before the price breaks out or breaks down. In case a breakout occurs from the upper trend line, it is a strong bullish indication as it signifies the start of a new bullish trend.
Buy Level(s): The ideal buy level for OBDC is if the stock has a daily close above the breakout level of the symmetrical triangle pattern, at around $15.30. This is marked in the chart below as a green color dotted line.
Daily chart – OBDC
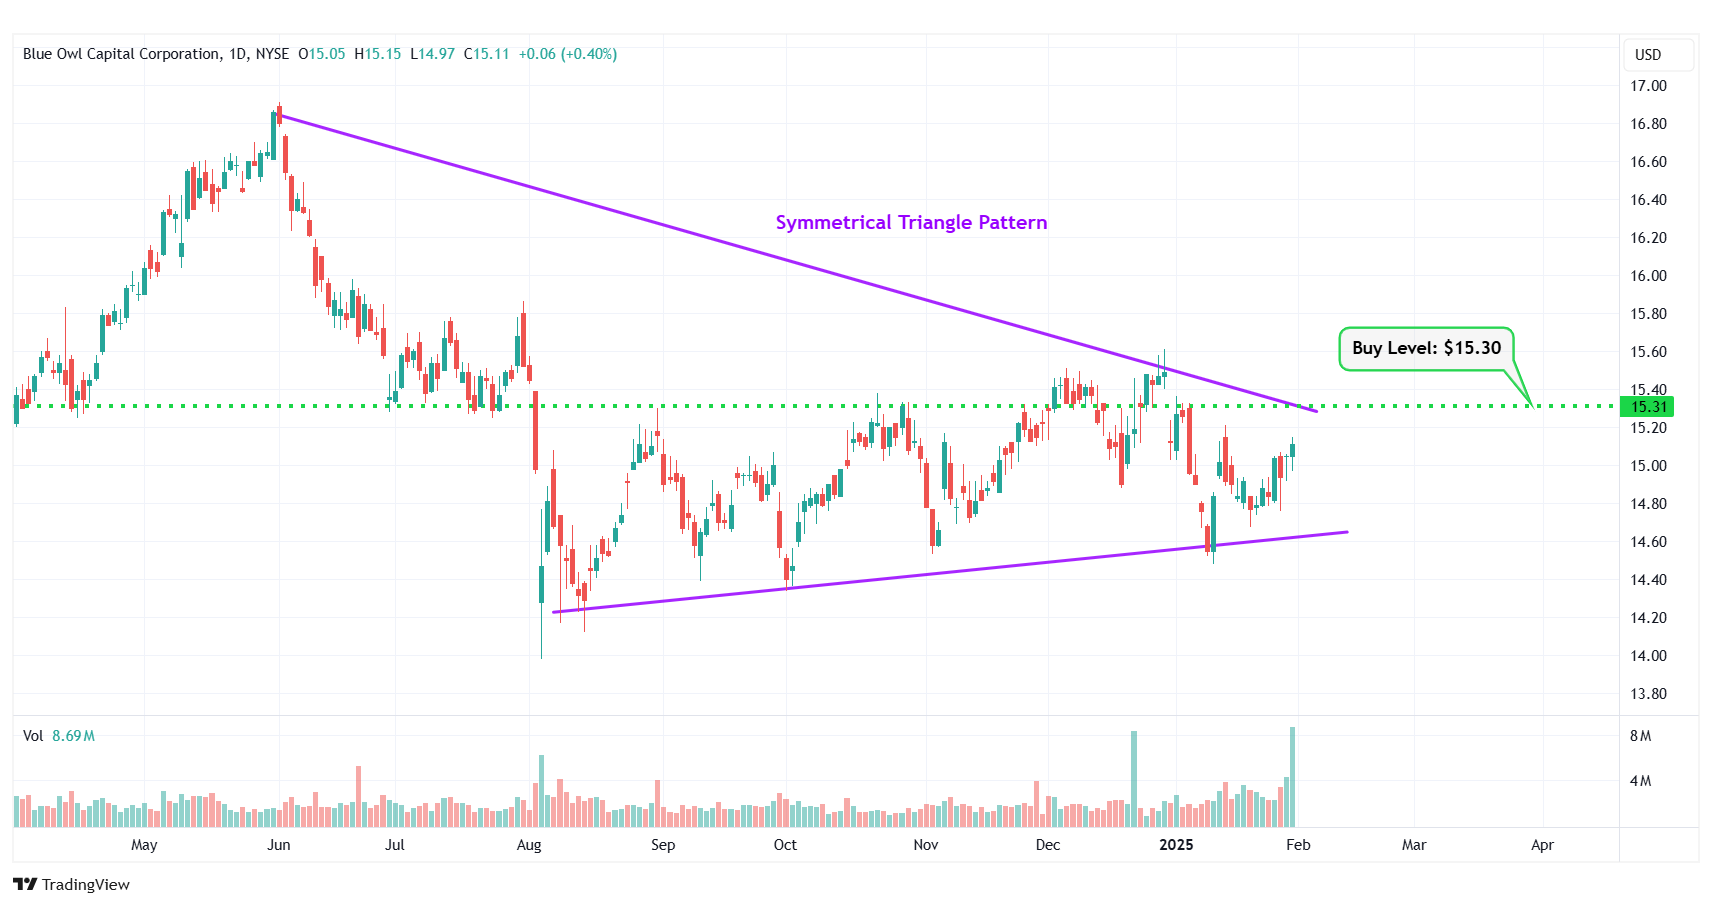
OBDC – Symmetrical Triangle Pattern
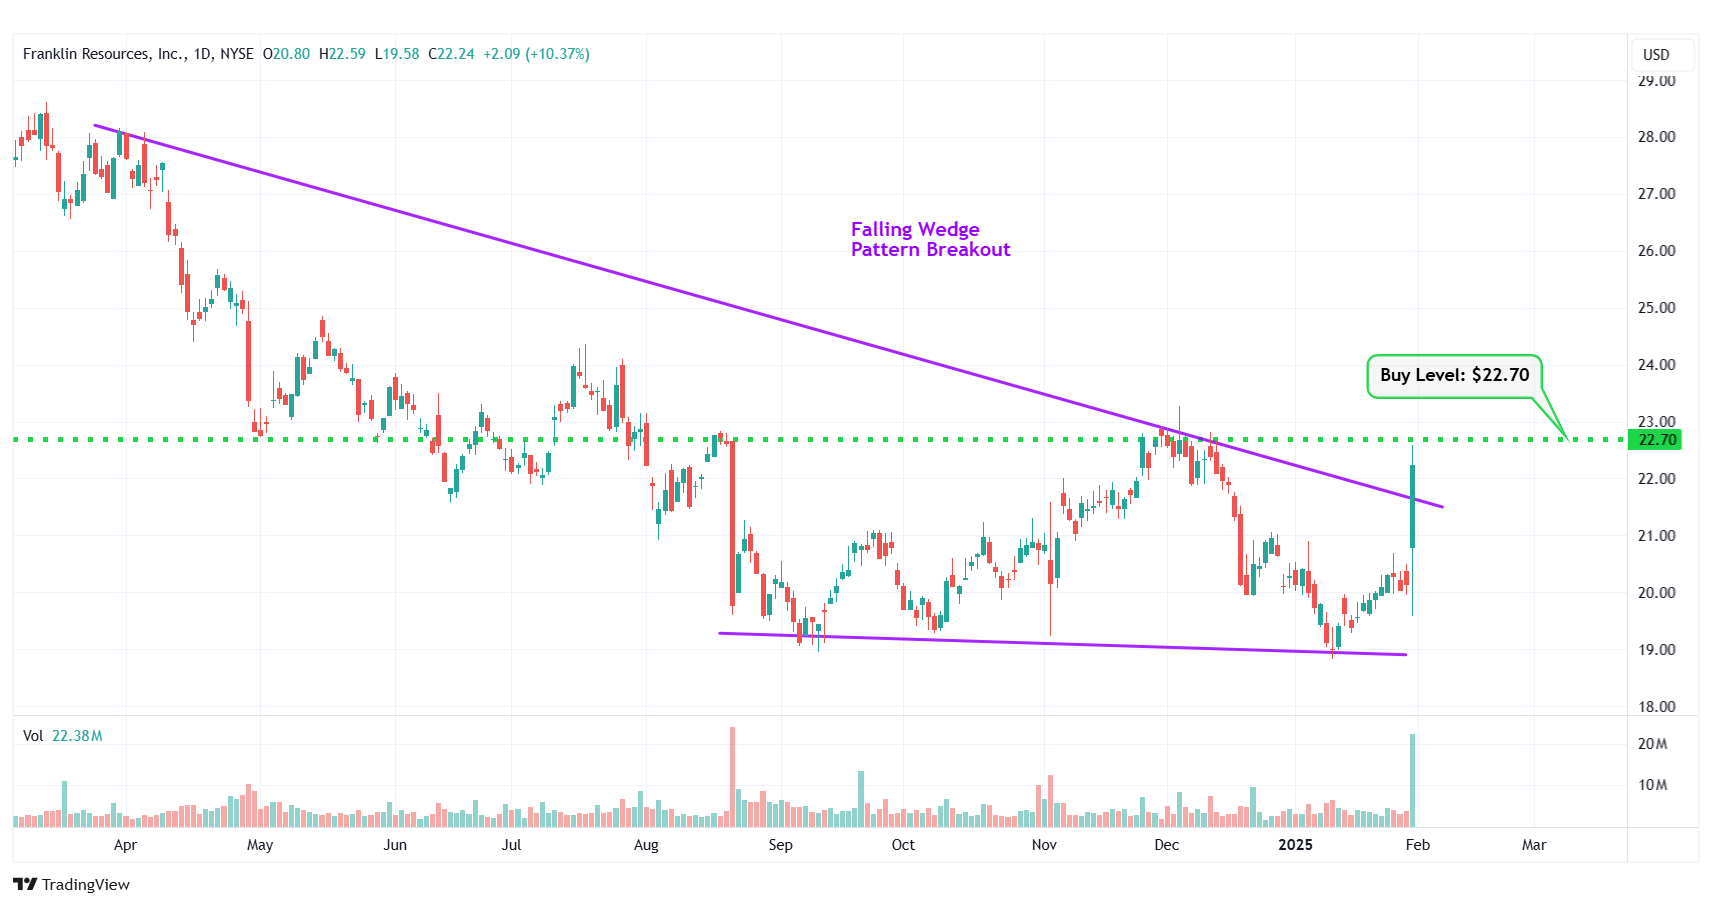
#5 Franklin Resources, Inc. (NYSE: BEN)
Sector: Financial • Asset Management
Reason: Falling Wedge Pattern Breakout
A falling wedge pattern is formed by joining two downward-sloping, converging trendlines having a contracting range. The pattern appears to be wide at the top and continues to contract as prices fall. A breakout from a falling wedge pattern can indicate either reversal or continuation depending on where the pattern appeared in the trend.
A stock that has broken out of a falling wedge pattern would have gained momentum and would have the potential to move higher.
Buy Level(s): The stock has currently broken out of a falling wedge pattern. However, the ideal buy level for BEN is above the nearest resistance level of $22.70. This is marked in the chart below as a green color dotted line.
Daily chart – BEN
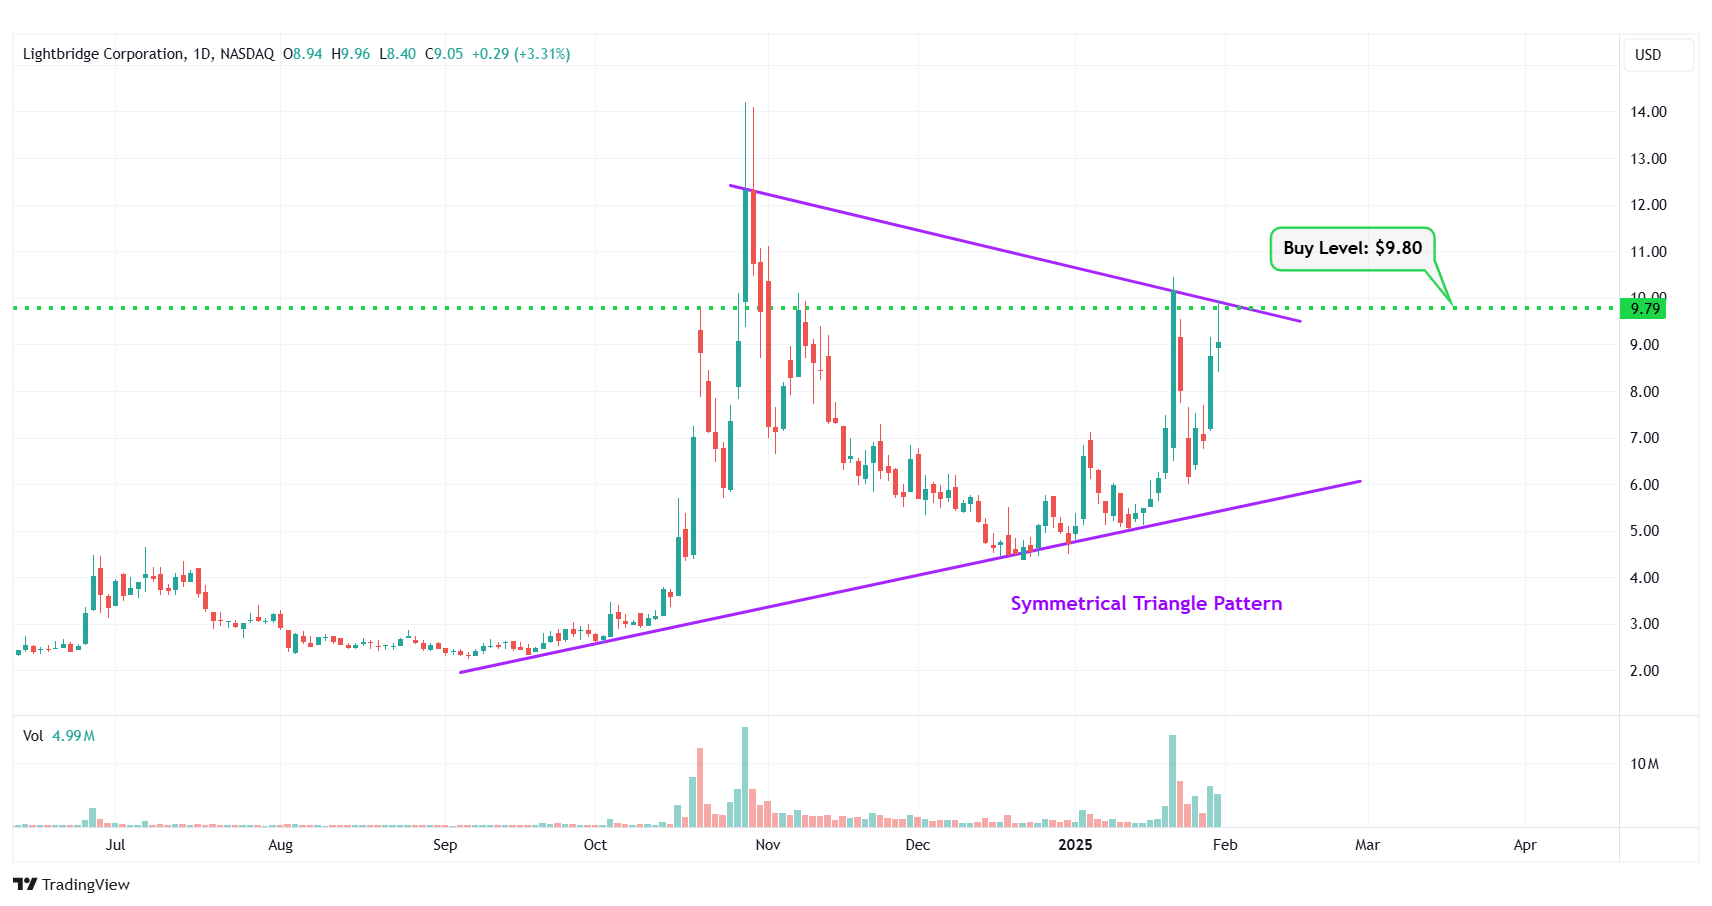
#6 Lightbridge Corp (NASDAQ: LTBR)
Sector: Industrials • Electrical Equipment & Parts
Reason: Formation of a Symmetrical Triangle Pattern
A symmetrical triangle is a chart pattern formed by two converging trend lines connecting a series of sequential peaks and troughs. These two lines result in the formation of a triangle that appears to be symmetrical.
A symmetrical triangle pattern is usually formed when there is indecision in the price movements and there is uncertainty among the buyers and sellers. This chart pattern represents a period of consolidation before the price breaks out or breaks down. In case a breakout occurs from the upper trend line, it is a strong bullish indication as it signifies the start of a new bullish trend.
Buy Level(s): The ideal buy level for LTBR is if the stock has a daily close above the breakout level of the symmetrical triangle pattern, at around $9.80. This is marked in the chart below as a green color dotted line.
Daily chart – LTBR
#7 Vertex Pharmaceuticals, Inc. (NASDAQ: VRTX)
Sector: Healthcare • Biotechnology
Reason: Downtrend Channel Breakout
A downtrend or descending channel is the price action contained between downward sloping parallel lines. It is formed by two lines that are drawn by connecting the lower highs and lower lows of a stock’s price. Even though this is typically a bearish pattern, a breakout from the upper rail of this pattern is considered a good bullish indication.
Buy Level(s): The daily chart shows that the stock has currently broken out of a downtrend channel. However, there is a near-term resistance level for the stock. Hence, the ideal buy level for VRTX is if the stock has a daily close above $469.00. This is marked in the chart below as a green color dotted line.
Daily chart – VRTX
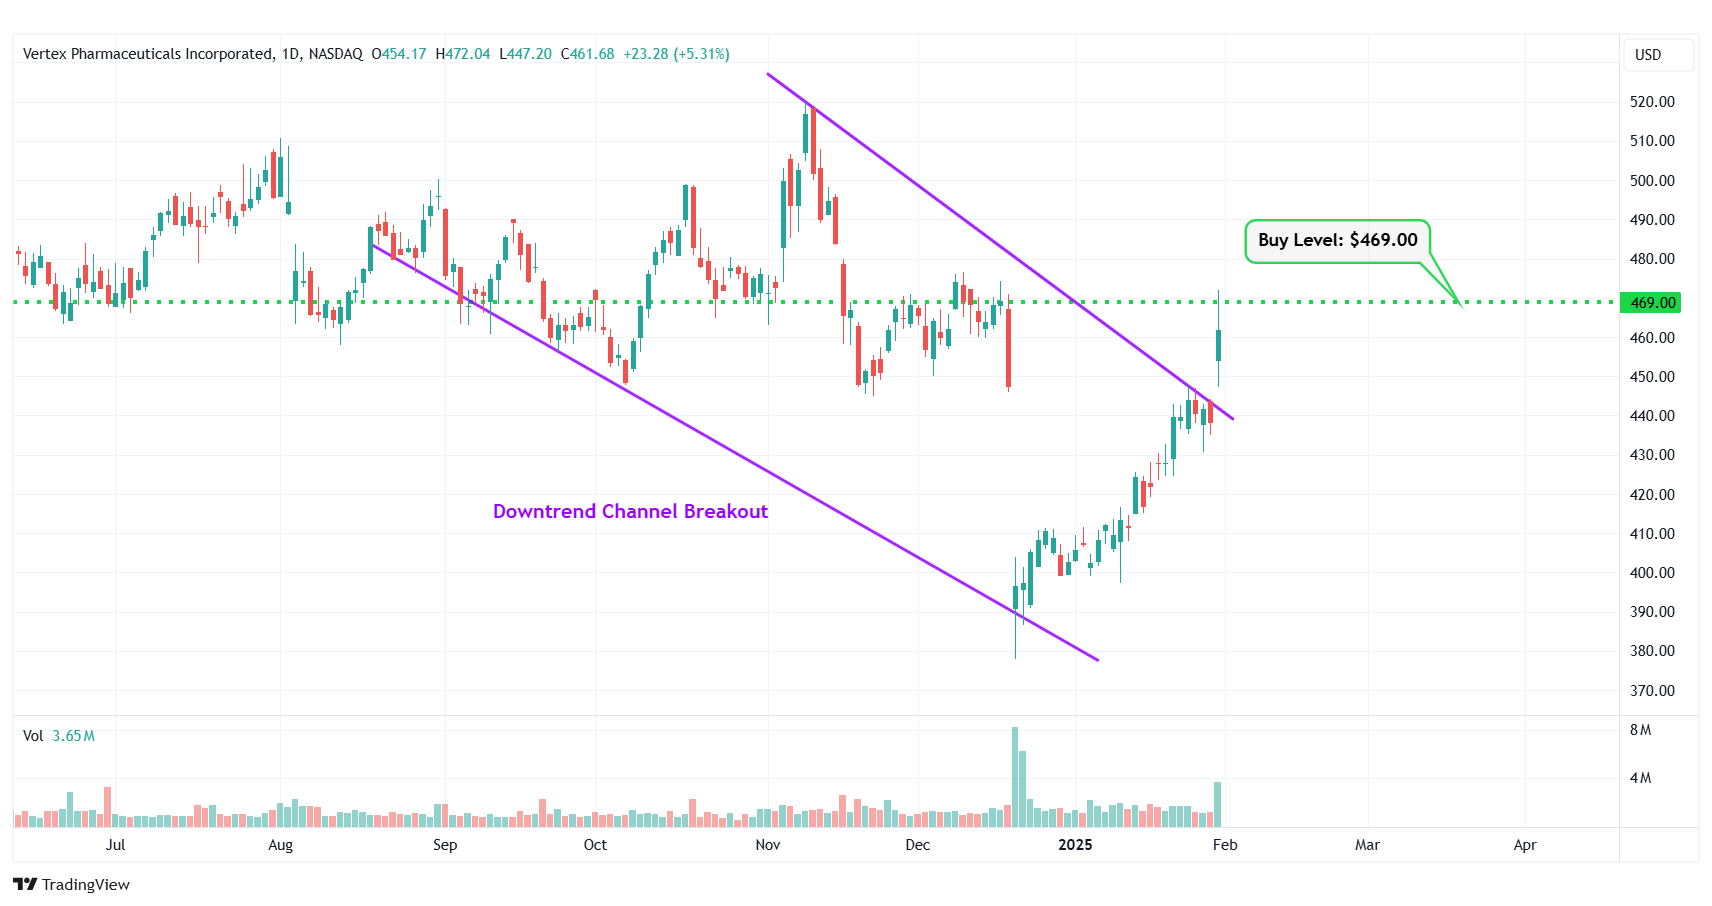
VRTX – Downtrend Channel Breakout
#8 Kroger Co. (NYSE: KR)
Sector: Consumer Defensive • Grocery Stores
Reason: Breakout From a Flag Pattern
A flag pattern is a short-term continuation pattern that marks a small consolidation before the previous move resumes. The pattern is formed when the market consolidates in a narrow range after a sharp move. For a stock in an uptrend, a breakout from this pattern is typically a strong bullish indication.
Buy Level(s): Although the stock has currently broken out of the flag pattern, the ideal buy level for KR is above the near-term resistance level of $62.00. This is marked in the chart below as a green color dotted line.
Daily chart – KR
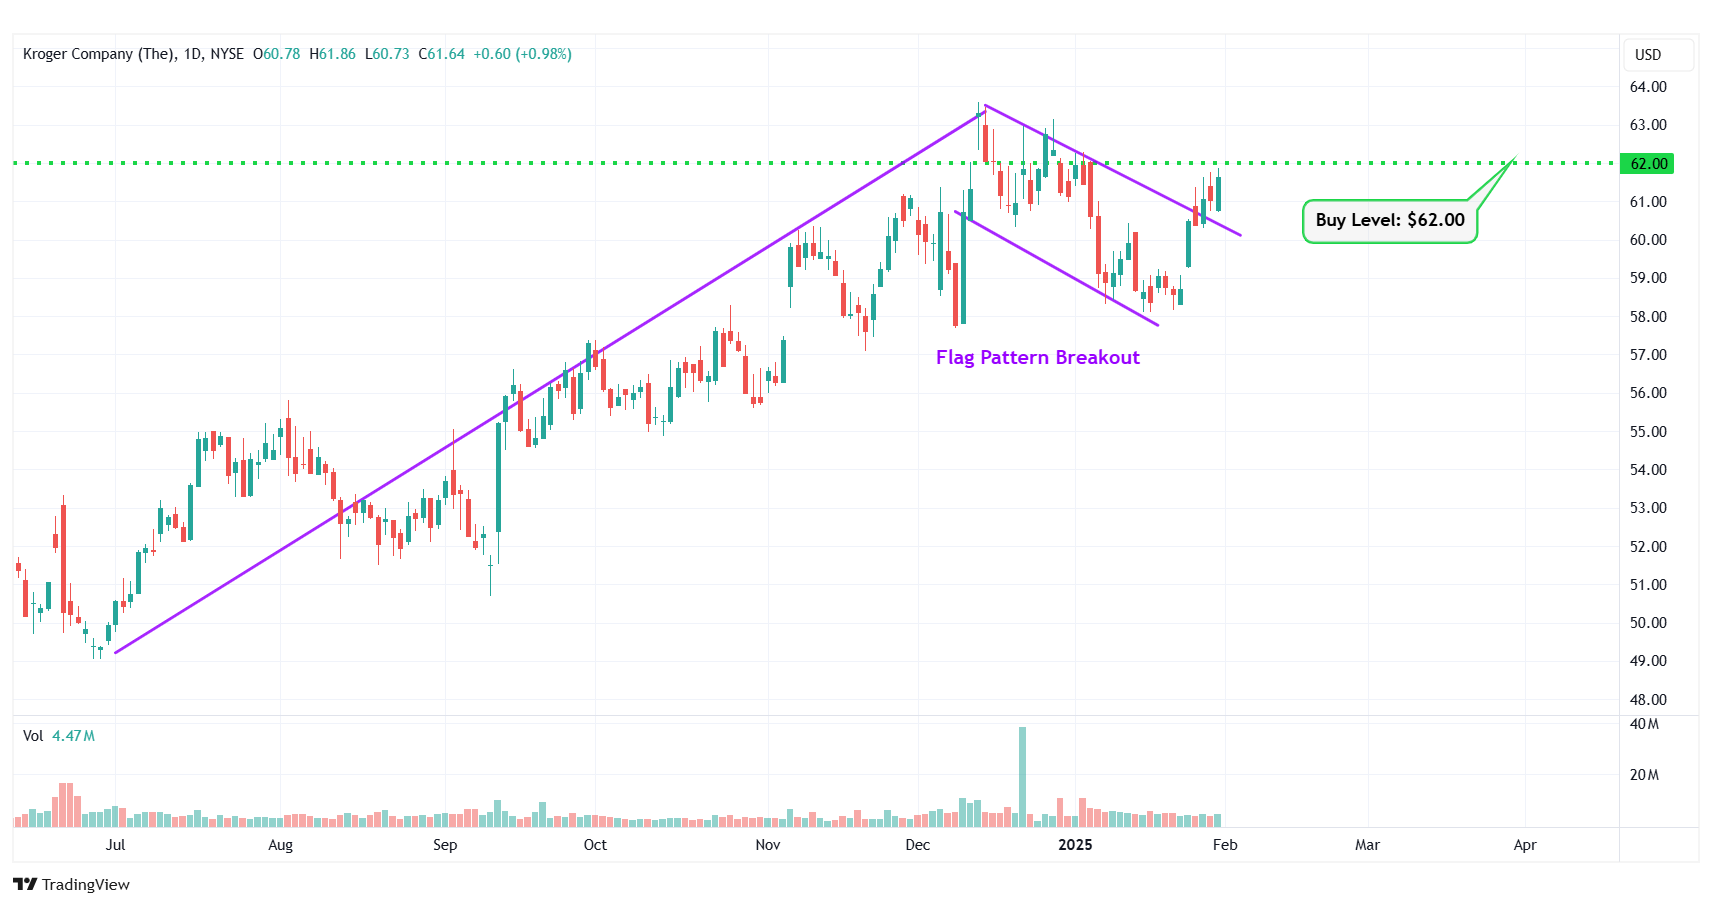
KR – Flag Pattern Breakout
#9 MBIA Inc. (NYSE: MBI)
Sector: Financial • Insurance – Specialty
Reason: Symmetrical Triangle Pattern Breakout
A symmetrical triangle is a chart pattern formed by two converging trend lines connecting a series of sequential peaks and troughs. These two lines result in the formation of a triangle that appears to be symmetrical.
A symmetrical triangle pattern is usually formed when there is indecision in the price movements and there is uncertainty among the buyers and sellers. This chart pattern represents a period of consolidation before the price breaks out or breaks down. In case a breakout occurs from the upper trend line, it is a strong bullish indication as it signifies the start of a new bullish trend.
Buy Level(s): The stock has currently broken out of a symmetrical triangle pattern. However, the ideal buy level for MBI is if the stock closes above the immediate resistance level of $7.30. This is marked in the chart below as a green color dotted line.
Daily chart – MBI
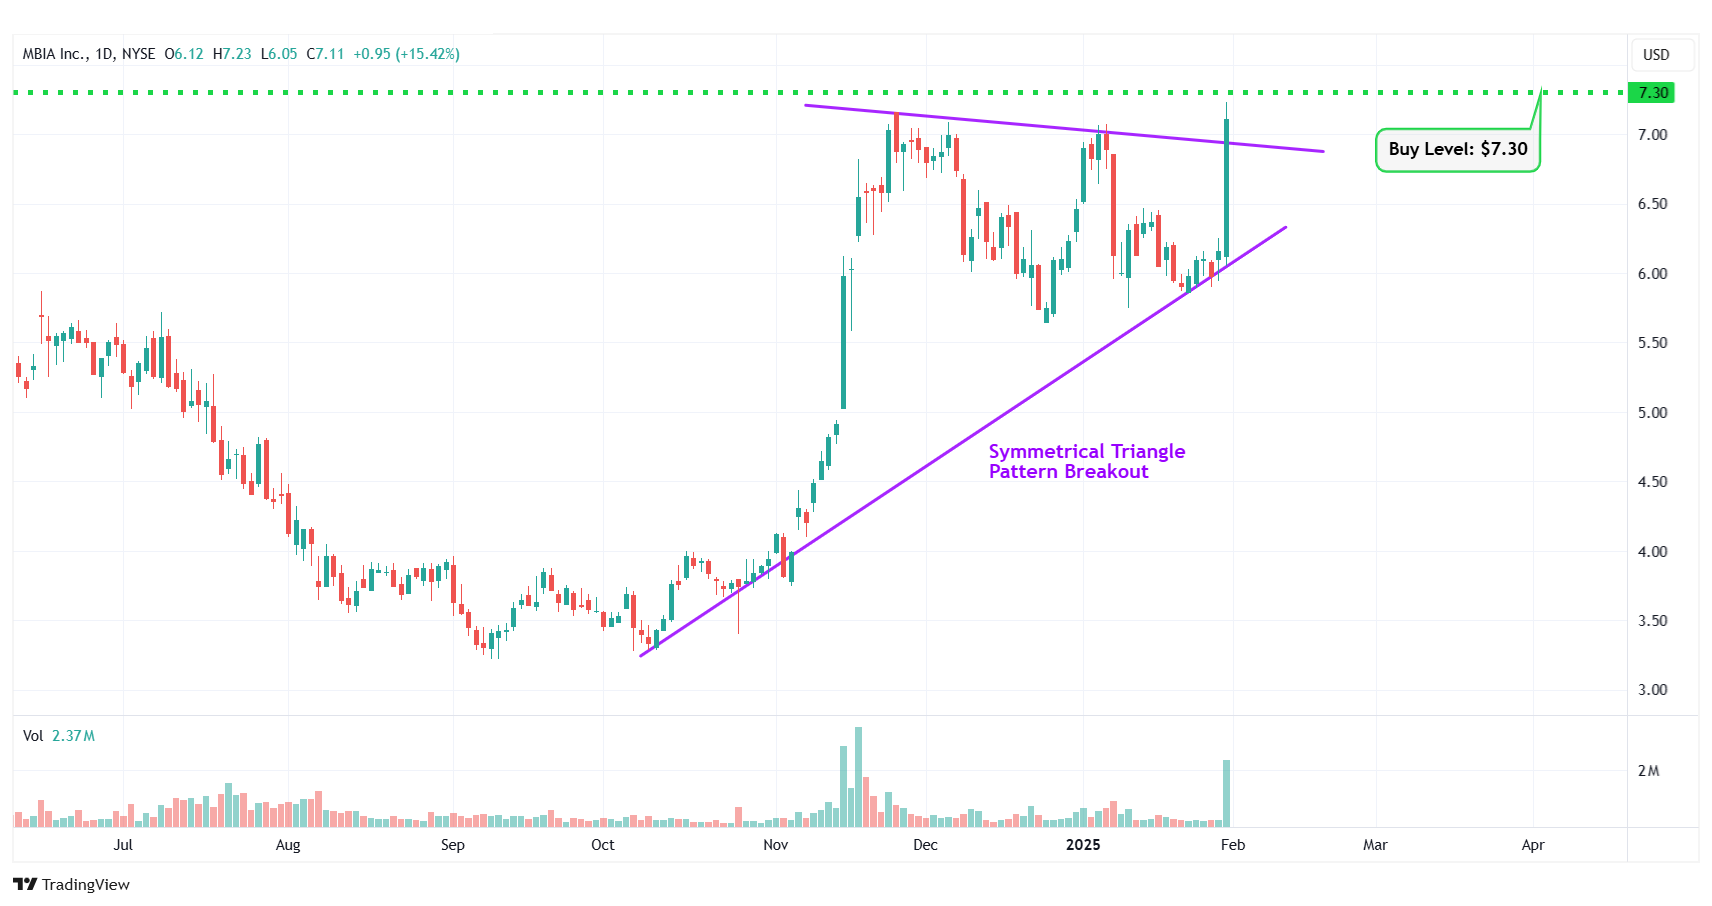
MBI – Symmetrical Triangle Pattern Breakout
#10 Parker-Hannifin Corp (NYSE: PH)
Sector: Industrials • Specialty Industrial Machinery
Reason: Breakout From a Flag Pattern
A flag pattern is a short-term continuation pattern that marks a small consolidation before the previous move resumes. The pattern is formed when the market consolidates in a narrow range after a sharp move. For a stock in an uptrend, a breakout from this pattern is typically a strong bullish indication.
Buy Level(s): Although the stock has currently broken out of the flag pattern, the ideal buy level for PH is above the near-term resistance level of $710.60. This is marked in the chart below as a green color dotted line.
Daily chart – PH
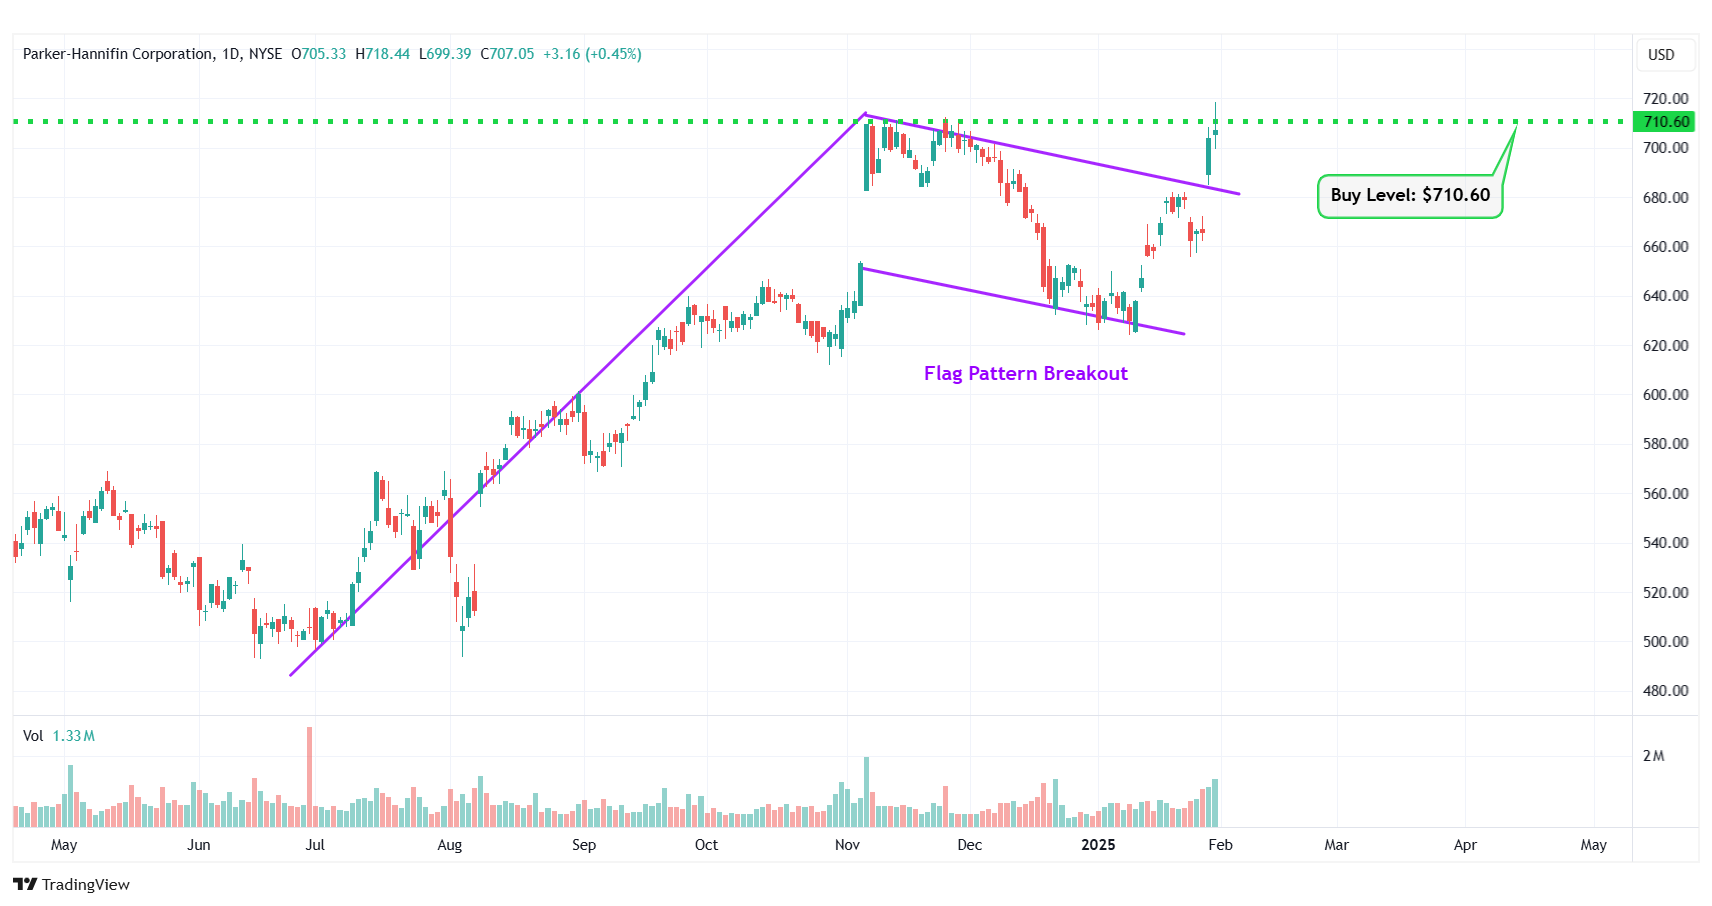
PH – Flag Pattern Breakout
Happy Trading!
Trades of The Day Research Team
To carry out Trump's Executive Order #14196 initiative, the administration will have to partner with a handful of U.S. companies that control the "reserve accounts" sitting on trillions of dollars' worth of untapped natural resources. I've spent months digging into this – and I've identified three companies that have already been granted "emergency status" and fast-track approvals. I believe their shares could skyrocket once new capital starts moving into the sector. See the three stocks that I expect to be the biggest winners as this plan rolls.
Source: Trades of the Day

