Picking a winning trade on a consistent basis is not simply a stroke of luck. It’s the result of calculated screening, planning, and deliberation.
With this in mind, we have started a new weekly series on our top 10 stocks to watch this week — stocks that look poised for a possible breakout in the coming days. Traders should add these stocks to their watchlist now.
The Top 10 Stocks to Watch This Week for Possible Breakouts
| Sl # | Name of the Stock | Stock Ticker | Last Close | Buy Level(s) | Reason |
| 1 | ACM Research Inc. | NASDAQ: ACMR | $22.04 | $22.50 | Downtrend Channel Breakout |
| 2 | Jetblue Airways Corp | NASDAQ: JBLU | $7.30 | $7.50 | Symmetrical Triangle Pattern Breakout |
| 3 | Piedmont Lithium Inc. | NASDAQ: PLL | $11.90 | $13.00 | Falling Wedge Pattern Breakout |
| 4 | Occidental Petroleum Corp. | NYSE: OXY | $55.76 | $57.30 | Downtrend Channel |
| 5 | Barnes Group Inc. | NYSE: B | $45.26 | $46.20 | Flag Pattern Breakout |
| 6 | Albemarle Corp. | NYSE: ALB | $102.09 | $108.80 | Symmetrical Triangle Pattern Breakout |
| 7 | Devon Energy Corp. | NYSE: DVN | $42.42 | $43.90 | Downtrend Channel |
| 8 | Exxon Mobil Corp. | NYSE: XOM | $124.83 | $125.30 | Symmetrical Triangle Pattern Breakout |
| 9 | Conoco Phillips | NYSE: COP | $114.54 | $115.20 | Downtrend Channel Breakout |
| 10 | MoonLake Immunotherapeutics | NASDAQ: MLTX | $55.28 | $56.10 | Symmetrical Triangle Pattern |
Important: Typically, these trades offer a risk: reward ratio of 1:2 or 1:3 in the next 6 months, which implies 2x to 3x rewards when compared to risks. So, be sure to set your stop-loss levels and target prices accordingly to manage your risk. In addition, these trade ideas are triggered using daily closing prices, not intra-day pricing. So, if you participate in these trades, make sure that you only buy the stock once its daily close is above the recommended price level.
That said, here are the top 10 stocks to watch for a breakout, in no particular order.
#1 ACM Research Inc. (NASDAQ: ACMR)
Sector: Technology • Semiconductor Equipment & Materials
Reason: Downtrend Channel Breakout
A downtrend or descending channel is the price action contained between downward sloping parallel lines. It is formed by two lines that are drawn by connecting the lower highs and lower lows of a stock’s price. Even though this is typically a bearish pattern, a breakout from the upper rail of this pattern is considered a good bullish indication.
Buy Level(s): The daily chart shows that the stock has currently broken out of a downtrend channel. However, there is a near-term resistance level for the stock. Hence, the ideal buy level for ACMR is if the stock has a daily close above $22.50. This is marked in the chart below as a green color dotted line.
Daily chart – ACMR
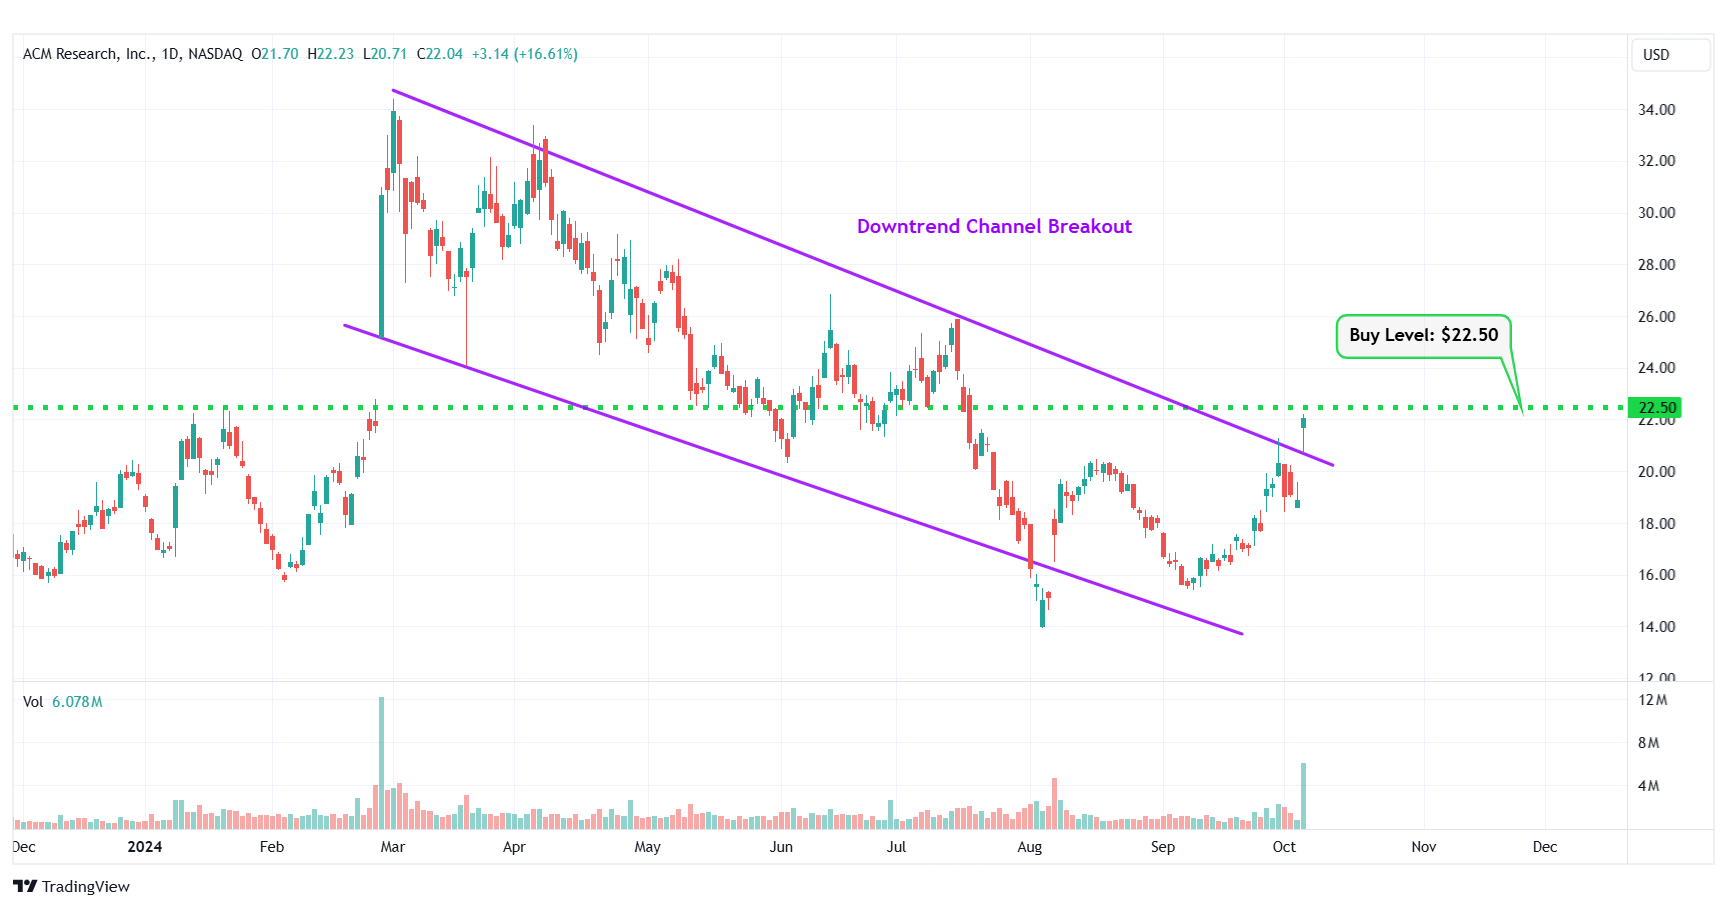
ACMR – Downtrend Channel Breakout
#2 Jetblue Airways Corp (NASDAQ: JBLU)
Sector: Industrials • Airlines
Reason: Symmetrical Triangle Pattern Breakout
A symmetrical triangle is a chart pattern formed by two converging trend lines connecting a series of sequential peaks and troughs. These two lines result in the formation of a triangle that appears to be symmetrical.
A symmetrical triangle pattern is usually formed when there is indecision in the price movements and there is uncertainty among the buyers and sellers. This chart pattern represents a period of consolidation before the price breaks out or breaks down. In case a breakout occurs from the upper trend line, it is a strong bullish indication as it signifies the start of a new bullish trend.
Buy Level(s): The stock has currently broken out of a symmetrical triangle pattern. However, the ideal buy level for JBLU is if the stock closes above the immediate resistance level of $7.50. This is marked in the chart below as a green color dotted line.
Daily chart – JBLU
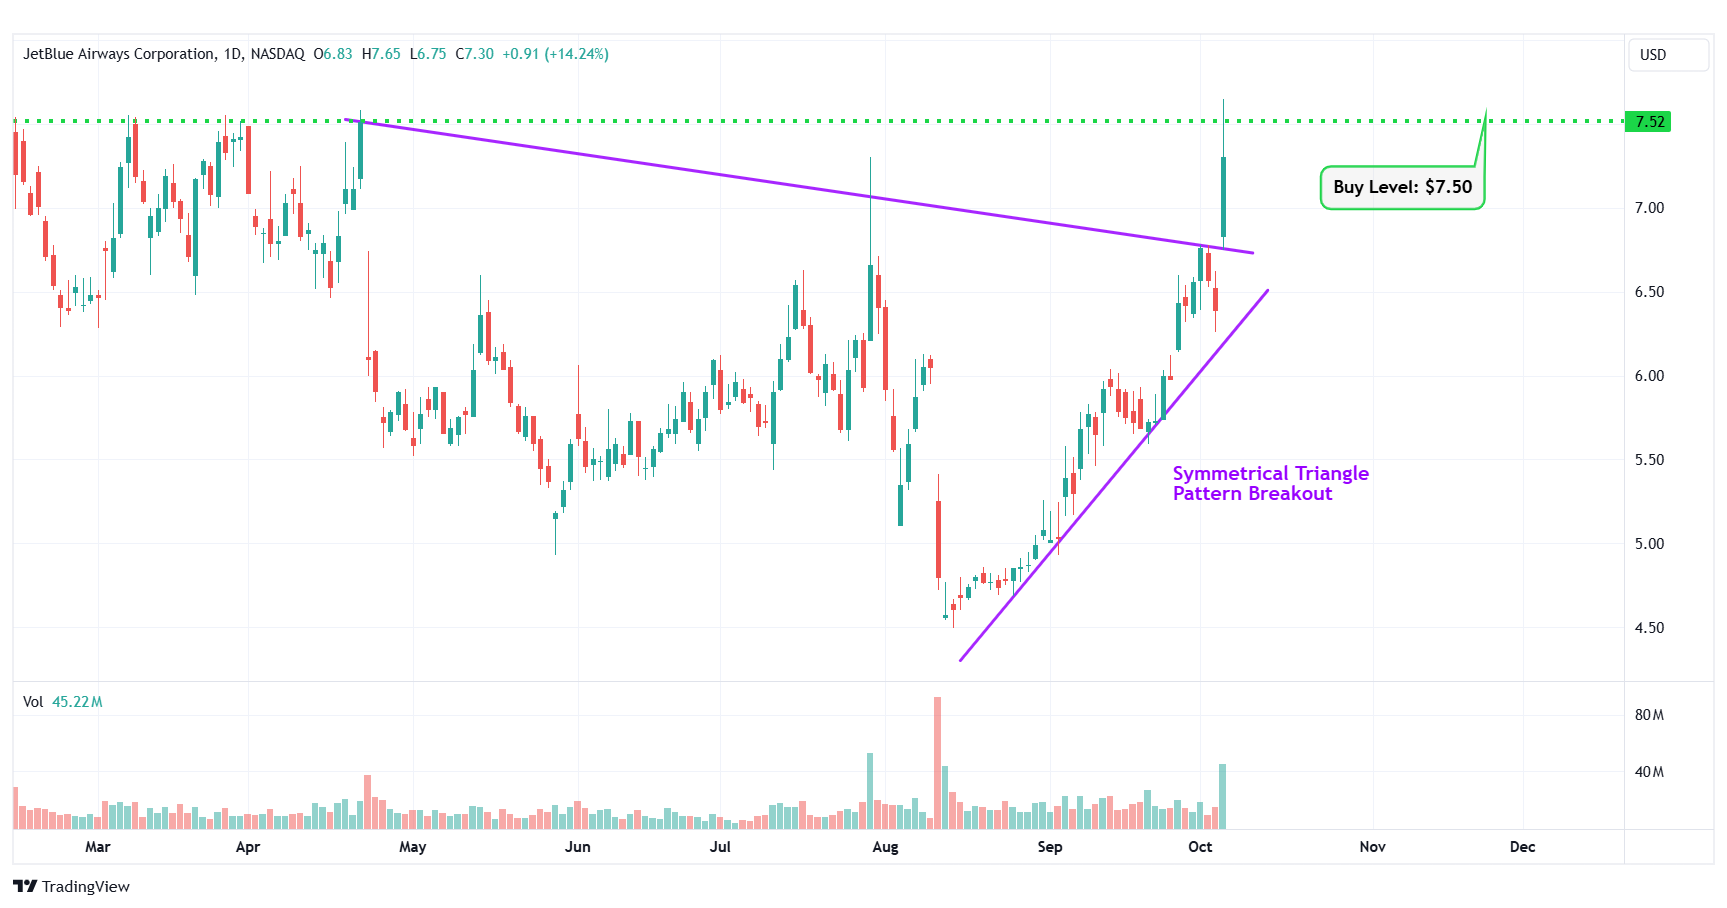
JBLU – Symmetrical Triangle Pattern Breakout
#3 Piedmont Lithium Inc. (NASDAQ: PLL)
Sector: Basic Materials • Other Industrial Metals & Mining
Reason: Falling Wedge Pattern Breakout
A falling wedge pattern is formed by joining two downward-sloping, converging trendlines having a contracting range. The pattern appears to be wide at the top and continues to contract as prices fall. A breakout from a falling wedge pattern can indicate either reversal or continuation depending on where the pattern appeared in the trend.
A stock that has broken out of a falling wedge pattern would have gained momentum and would have the potential to move higher.
Buy Level(s): The stock has currently broken out of a falling wedge pattern. However, the ideal buy level for PLL is above the nearest resistance level of $13.00. This is marked in the chart below as a green color dotted line.
Daily chart – PLL
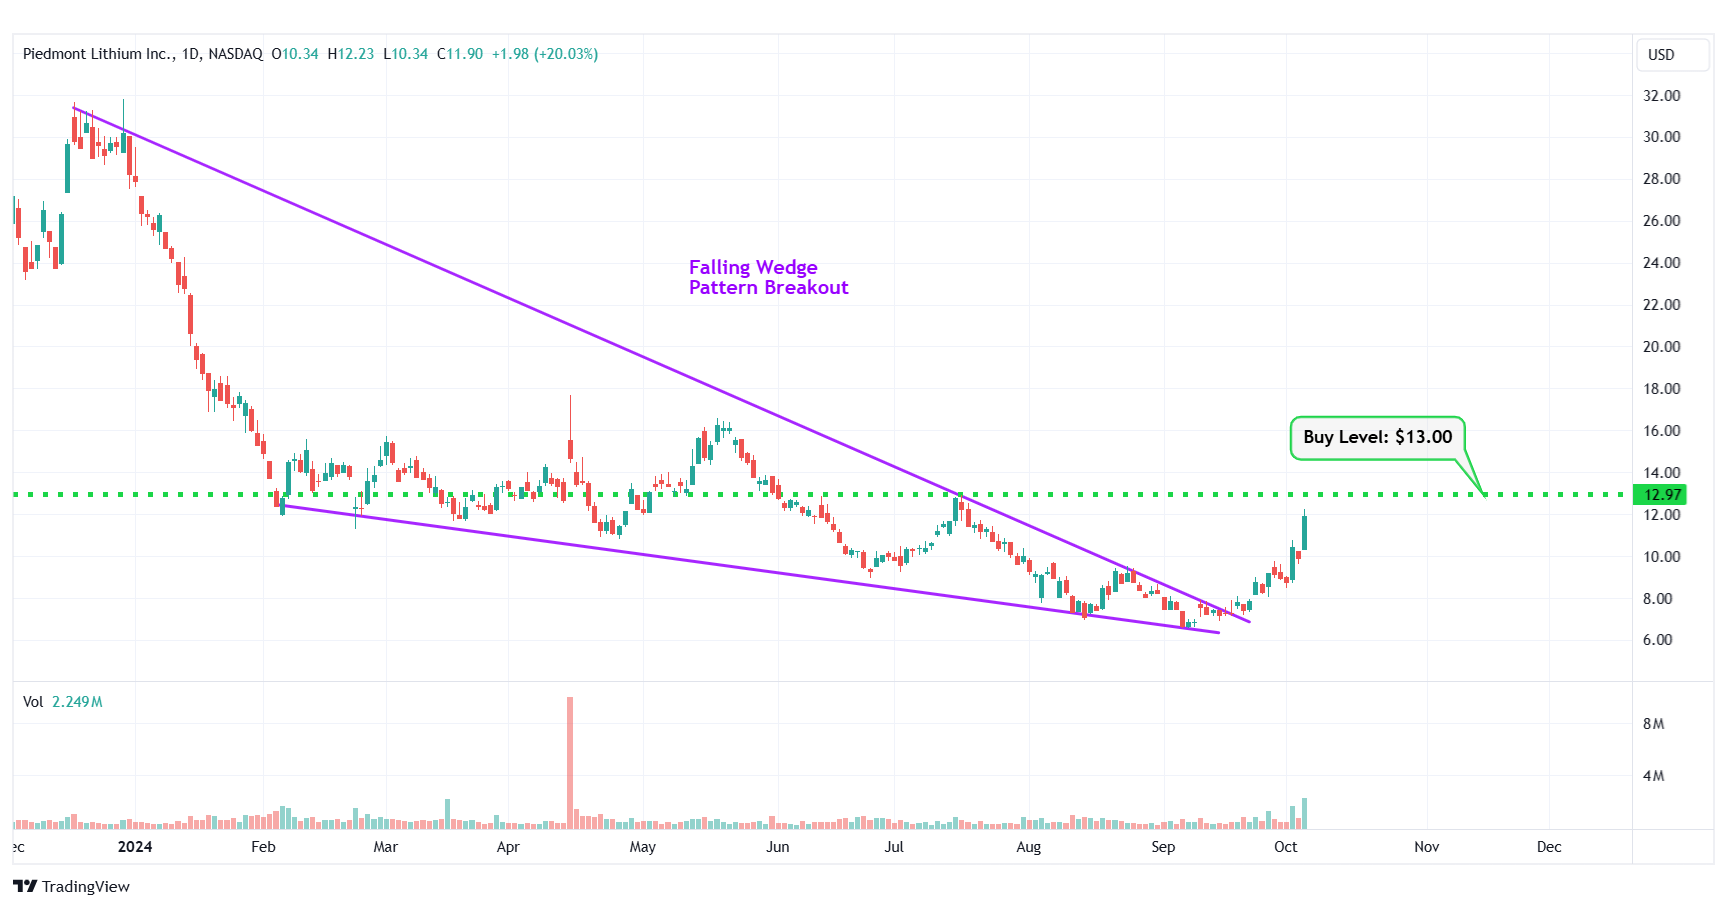
PLL – Falling Wedge Pattern Breakout
#4 Occidental Petroleum Corp ( NYSE: OXY)
Sector: Energy • Oil & Gas E&P
Reason: Formation of a Downtrend Channel
A downtrend or descending channel is the price action contained between downward sloping parallel lines. It is formed by two lines that are drawn by connecting the lower highs and lower lows of a stock’s price. Even though this is typically a bearish pattern, a breakout from the upper rail of this pattern is considered a good bullish indication.
Buy Level(s): The daily chart shows that the stock is currently forming a downtrend channel. The ideal buy level for OXY is if the stock breaks out of the downtrend channel and has a daily close above $57.30. This is marked in the chart below as a green color dotted line.
Daily chart – OXY
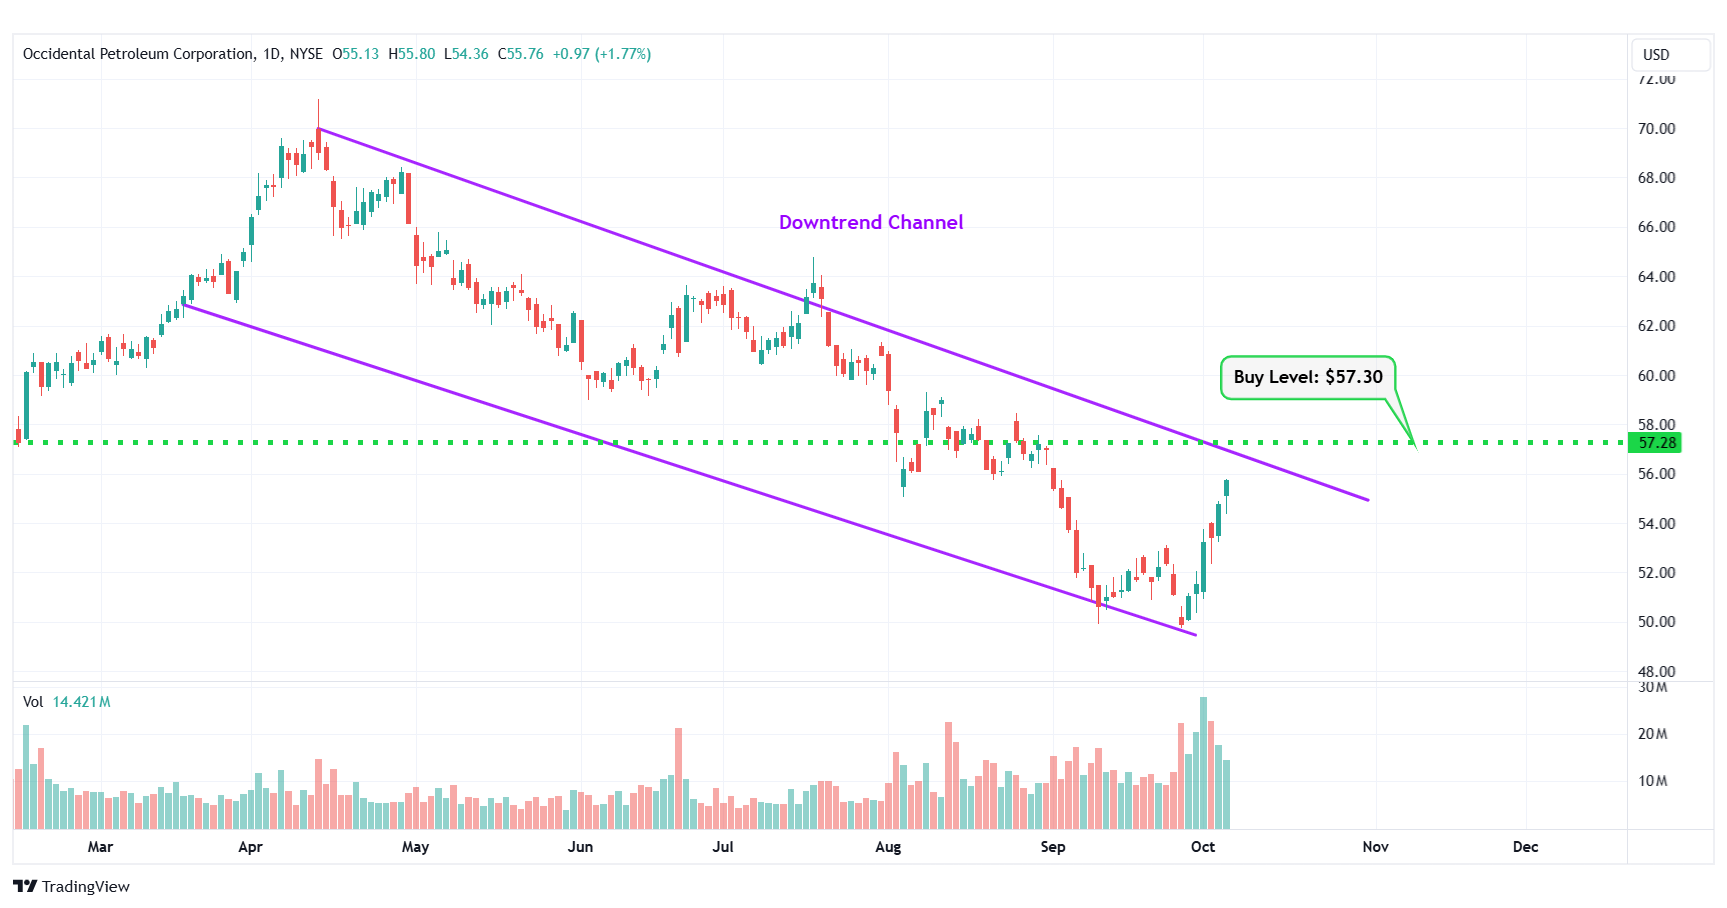
OXY – Downtrend Channel
#5 Barnes Group Inc. (NYSE: B)
Sector: Industrials • Specialty Industrial Machinery
Reason: Breakout From a Flag Pattern
A flag pattern is a short-term continuation pattern that marks a small consolidation before the previous move resumes. The pattern is formed when the market consolidates in a narrow range after a sharp move. For a stock in an uptrend, a breakout from this pattern is typically a strong bullish indication.
Buy Level(s): Although the stock has currently broken out of the flag pattern, the ideal buy level for B is above the near-term resistance level of $46.20. This is marked in the chart below as a green color dotted line.
Daily chart – B
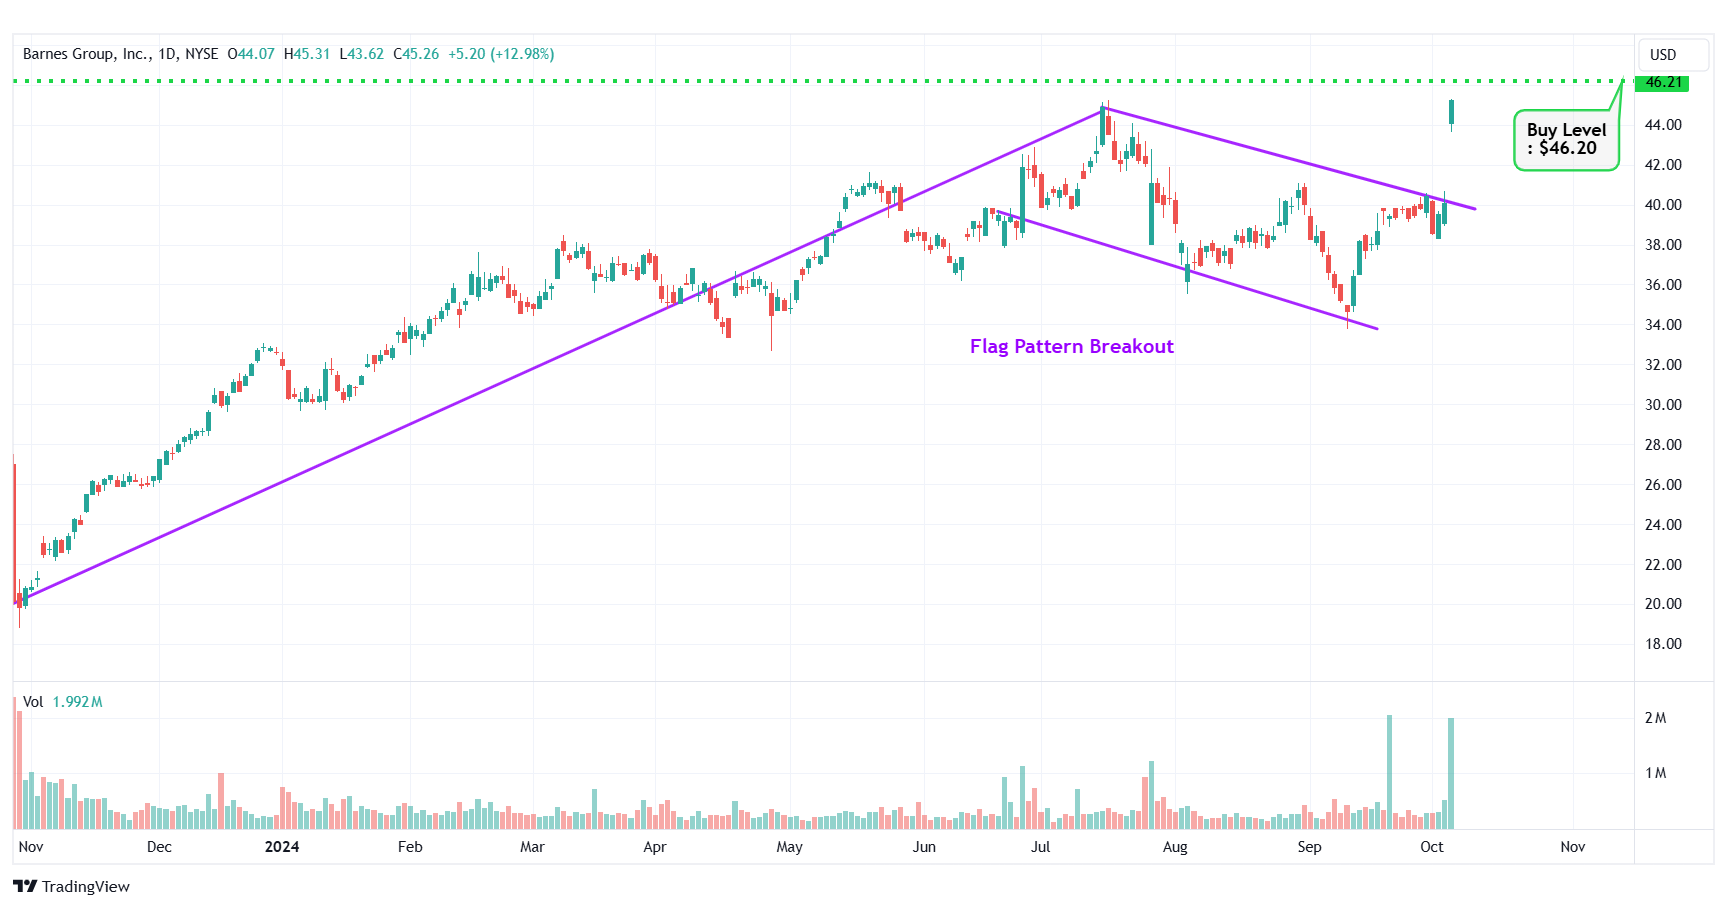
B – Flag Pattern Breakout
#6 Albemarle Corp. (NYSE: ALB)
Sector: Basic Materials • Specialty Chemicals
Reason: Symmetrical Triangle Pattern Breakout
A symmetrical triangle is a chart pattern formed by two converging trend lines connecting a series of sequential peaks and troughs. These two lines result in the formation of a triangle that appears to be symmetrical.
A symmetrical triangle pattern is usually formed when there is indecision in the price movements and there is uncertainty among the buyers and sellers. This chart pattern represents a period of consolidation before the price breaks out or breaks down. In case a breakout occurs from the upper trend line, it is a strong bullish indication as it signifies the start of a new bullish trend.
Buy Level(s): The stock has currently broken out of a symmetrical triangle pattern. However, the ideal buy level for ALB is if the stock closes above the immediate resistance level of $108.80. This is marked in the chart below as a green color dotted line.
Daily chart – ALB
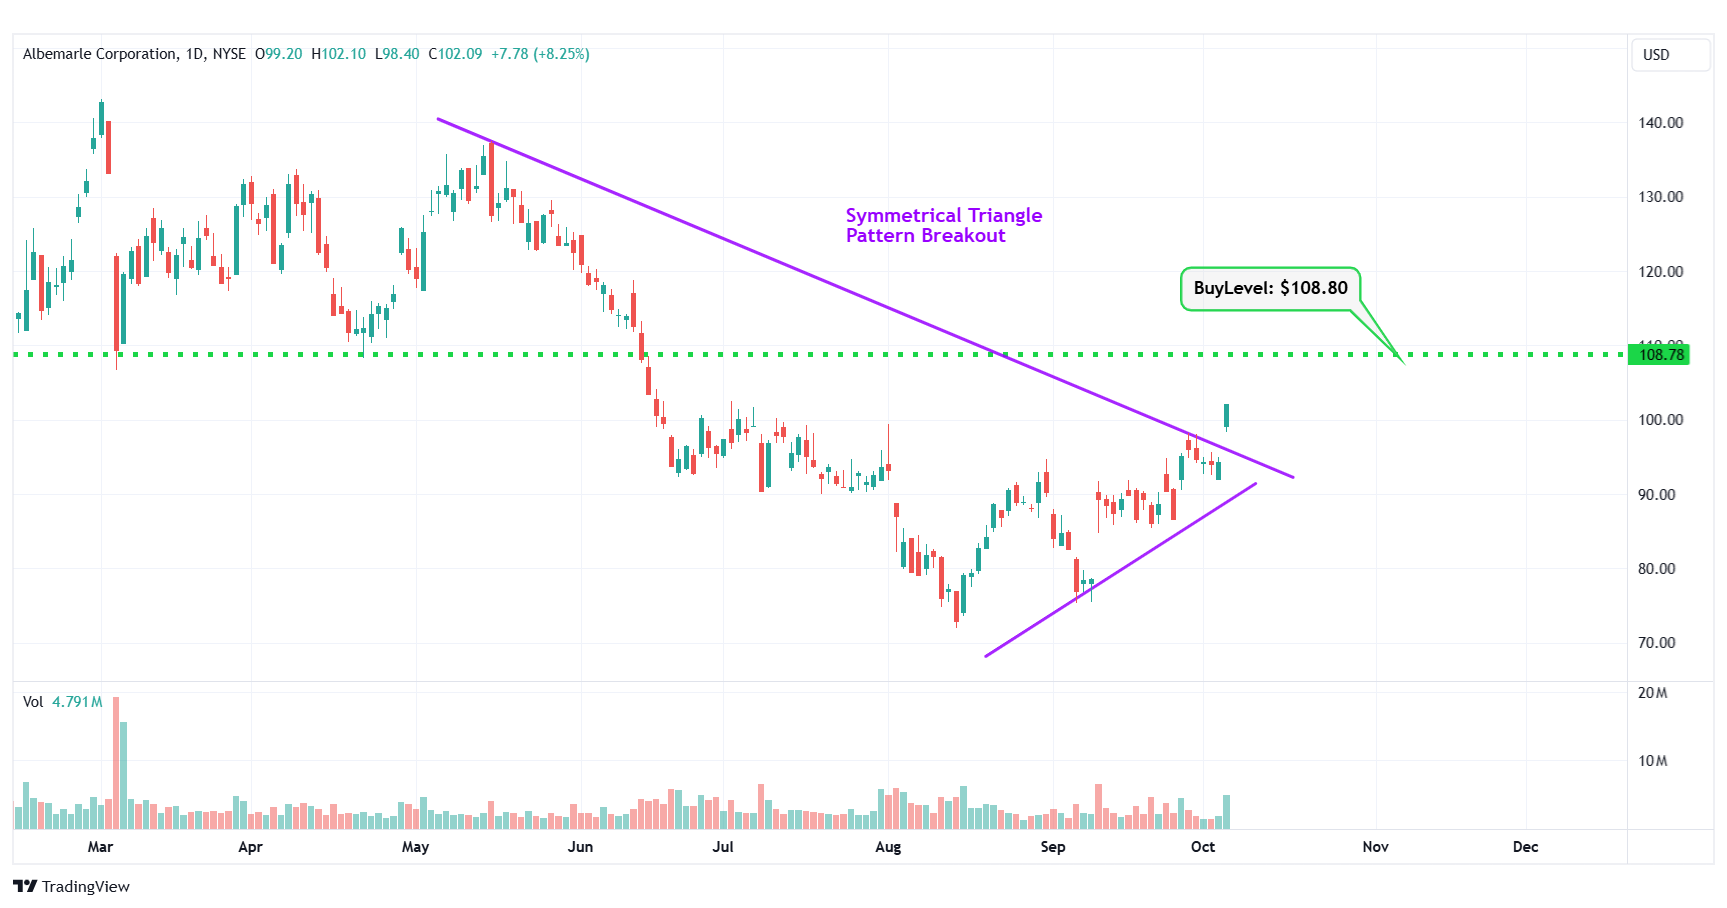
ALB – Symmetrical Triangle Pattern Breakout
#7 Devon Energy Corp. (NYSE: DVN)
Sector: Energy • Oil & Gas E&P
Reason: Formation of a Downtrend Channel
A downtrend or descending channel is the price action contained between downward sloping parallel lines. It is formed by two lines that are drawn by connecting the lower highs and lower lows of a stock’s price. Even though this is typically a bearish pattern, a breakout from the upper rail of this pattern is considered a good bullish indication.
Buy Level(s): The daily chart shows that the stock is currently forming a downtrend channel. The ideal buy level for DVN is if the stock breaks out of the downtrend channel and has a daily close above $43.90. This is marked in the chart below as a green color dotted line.
Daily chart – DVN
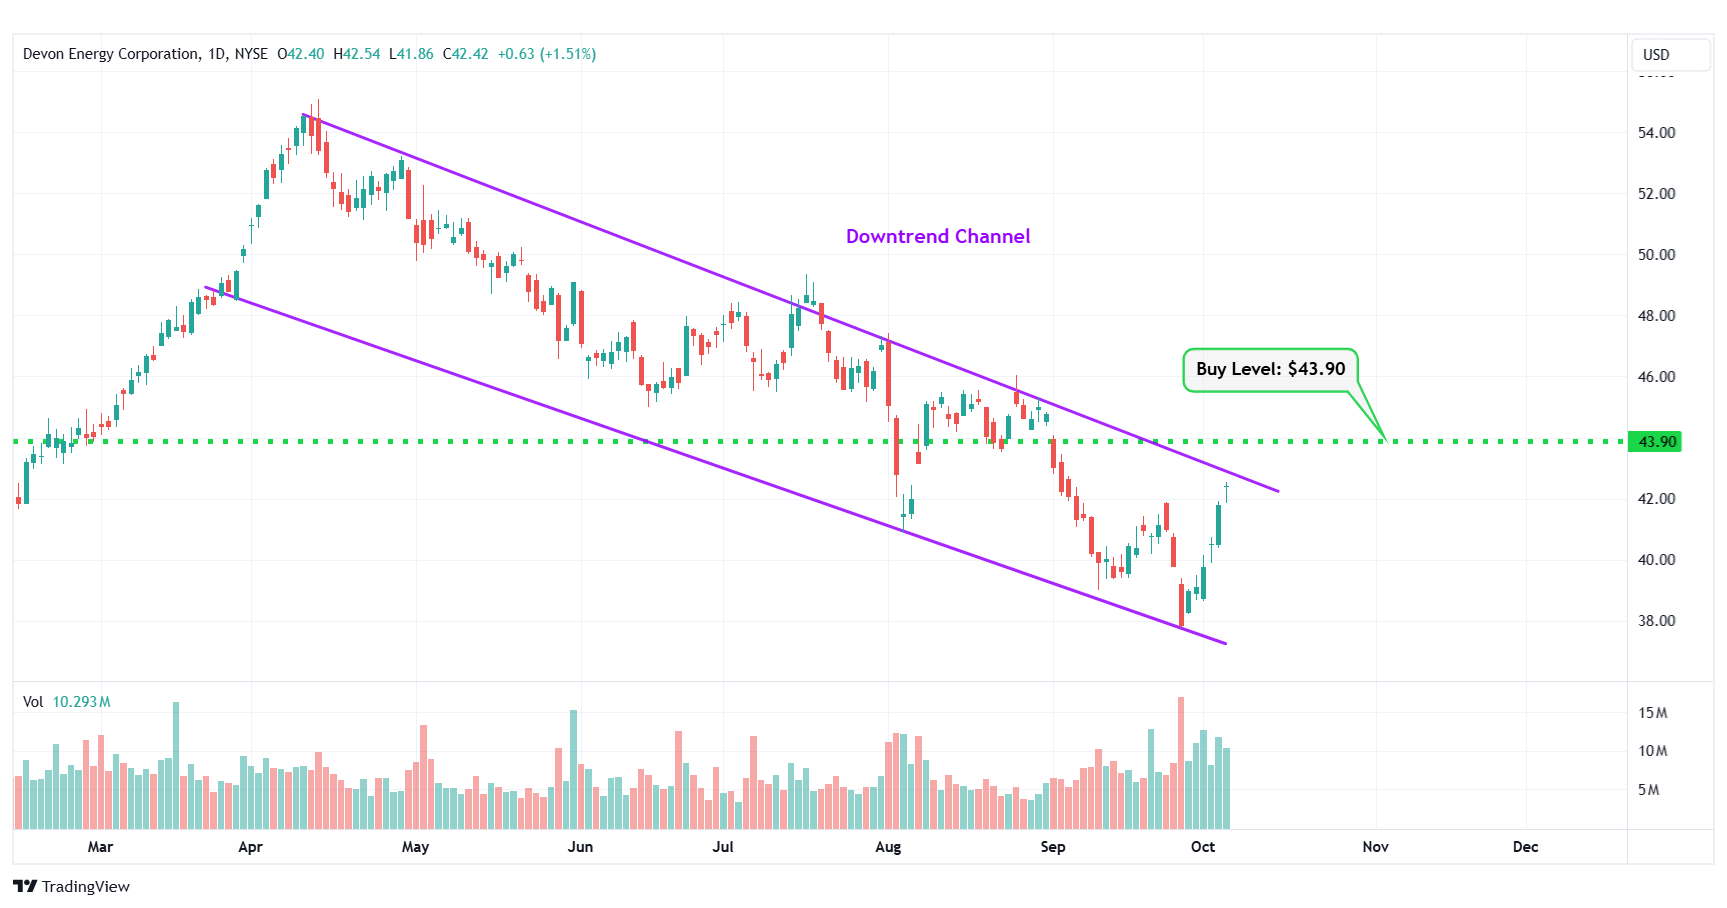
DVN – Downtrend Channel
#8 Exxon Mobil Corp. (NYSE: XOM)
Sector: Energy • Oil & Gas Integrated
Reason: Symmetrical Triangle Pattern Breakout
A symmetrical triangle is a chart pattern formed by two converging trend lines connecting a series of sequential peaks and troughs. These two lines result in the formation of a triangle that appears to be symmetrical.
A symmetrical triangle pattern is usually formed when there is indecision in the price movements and there is uncertainty among the buyers and sellers. This chart pattern represents a period of consolidation before the price breaks out or breaks down. In case a breakout occurs from the upper trend line, it is a strong bullish indication as it signifies the start of a new bullish trend.
Buy Level(s): The stock has currently broken out of a symmetrical triangle pattern. However, the ideal buy level for XOM is if the stock closes above the immediate resistance level of $125.30. This is marked in the chart below as a green color dotted line.
Daily chart – XOM
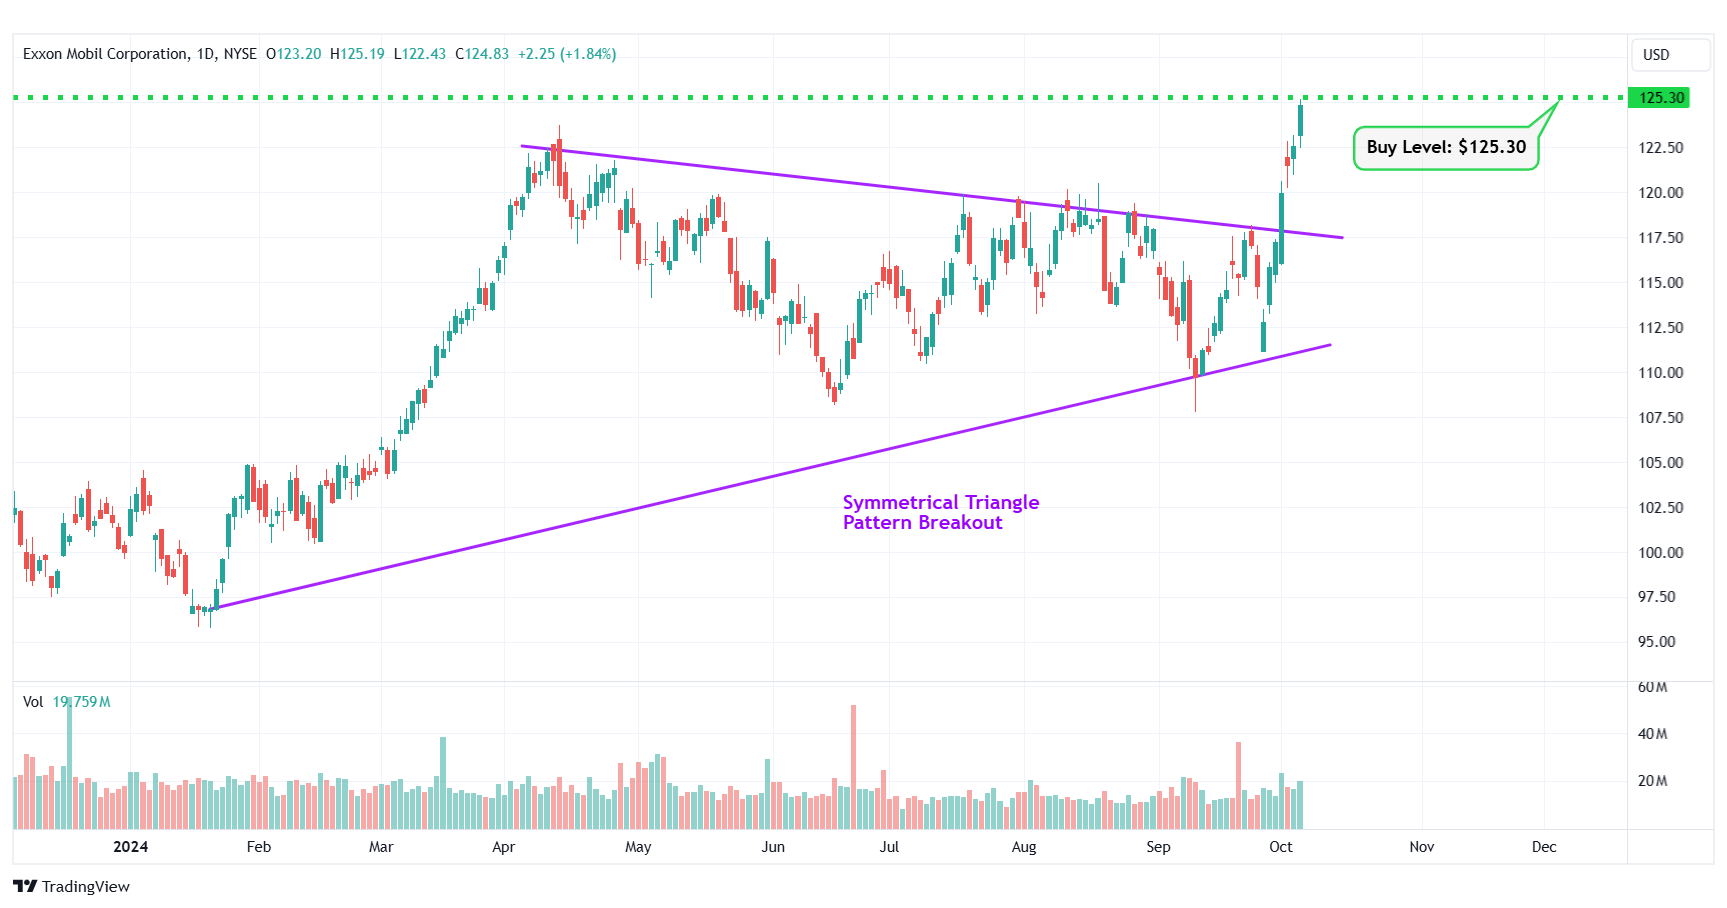
XOM – Symmetrical Triangle Pattern Breakout
#9 Conoco Phillips (NYSE: COP)
Sector: Energy • Oil & Gas E&P
Reason: Downtrend Channel Breakout
A downtrend or descending channel is the price action contained between downward sloping parallel lines. It is formed by two lines that are drawn by connecting the lower highs and lower lows of a stock’s price. Even though this is typically a bearish pattern, a breakout from the upper rail of this pattern is considered a good bullish indication.
Buy Level(s): The daily chart shows that the stock has currently broken out of a downtrend channel. However, there is a near-term resistance level for the stock. Hence, the ideal buy level for COP is if the stock has a daily close above $115.20. This is marked in the chart below as a green color dotted line.
Daily chart – COP
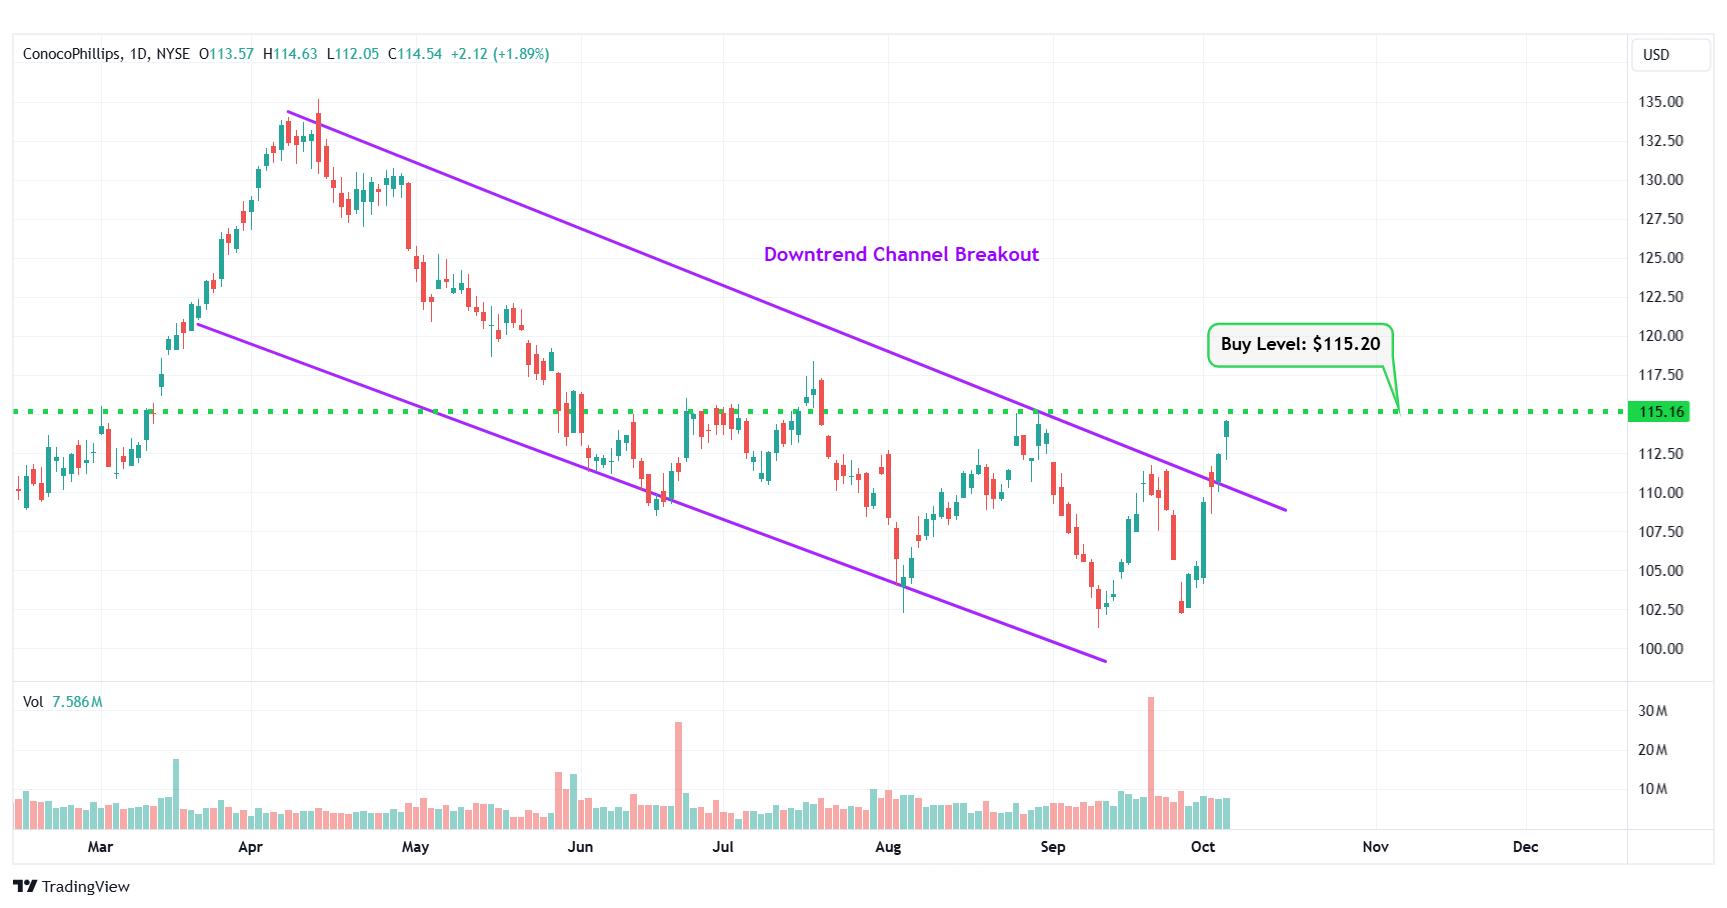
COP – Downtrend Channel Breakout
#10 MoonLake Immunotherapeutics (NASDAQ: MLTX)
Sector: Healthcare • Biotechnology
Reason: Formation of a Symmetrical Triangle Pattern
A symmetrical triangle is a chart pattern formed by two converging trend lines connecting a series of sequential peaks and troughs. These two lines result in the formation of a triangle that appears to be symmetrical.
A symmetrical triangle pattern is usually formed when there is indecision in the price movements and there is uncertainty among the buyers and sellers. This chart pattern represents a period of consolidation before the price breaks out or breaks down. In case a breakout occurs from the upper trend line, it is a strong bullish indication as it signifies the start of a new bullish trend.
Buy Level(s): The ideal buy level for MLTX is if the stock has a daily close above the breakout level of the symmetrical triangle pattern, at around $56.10. This is marked in the chart below as a green color dotted line.
Daily chart – MLTX
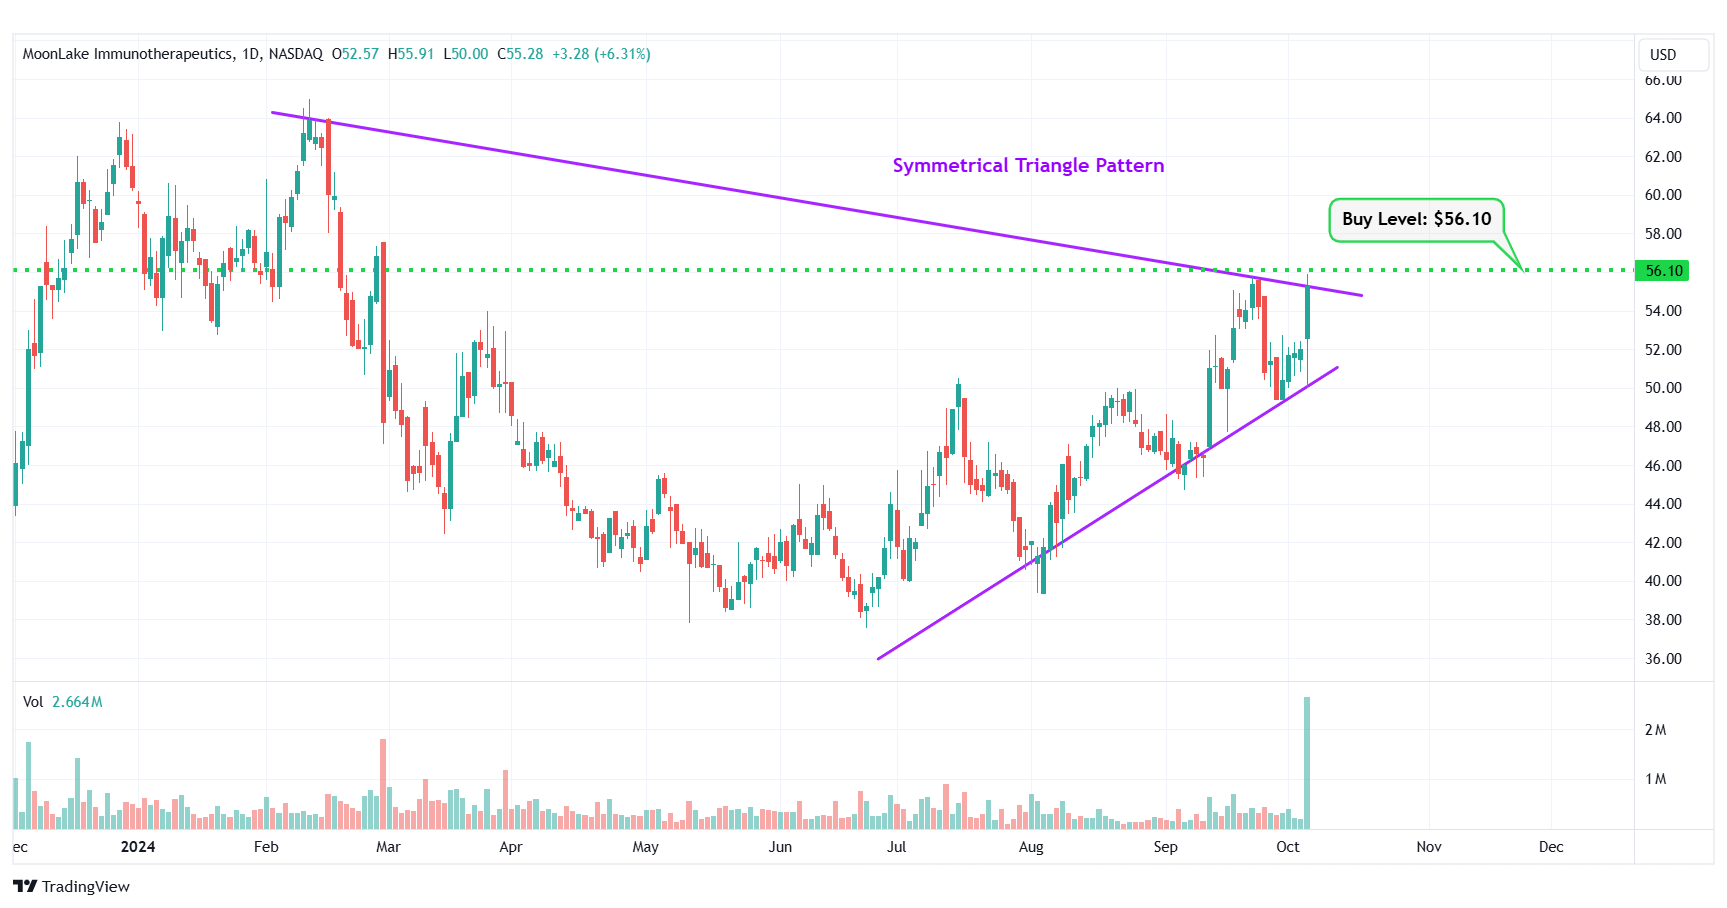
MLTX – Symmetrical Triangle Pattern
Happy Trading!
Trades of The Day Research Team
Karim Rahemtulla, the trader behind a 400% gain in 24-months on Rolls-Royce, has uncovered another potential multi-bagger. This under-$20 stock gives you exposure to over 1-oz of gold with the lowest production costs in the industry. And an upcoming announcement could send this stock soaring. Get Karim's urgent briefing - click here now.
Source: Trades of the Day

