We recently started a series called “Penny Stock of the Day”. These ideas are geared towards traders with an extremely high risk appetite.
Our Penny Stock of the Day is chosen by screening for stocks under $5 and then applying technical analysis on the shortlisted set of penny stocks showing unusual volume. When making these trades, please make sure to pay vigilant attention to pricing moves and have a strict stop loss in place to avoid significant losses.
Penny Stock of the Day: D-Wave Quantum Inc. (NYSE: QBTS)
Today’s penny stock pick is the technology company, D-Wave Quantum Inc. (NYSE: QBTS).
D-Wave Quantum Inc. develops and delivers quantum computing systems, software, and services worldwide. The company offers Advantage, a quantum computer; Ocean, a suite of open-source python tools; and Leap, a cloud-based service that provides real-time access to a live quantum computer, as well as access to Advantage, hybrid solvers, the Ocean software development kit, live code, demos, learning resources, and a developer community. It provides D-Wave Launch, a quantum professional service that guides enterprises from problem discovery through production implementation. The company’s quantum solutions are used in scheduling, mobility, logistics, drug discovery, portfolio optimization, manufacturing processes, and other.
Website: https://www.dwavesys.com
Latest 10-k report: https://d18rn0p25nwr6d.cloudfront.net/CIK-0001907982/eb4559fa-d0e8-4374-8651-901c2dbd7e29.pdf
Analyst Consensus: As per TipRanks Analytics, based on 4 Wall Street analysts offering 12-month price targets for QBTS in the last 3 months, the stock has an average price target of $3.17, which is nearly 196% upside from current levels.
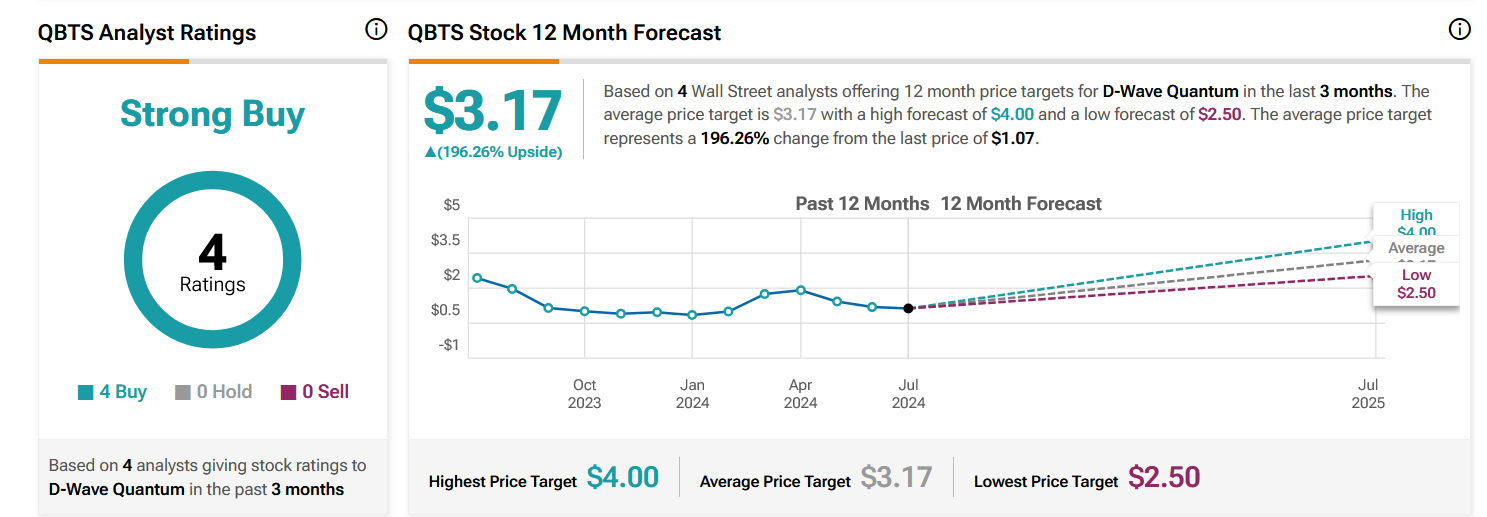
Analysts | Source: TipRanks.com
Potential Catalysts / Reasons for the Hype:
- The company announced a significant expansion of its Leap quantum cloud service, targeting advancements in artificial intelligence (AI) and machine learning (ML). The newly revealed roadmap outlines strategic initiatives aimed at integrating quantum computing with AI/ML technologies to offer more efficient and powerful computational capabilities.
- QBTS and NTT DOCOMO Inc., Japan’s largest mobile phone operator, announced that the quantum optimization pilot resulted in mobile network performance improvements by 15%.
On analyzing the company’s stock charts, there seem to be multiple bullish indications…
Bullish Indications
#1 Symmetrical Triangle Pattern Breakout: The daily chart shows that the stock has currently broken out a symmetrical triangle pattern, which is marked as purple color lines. A symmetrical triangle pattern represents a period of consolidation before the price breaks out. This is typically formed when there is indecision in the price movements and uncertainty among the buyers and sellers. Once a breakout from the upper trend line occurs, it usually signifies the start of a new bullish trend.
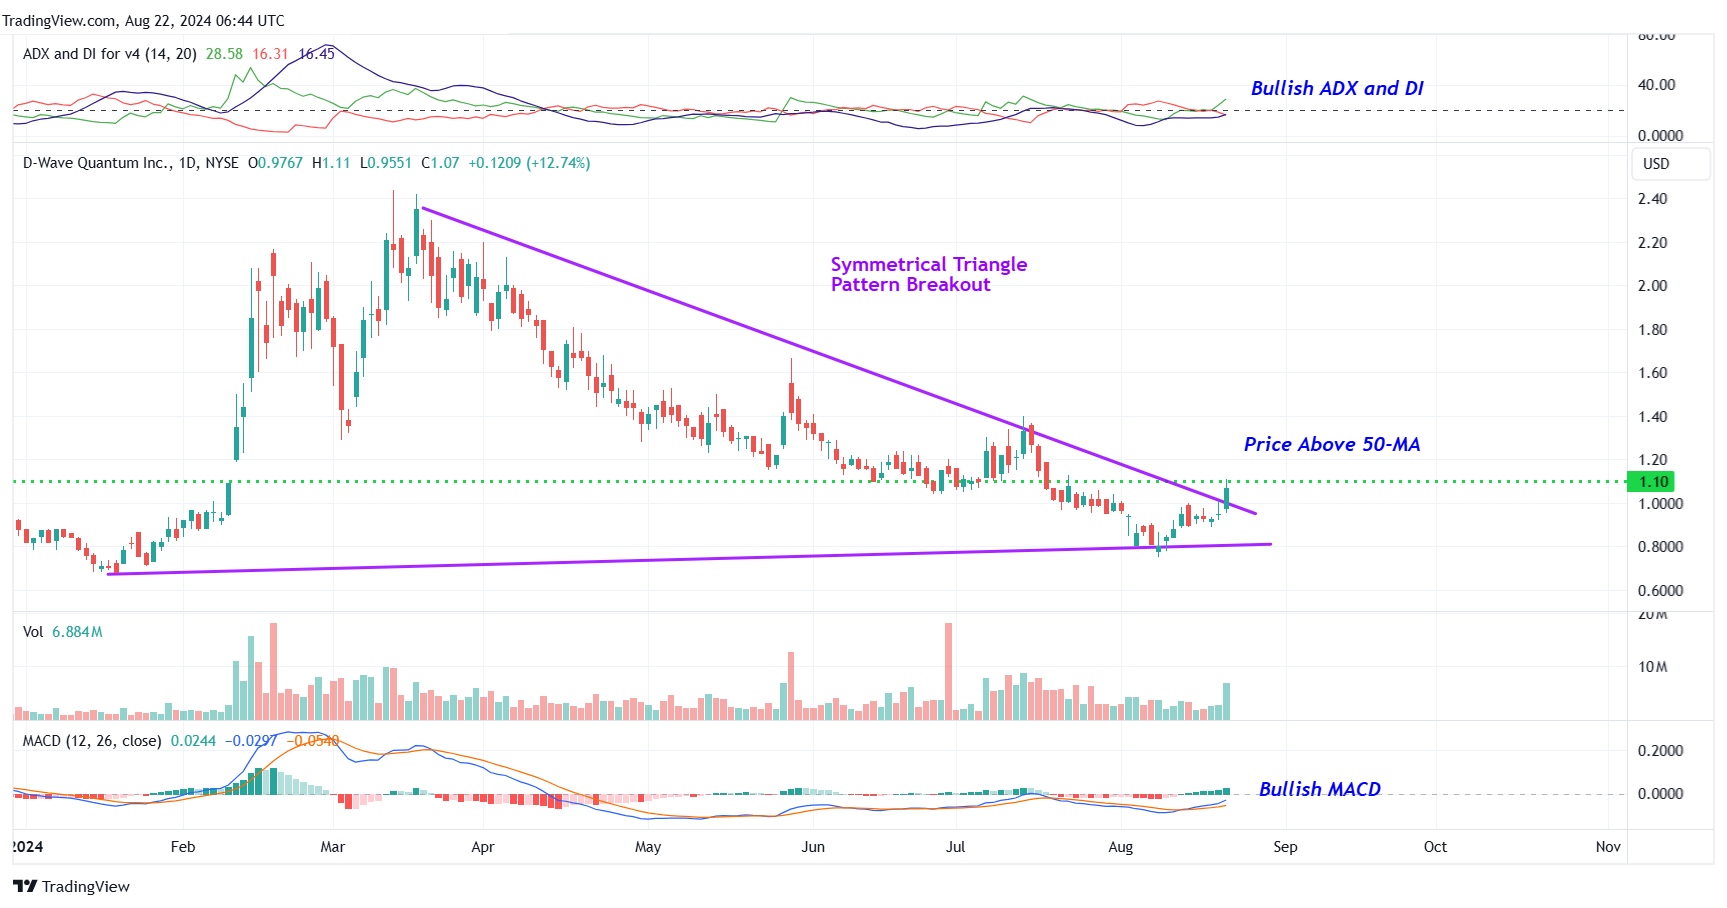
QBTS – Daily Chart
#2 Bullish ADX and DI: The ADX indicator shows bullishness as the +DI line is above the -DI line, and the ADX line is currently moving higher from below the +DI and -DI lines.
#3 Price above MA: The stock is currently above its 50-day SMA, indicating that the bulls have currently gained control.
#4 MACD above Signal Line: In the daily chart, the MACD (light blue color) is currently above the MACD signal line (orange color). This indicates a possible bullish setup.
#5 Above Support Area: The weekly chart shows that the stock is currently trading above a support area, which is marked as a pink color dotted line. This looks like a good area for the stock to move higher.
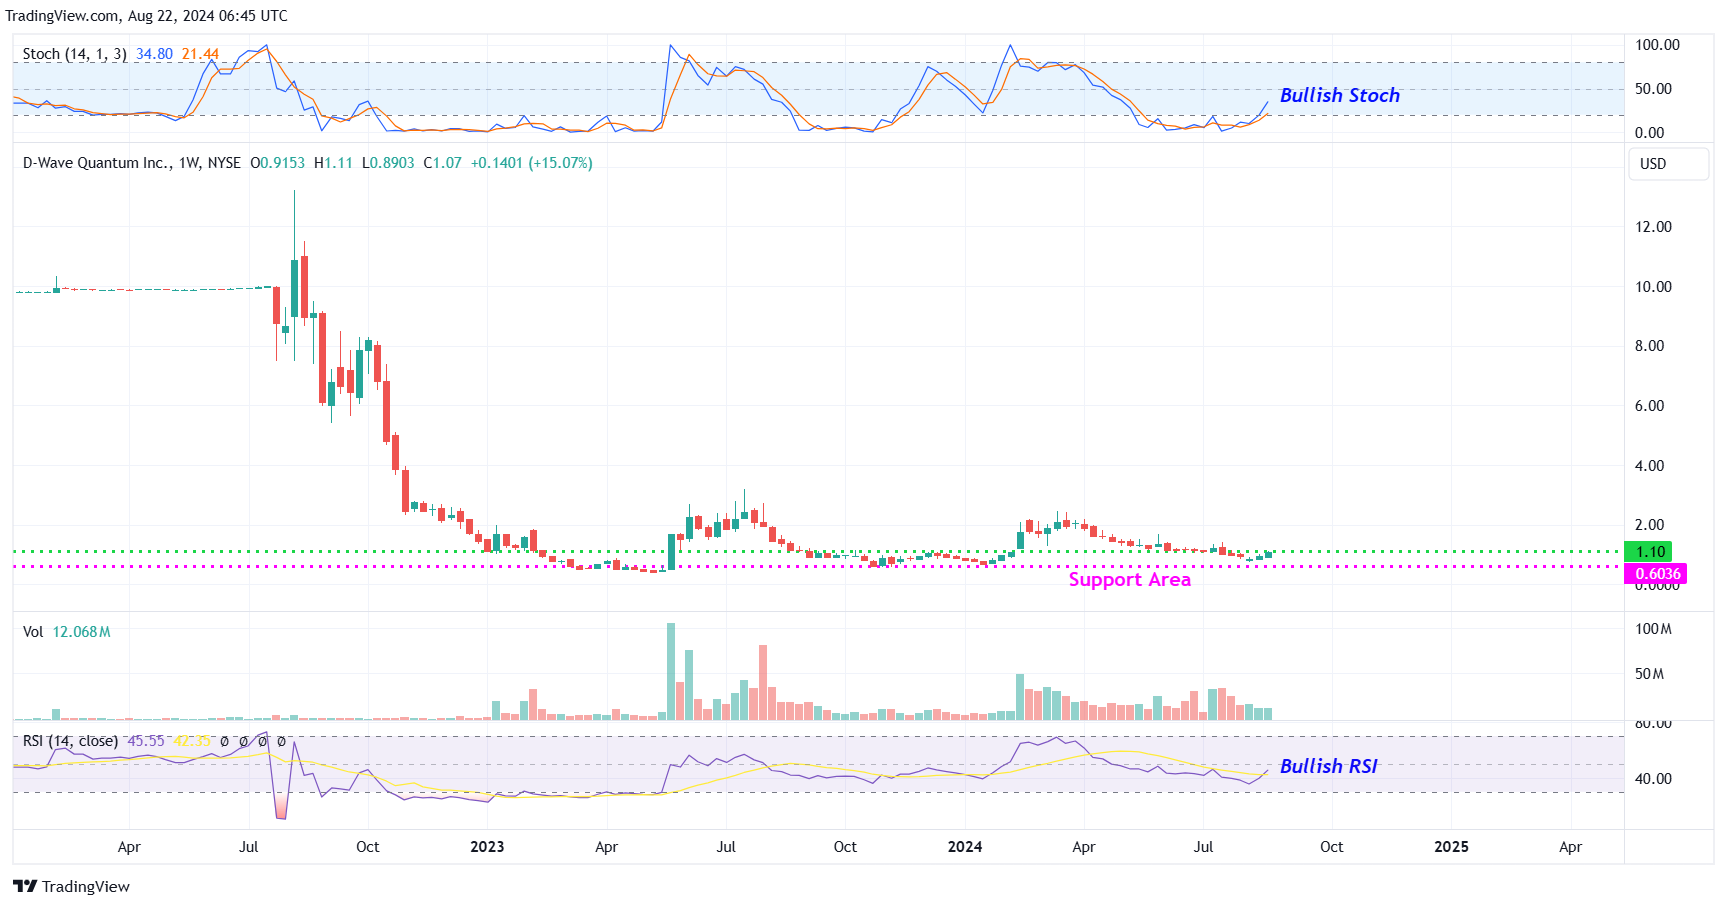
QBTS – Weekly Chart
#6 Bullish Stoch: The %K line is above the %D line of the stochastic in the weekly chart and is also moving higher from oversold levels, indicating possible bullishness.
Recommended Trade (based on the charts)
Buy Levels: If you want to get in on this trade, the ideal buy level for QBTS is above the price of $1.10.
Target Prices: Our first target is $1.80. If it closes above that level, the second target price is $2.30.
Stop Loss: To limit risk, place a stop loss at $0.70. Note that the stop loss is on a closing basis.
Our target potential upside is 63% to 109%.
For a risk of $0.40, our first target reward is $0.70, and the second target reward is $1.20. This is a nearly 1:2 and 1:3 risk-reward trade.
In other words, this trade offers 2x to 3x more potential upside than downside.
Potential Risks / Red Flags:
- The company has a history of net losses. During the year ended December 31, 2023, and 2022, QBTS incurred net losses of $82.8 million and $53.7 million, respectively.
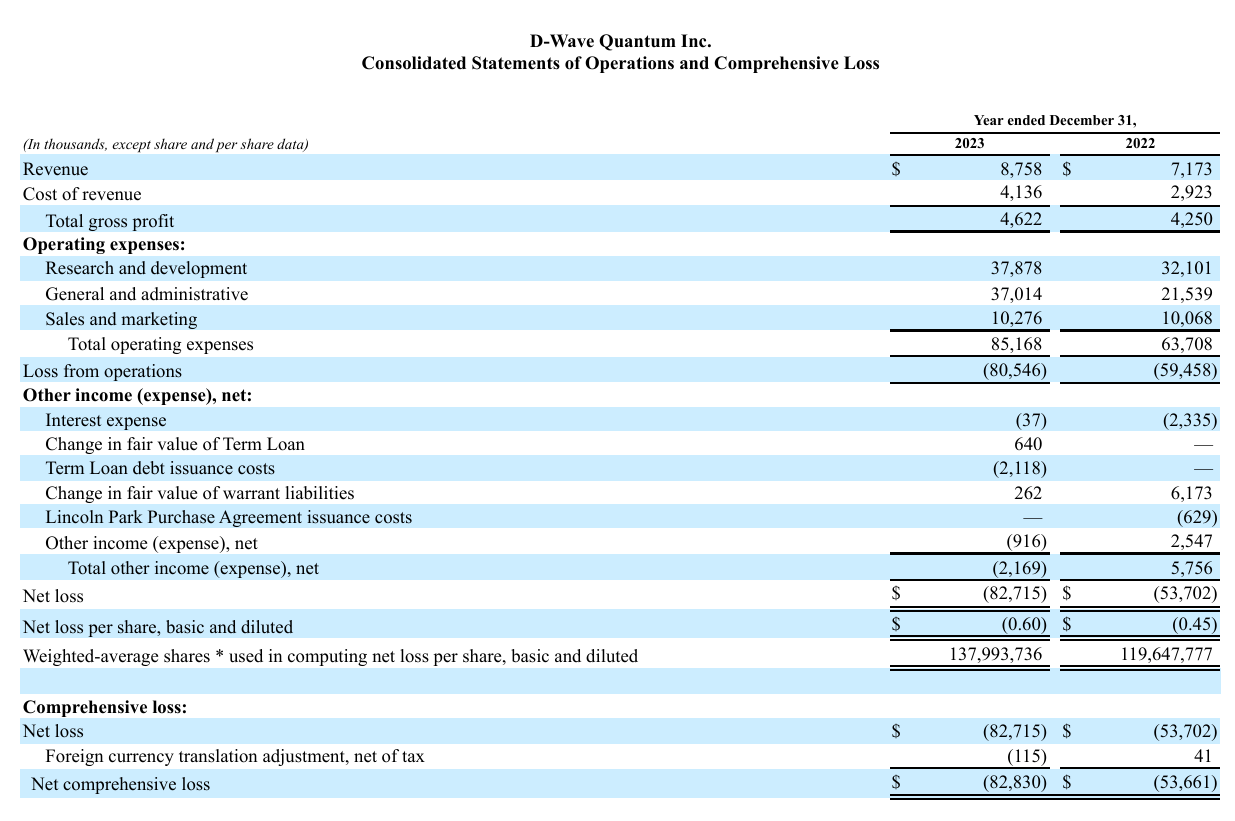
QBTS – Consolidated Statements of Operations
- On October 20, 2023, QBTS was notified by the NYSE that it was not in compliance with Section 802.01C of the NYSE Listed Company Manual because the average closing price of its Common Shares was less than $1.00 over a consecutive 30 trading-day period. If the company is unable to remain in compliance with the NYSE listing requirements, its Common Shares could be delisted from the NYSE.
- Corporate Insiders placed Informative Sells of Shares Worth $144.8K in the Last 3 Months.
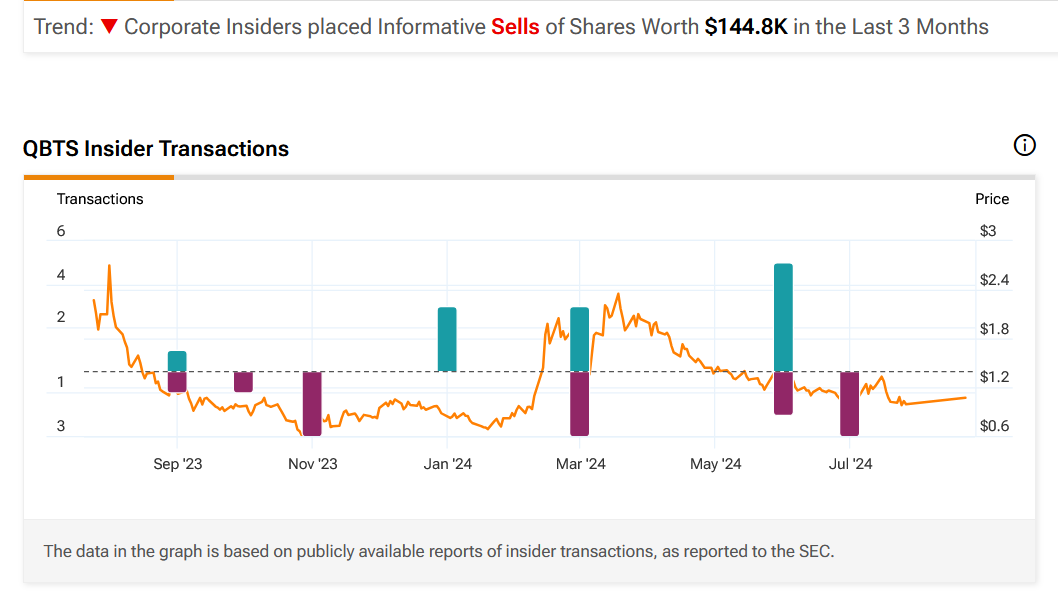
Insiders | Source: TipRanks.com
- Hedge Funds Decreased Holdings by 4.3M Shares Last Quarter.
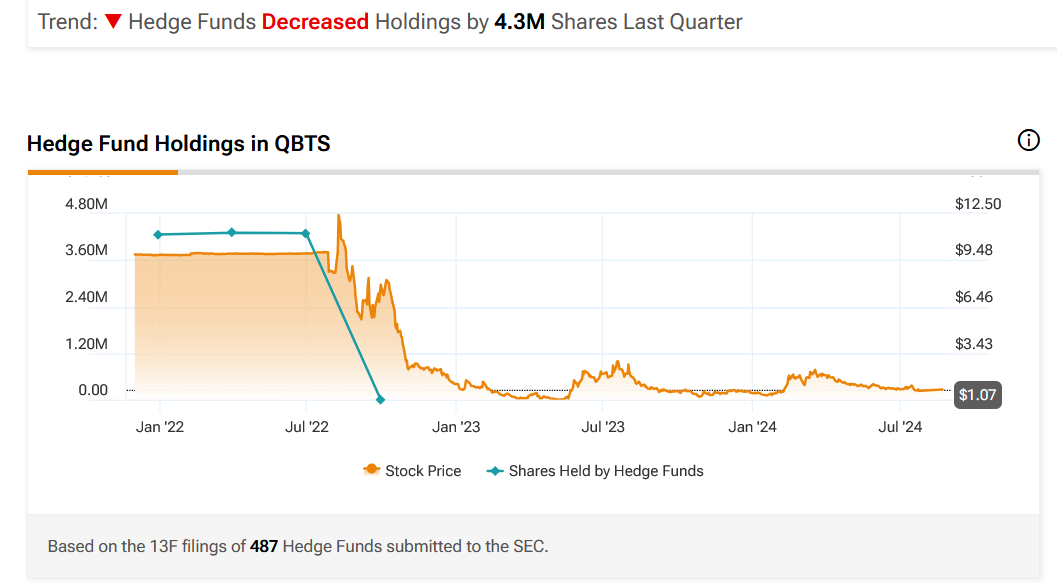
Hedge Funds | Source: TipRanks.com
- Despite being a loss-making company, the executives are being paid significant compensation.
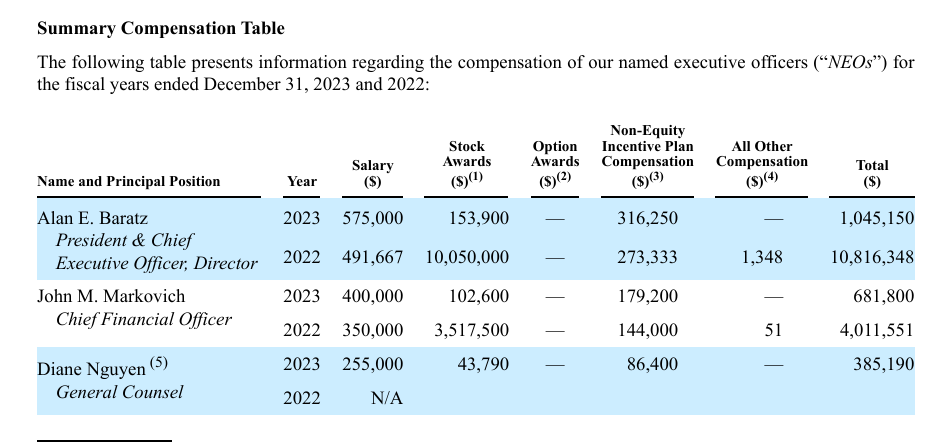
QBTS – Executive Compensation
As you can see, today’s featured penny stock offers big upside potential… but it also comes with a number of risks and red flags. As always, when dealing with penny stocks, we advise caution before entering into such high-risk ventures. Remember to think before you trade… understand the risks… and if you decide to trade, stick to your stop-losses!
Happy Trading!
Trades of the Day Research Team
READ BEFORE TRADING PENNY STOCKS: The allure of penny stocks lies in their potential to deliver massive gains in a short period of time. However, in exchange for that opportunity, most penny stocks carry tremendous risk. They can be extremely volatile and are susceptible to “pump and dump” schemes and fraud.
Unlike regular stocks, the financial condition of most penny stock companies can be extremely difficult to analyze, as the majority of such stocks are traded on over-the-counter (OTC) exchanges, which are typically less transparent and less regulated than the major exchanges. In fact, in the penny stock space, it’s often easier to spot warning signs and red flags than it is to identify a sound investment. Nevertheless, we do our best to identify short-term trade opportunities in this exciting space because we know some of our readers are looking for high-risk, high-reward ideas. We just urge you to make sure you fully understand the risks before making any of these trades.
Everyone wants to know when to buy, sell, or hold a stock. FAST Graphs reveals this by clearly illustrating the value of the business relative to its stock price. Get 25% off using Daily Trade Alert's special referral link and coupon code AFFILIATE25
Source: Trades of the Day

