Picking a winning trade on a consistent basis is not simply a stroke of luck. It’s the result of calculated screening, planning, and deliberation.
With this in mind, we have started a new weekly series on our top 10 stocks to watch this week — stocks that look poised for a possible breakout in the coming days. Traders should add these stocks to their watchlist now.
The Top 10 Stocks to Watch This Week for Possible Breakouts
| Sl # | Name of the Stock | Stock Ticker | Last Close | Buy Level(s) | Reason |
| 1 | QuantumScape Corp | NYSE: QS | $8.25 | $8.85 | Falling Wedge Pattern Breakout |
| 2 | Rivian Automotive Inc. | NASDAQ: RIVN | $18.11 | $18.90 | Downtrend Channel Breakout |
| 3 | Upstart Holdings Inc. | NASDAQ: UPST | $27.11 | $31.00 | Symmetrical Triangle Pattern Breakout |
| 4 | PNC Financial Services Group Inc. | NYSE: PNC | $168.56 | $169.40 | Breakout From Consolidation Area |
| 5 | Nano X Imaging Ltd | NASDAQ: NNOX | $8.91 | $9.30 | Downtrend Channel |
| 6 | ON Semiconductor Corp. | NASDAQ: ON | $76.87 | $77.50 | Symmetrical Triangle Pattern |
| 7 | Varonis Systems Inc. | NASDAQ: VRNS | $49.45 | $50.30 | Flag Pattern Breakout |
| 8 | SoundHound AI Inc. | NASDAQ: SOUN | $6.20 | $6.50 | Symmetrical Triangle Pattern Breakout |
| 9 | Mastercard Incorporated | NYSE: MA | $440.11 | $450.00 | Downtrend Channel |
| 10 | Redfin Corp | NASDAQ: RDFN | $7.57 | $8.00 | Symmetrical Triangle Pattern Breakout |
Important: Typically, these trades offer a risk: reward ratio of 1:2 or 1:3 in the next 6 months, which implies 2x to 3x rewards when compared to risks. So, be sure to set your stop-loss levels and target prices accordingly to manage your risk. In addition, these trade ideas are triggered using daily closing prices, not intra-day pricing. So, if you participate in these trades, make sure that you only buy the stock once its daily close is above the recommended price level.
That said, here are the top 10 stocks to watch for a breakout, in no particular order.
#1 QuantumScape Corp (NYSE: QS)
Sector: Consumer Cyclical • Auto Parts
Reason: Falling Wedge Pattern Breakout
A falling wedge pattern is formed by joining two downward-sloping, converging trendlines having a contracting range. The pattern appears to be wide at the top and continues to contract as prices fall. A breakout from a falling wedge pattern can indicate either reversal or continuation depending on where the pattern appeared in the trend.
A stock that has broken out of a falling wedge pattern would have gained momentum and would have the potential to move higher.
Buy Level(s): The stock has currently broken out of a falling wedge pattern. However, the ideal buy level for QS is above the nearest resistance level of $8.85. This is marked in the chart below as a green color dotted line.
Daily chart – QS
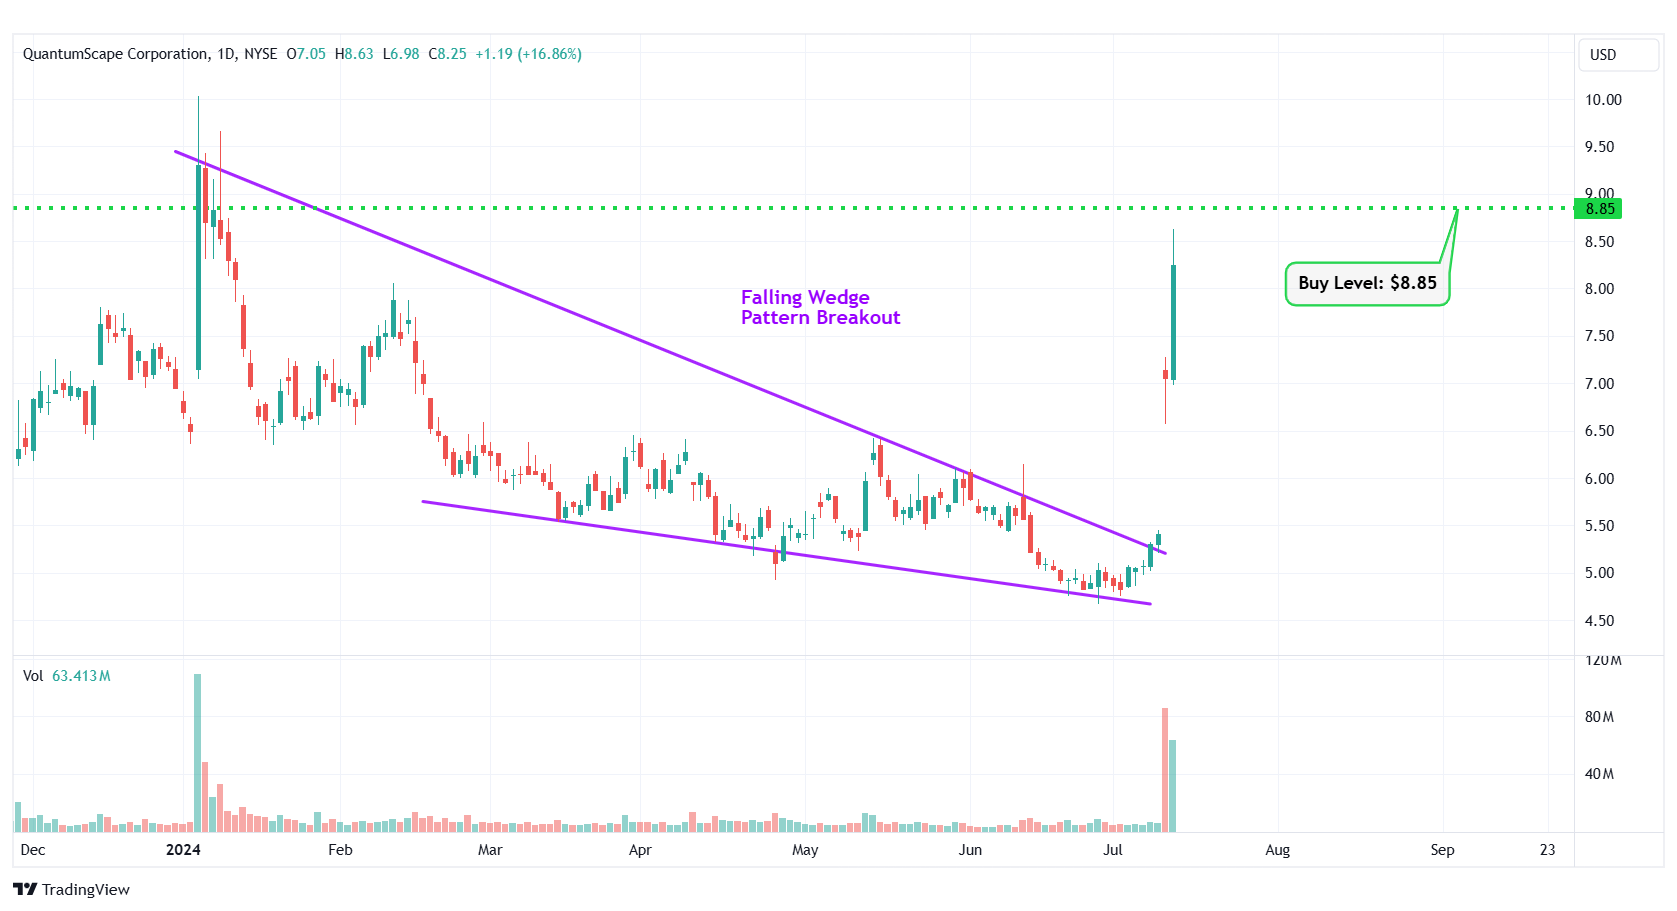
QS – Falling Wedge Pattern Breakout
#2 Rivian Automotive Inc. (NASDAQ: RIVN)
Sector: Consumer Cyclical • Auto Manufacturers
Reason: Downtrend Channel Breakout
A downtrend or descending channel is the price action contained between downward sloping parallel lines. It is formed by two lines that are drawn by connecting the lower highs and lower lows of a stock’s price. Even though this is typically a bearish pattern, a breakout from the upper rail of this pattern is considered a good bullish indication.
Buy Level(s): The daily chart shows that the stock has currently broken out of a downtrend channel. However, there is a near-term resistance level for the stock. Hence, the ideal buy level for RIVN is if the stock has a daily close above $18.90. This is marked in the chart below as a green color dotted line.
Daily chart – RIVN
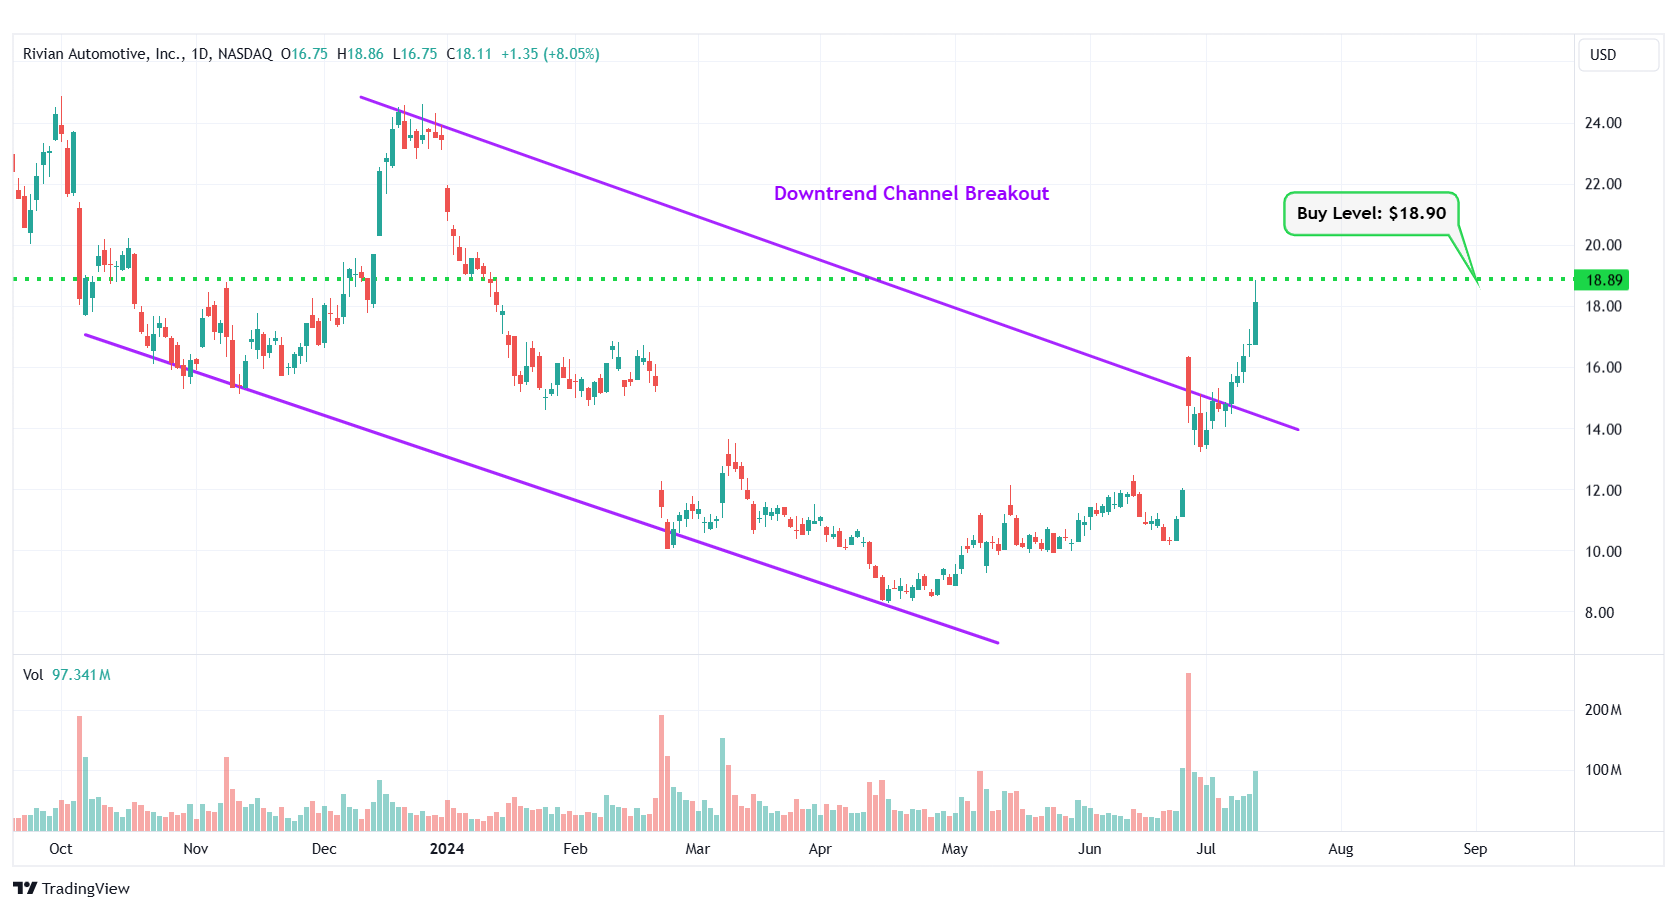
RIVN – Downtrend Channel Breakout
#3 Upstart Holdings Inc. (NASDAQ: UPST)
Sector: Financial • Credit Services
Reason: Symmetrical Triangle Pattern Breakout
A symmetrical triangle is a chart pattern formed by two converging trend lines connecting a series of sequential peaks and troughs. These two lines result in the formation of a triangle that appears to be symmetrical.
A symmetrical triangle pattern is usually formed when there is indecision in the price movements and there is uncertainty among the buyers and sellers. This chart pattern represents a period of consolidation before the price breaks out or breaks down. In case a breakout occurs from the upper trend line, it is a strong bullish indication as it signifies the start of a new bullish trend.
Buy Level(s): The stock has currently broken out of a symmetrical triangle pattern. However, the ideal buy level for UPST is if the stock closes above the immediate resistance level of $31.00. This is marked in the chart below as a green color dotted line.
Daily chart – UPST
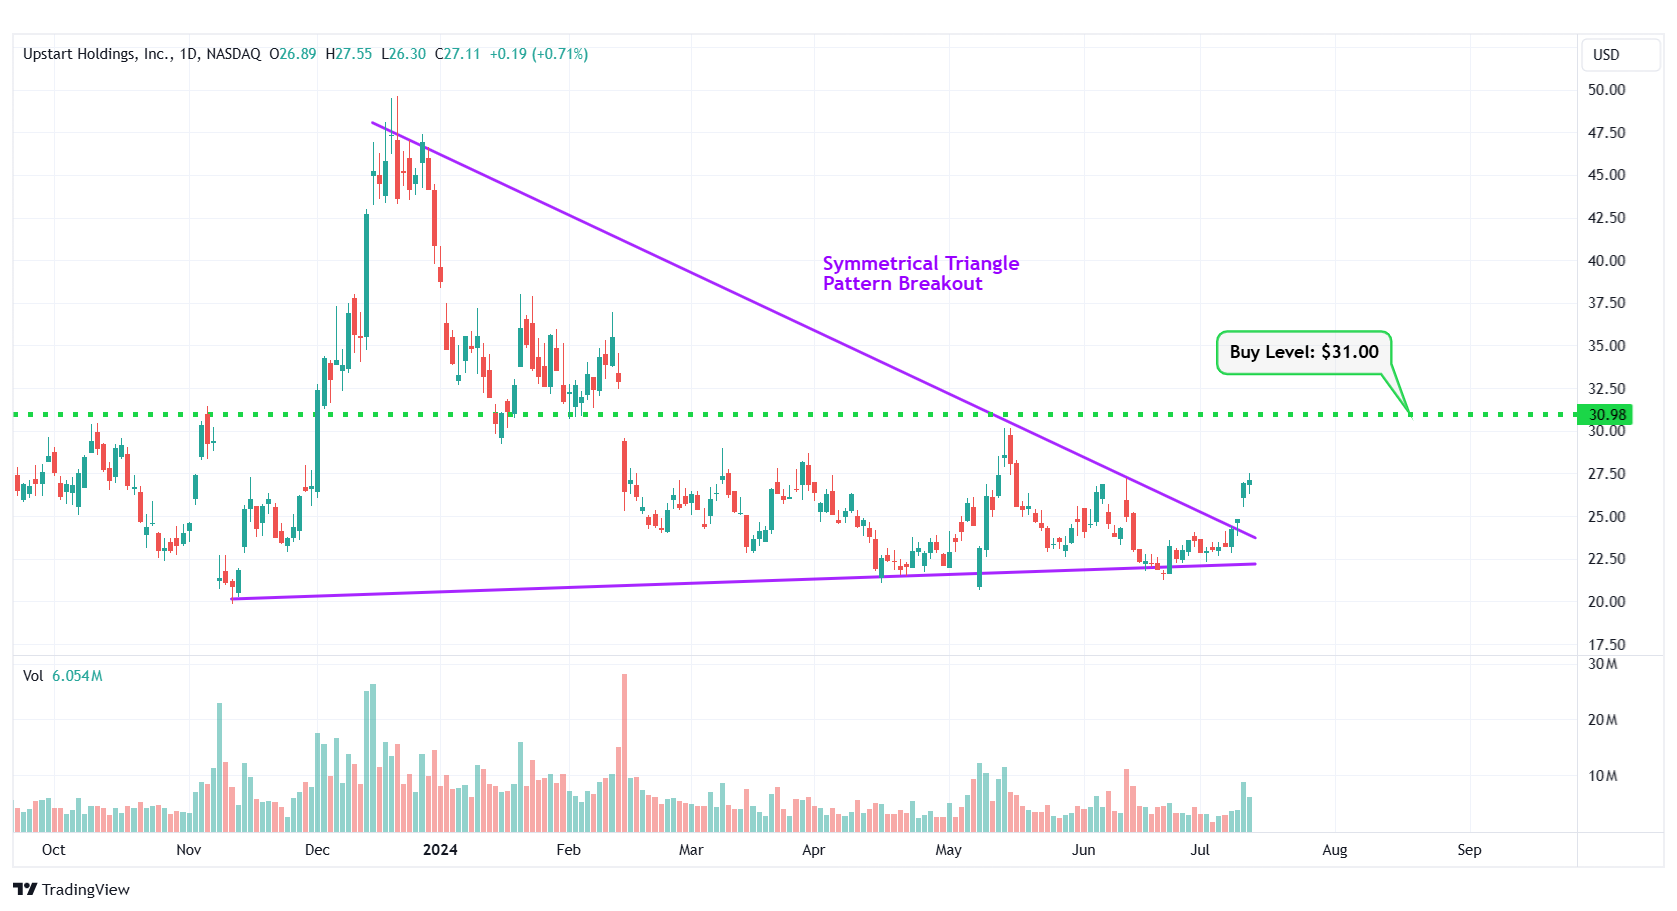
UPST – Symmetrical Triangle Pattern Breakout
#4 PNC Financial Services Group Inc. (NYSE: PNC)
Sector: Financial • Banks – Regional
Reason: Breakout From a Consolidation Area in the Daily Chart
A Consolidation Area is a price action contained between two parallel lines. It is formed by a lower line that connects the lows, and an upper line that joins the highs. A stock usually trades between the two lines of the consolidation area before finally breaking out from the upper rail.
Buy Level(s): Although the stock has currently broken out of a consolidation area, the ideal buy level for PNC is above the near-term resistance area, which translates to a price of around $169.40. This is marked in the chart below as a green color dotted line.
Daily chart – PNC
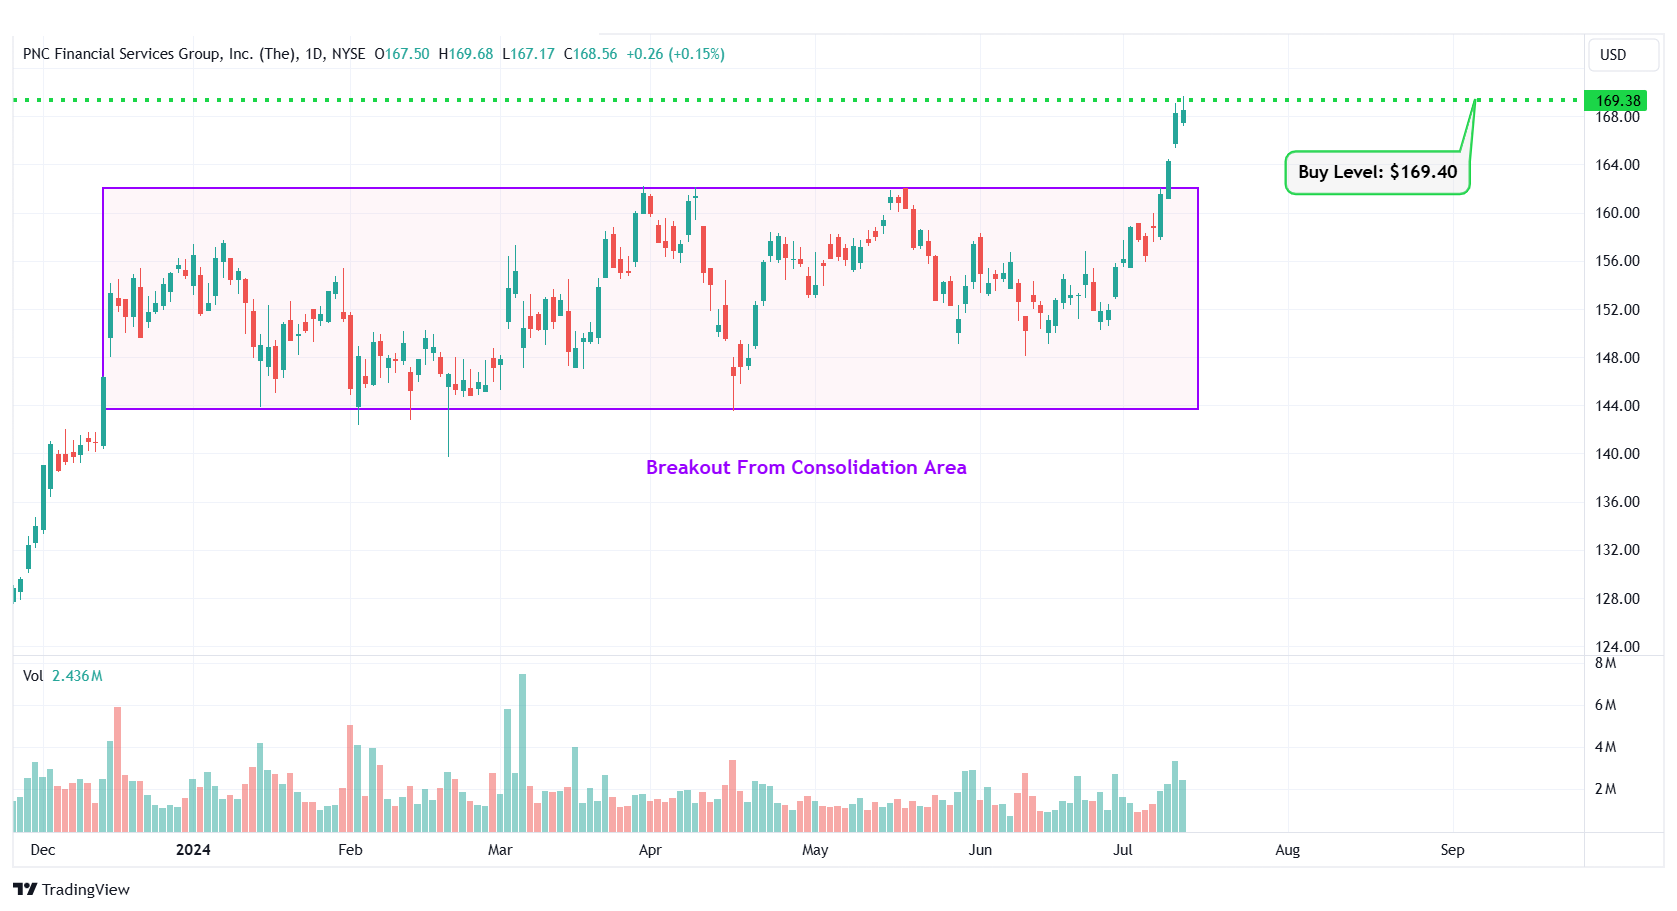
PNC – Breakout From Consolidation Area
#5 Nano X Imaging Ltd (NASDAQ: NNOX)
Sector: Healthcare • Medical Devices
Reason: Formation of a Downtrend Channel
A downtrend or descending channel is the price action contained between downward sloping parallel lines. It is formed by two lines that are drawn by connecting the lower highs and lower lows of a stock’s price. Even though this is typically a bearish pattern, a breakout from the upper rail of this pattern is considered a good bullish indication.
Buy Level(s): The daily chart shows that the stock is currently forming a downtrend channel. The ideal buy level for NNOX is if the stock breaks out of the downtrend channel and has a daily close above $9.30. This is marked in the chart below as a green color dotted line.
Daily chart – NNOX
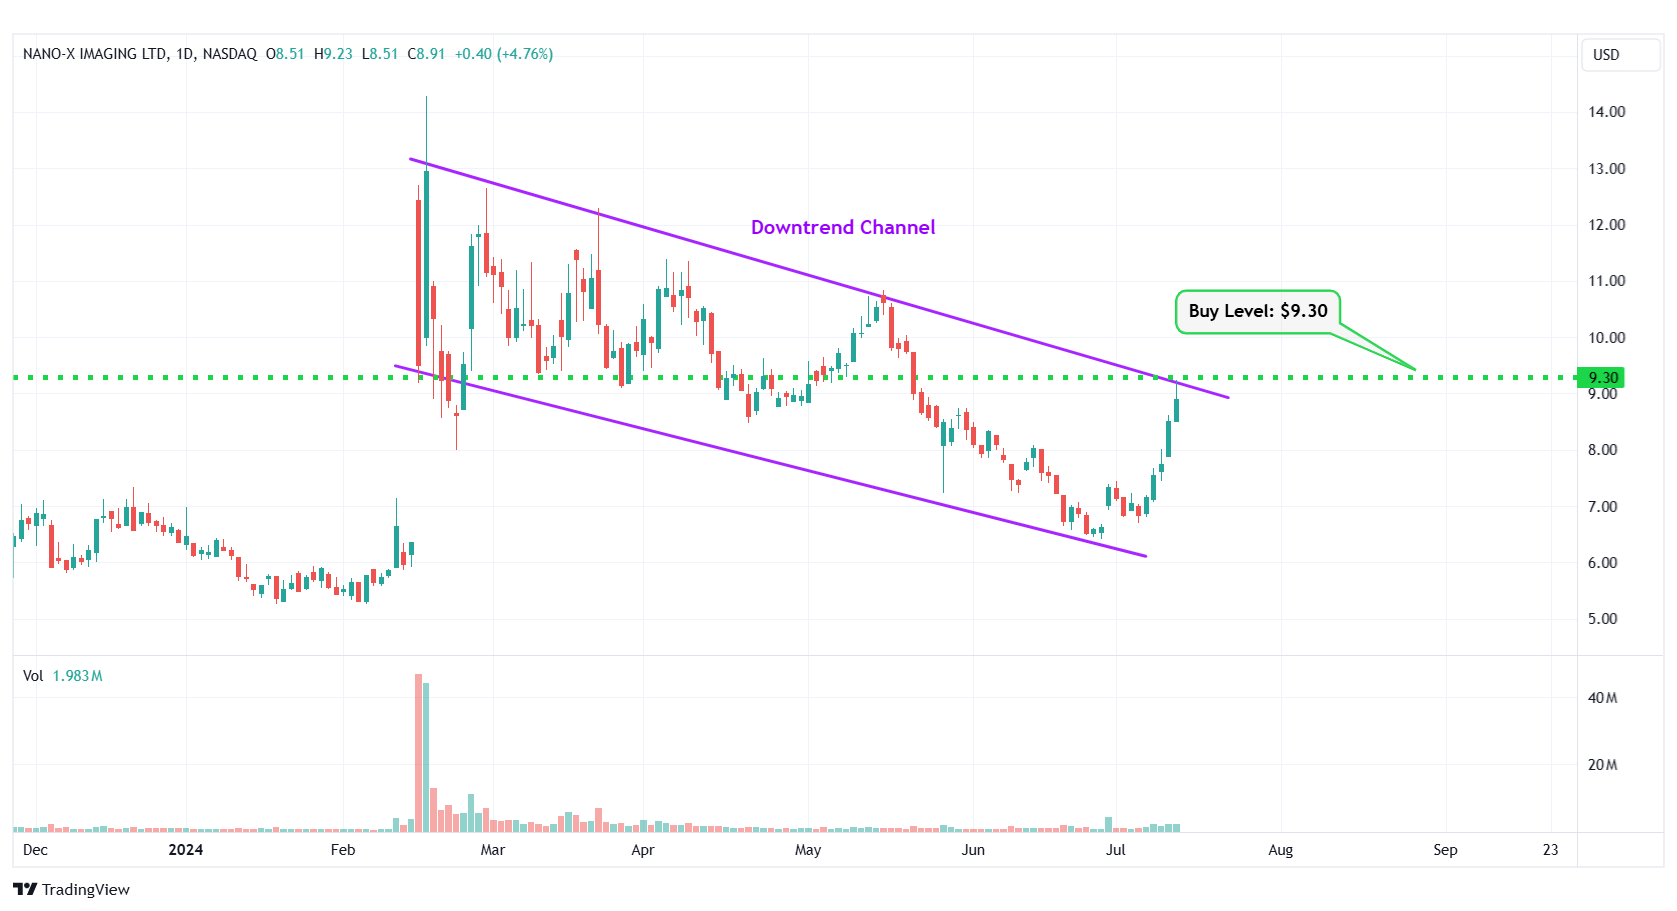
NNOX – Downtrend Channel
#6 ON Semiconductor Corp. (NASDAQ: ON)
Sector: Technology • Semiconductors
Reason: Formation of a Symmetrical Triangle Pattern
A symmetrical triangle is a chart pattern formed by two converging trend lines connecting a series of sequential peaks and troughs. These two lines result in the formation of a triangle that appears to be symmetrical.
A symmetrical triangle pattern is usually formed when there is indecision in the price movements and there is uncertainty among the buyers and sellers. This chart pattern represents a period of consolidation before the price breaks out or breaks down. In case a breakout occurs from the upper trend line, it is a strong bullish indication as it signifies the start of a new bullish trend.
Buy Level(s): The ideal buy level for ON is if the stock has a daily close above the breakout level of the symmetrical triangle pattern, at around $77.50. This is marked in the chart below as a green color dotted line.
Daily chart – ON
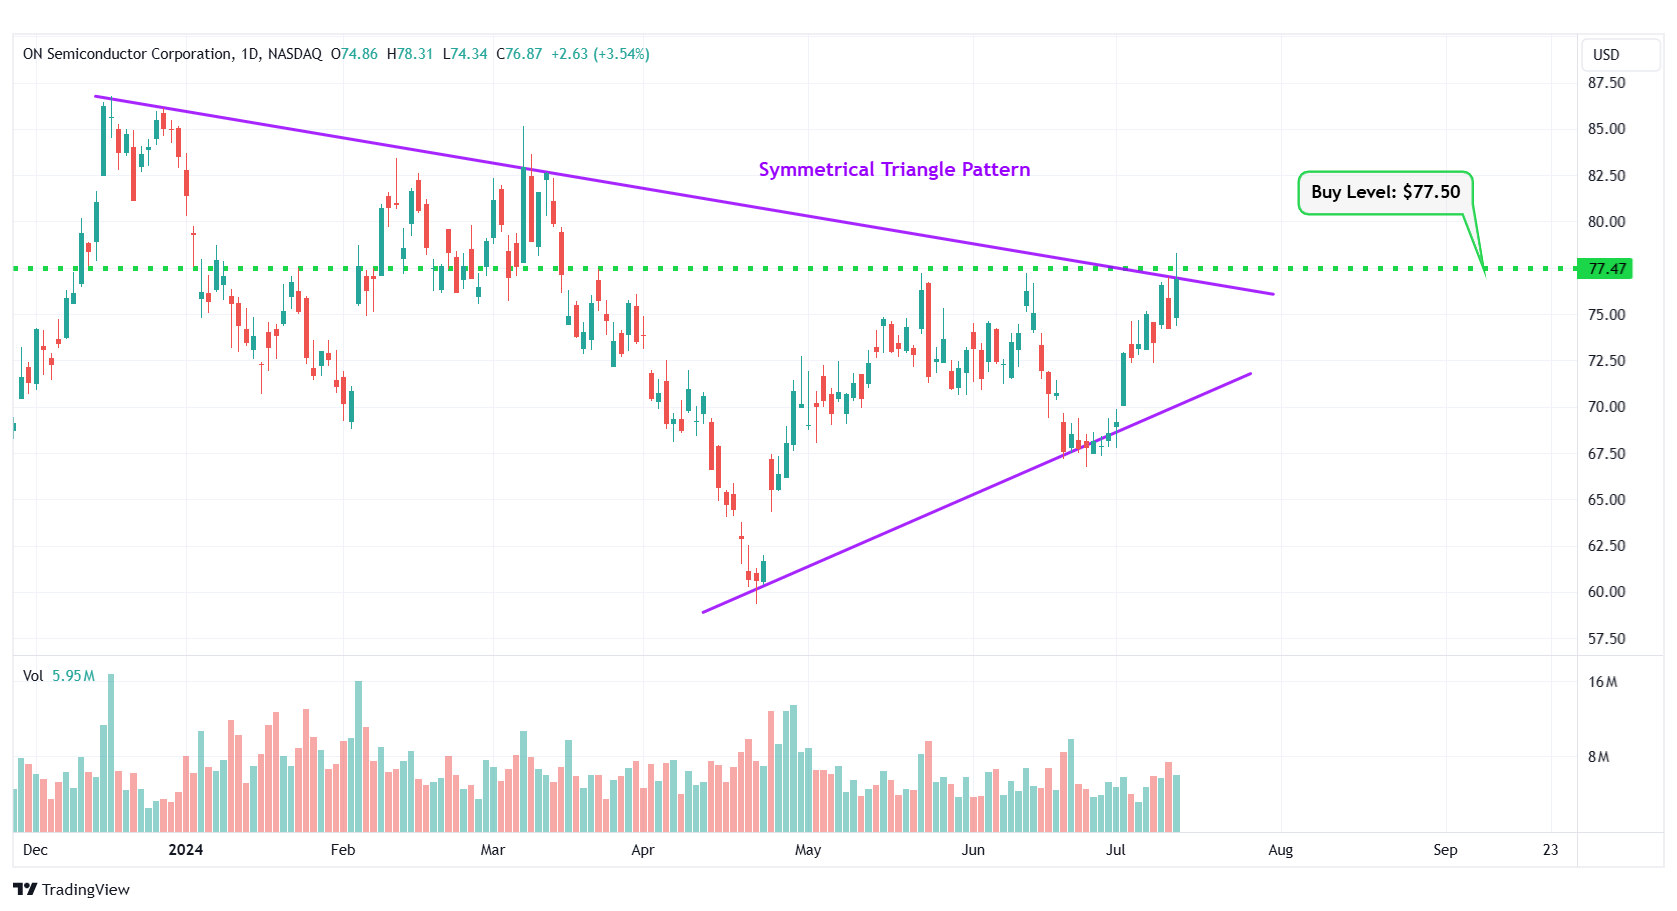
ON – Symmetrical Triangle Pattern
#7 Varonis Systems Inc. (NASDAQ: VRNS)
Sector: Technology • Software – Infrastructure
Reason: Breakout From a Flag Pattern
A flag pattern is a short-term continuation pattern that marks a small consolidation before the previous move resumes. The pattern is formed when the market consolidates in a narrow range after a sharp move. For a stock in an uptrend, a breakout from this pattern is typically a strong bullish indication.
Buy Level(s): Although the stock has currently broken out of the flag pattern, the ideal buy level for VRNS is above the near-term resistance level of $50.30. This is marked in the chart below as a green color dotted line.
Daily chart – VRNS
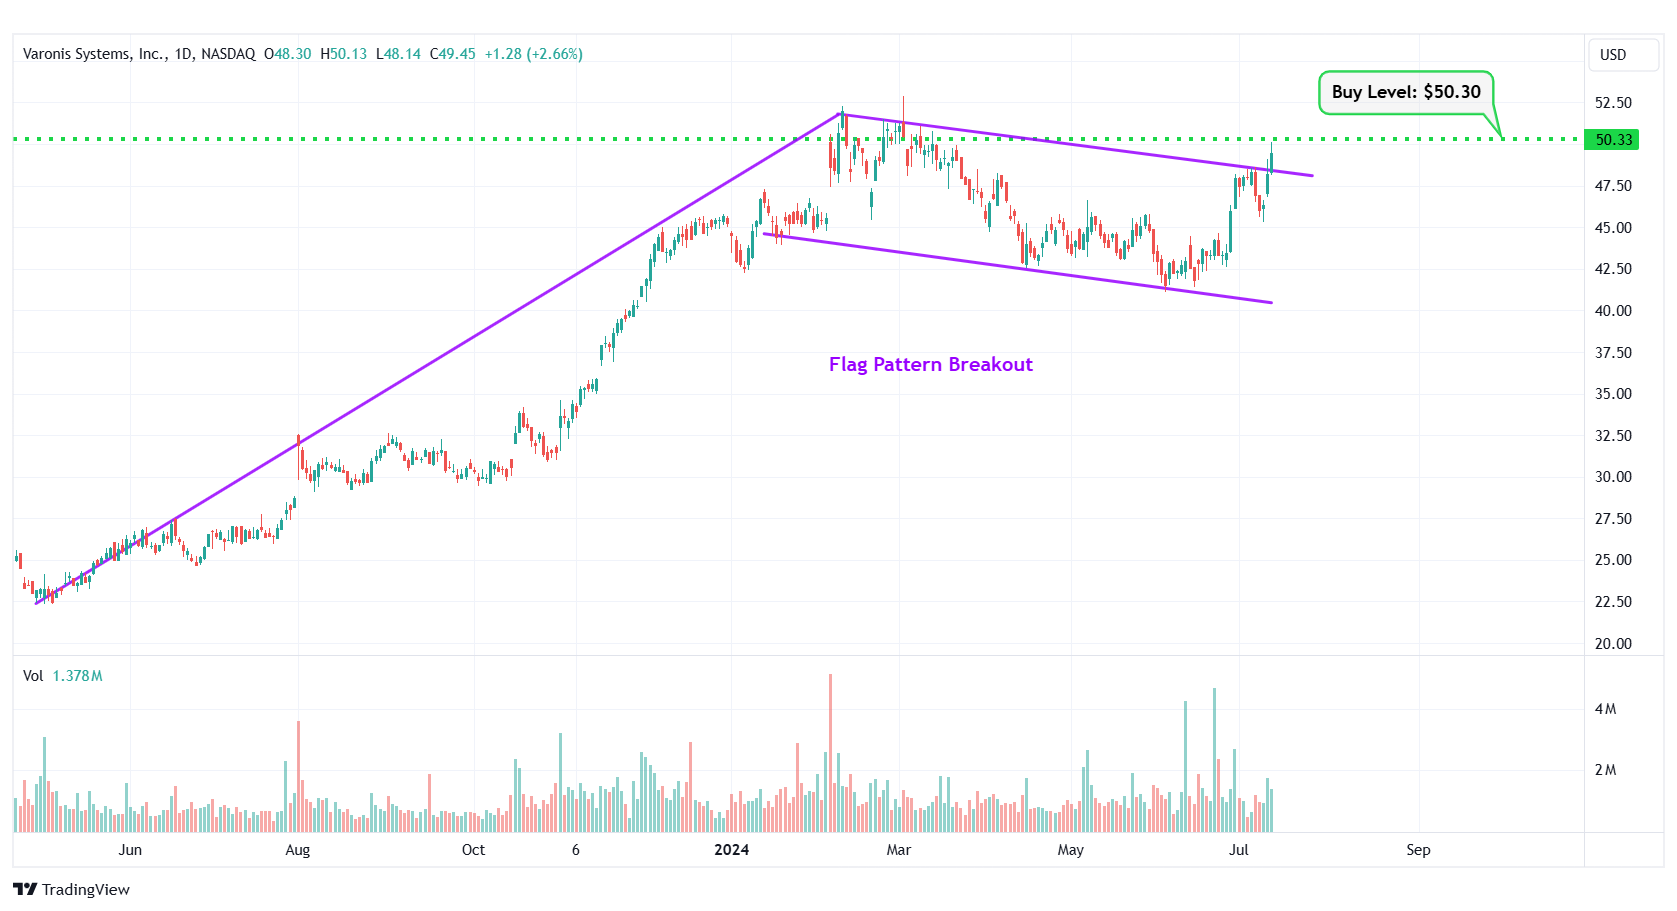
VRNS – Flag Pattern Breakout
#8 SoundHound AI Inc. (NASDAQ: SOUN)
Sector: Technology • Software – Application
Reason: Symmetrical Triangle Pattern Breakout
A symmetrical triangle is a chart pattern formed by two converging trend lines connecting a series of sequential peaks and troughs. These two lines result in the formation of a triangle that appears to be symmetrical.
A symmetrical triangle pattern is usually formed when there is indecision in the price movements and there is uncertainty among the buyers and sellers. This chart pattern represents a period of consolidation before the price breaks out or breaks down. In case a breakout occurs from the upper trend line, it is a strong bullish indication as it signifies the start of a new bullish trend.
Buy Level(s): The stock has currently broken out of a symmetrical triangle pattern. However, the ideal buy level for SOUN is if the stock closes above the immediate resistance level of $6.50. This is marked in the chart below as a green color dotted line.
Daily chart – SOUN
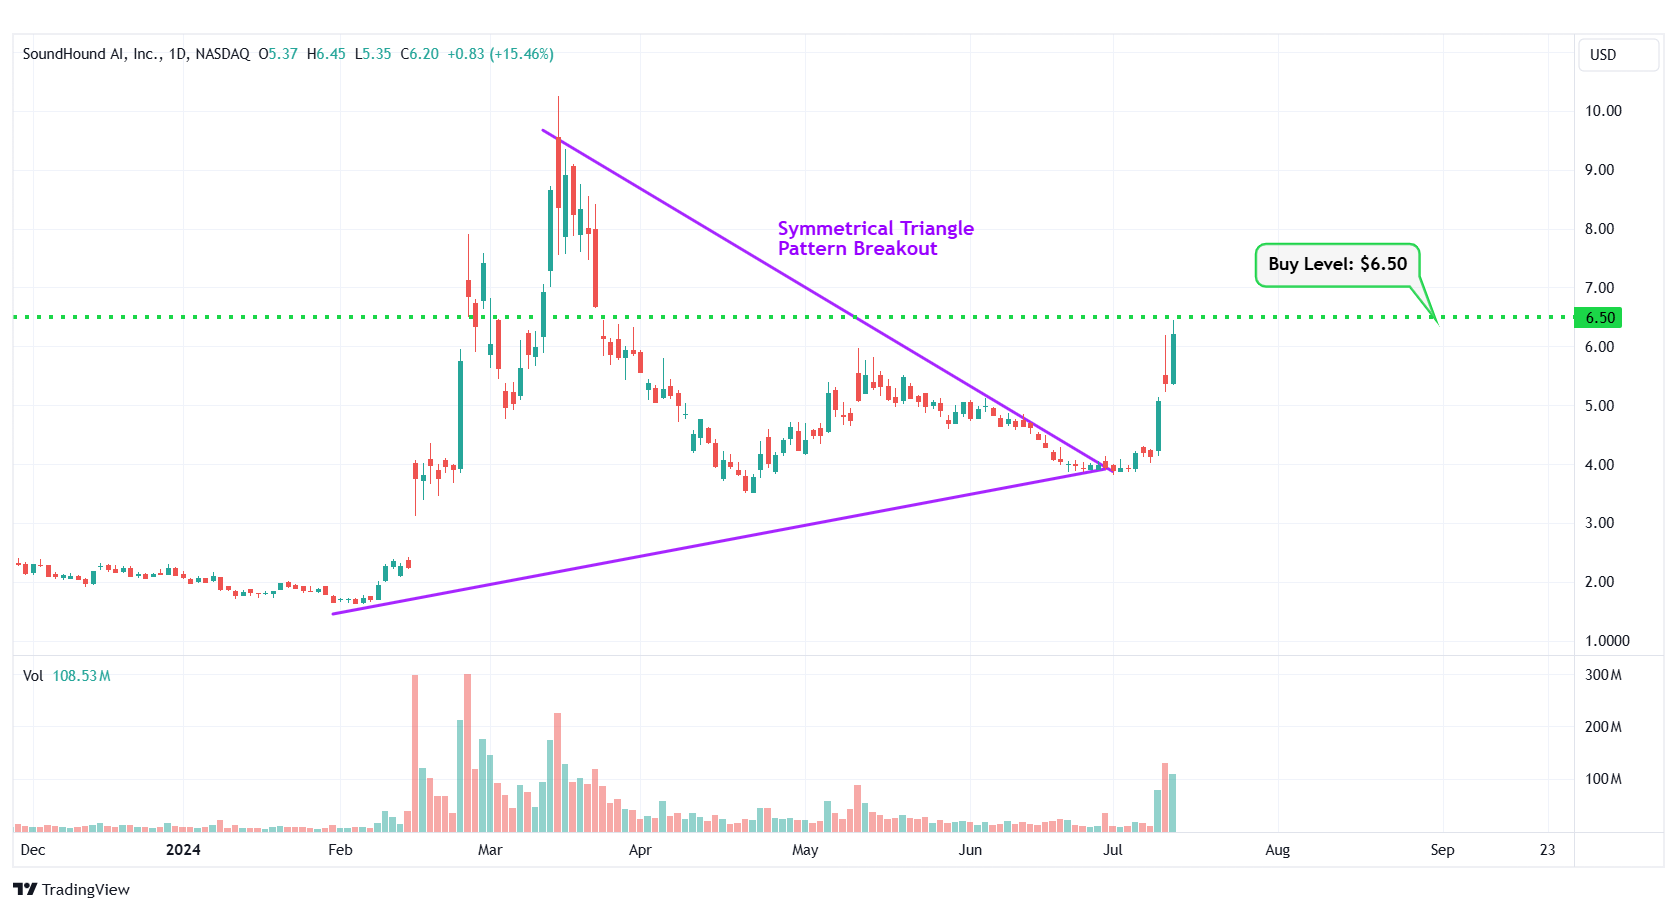
SOUN – Symmetrical Triangle Pattern Breakout
#9 Mastercard Incorporated (NYSE: MA)
Sector: Financial • Credit Services
Reason: Formation of a Downtrend Channel
A downtrend or descending channel is the price action contained between downward sloping parallel lines. It is formed by two lines that are drawn by connecting the lower highs and lower lows of a stock’s price. Even though this is typically a bearish pattern, a breakout from the upper rail of this pattern is considered a good bullish indication.
Buy Level(s): The daily chart shows that the stock is currently forming a downtrend channel. The ideal buy level for MA is if the stock breaks out of the downtrend channel and has a daily close above $450.00. This is marked in the chart below as a green color dotted line.
Daily chart – MA
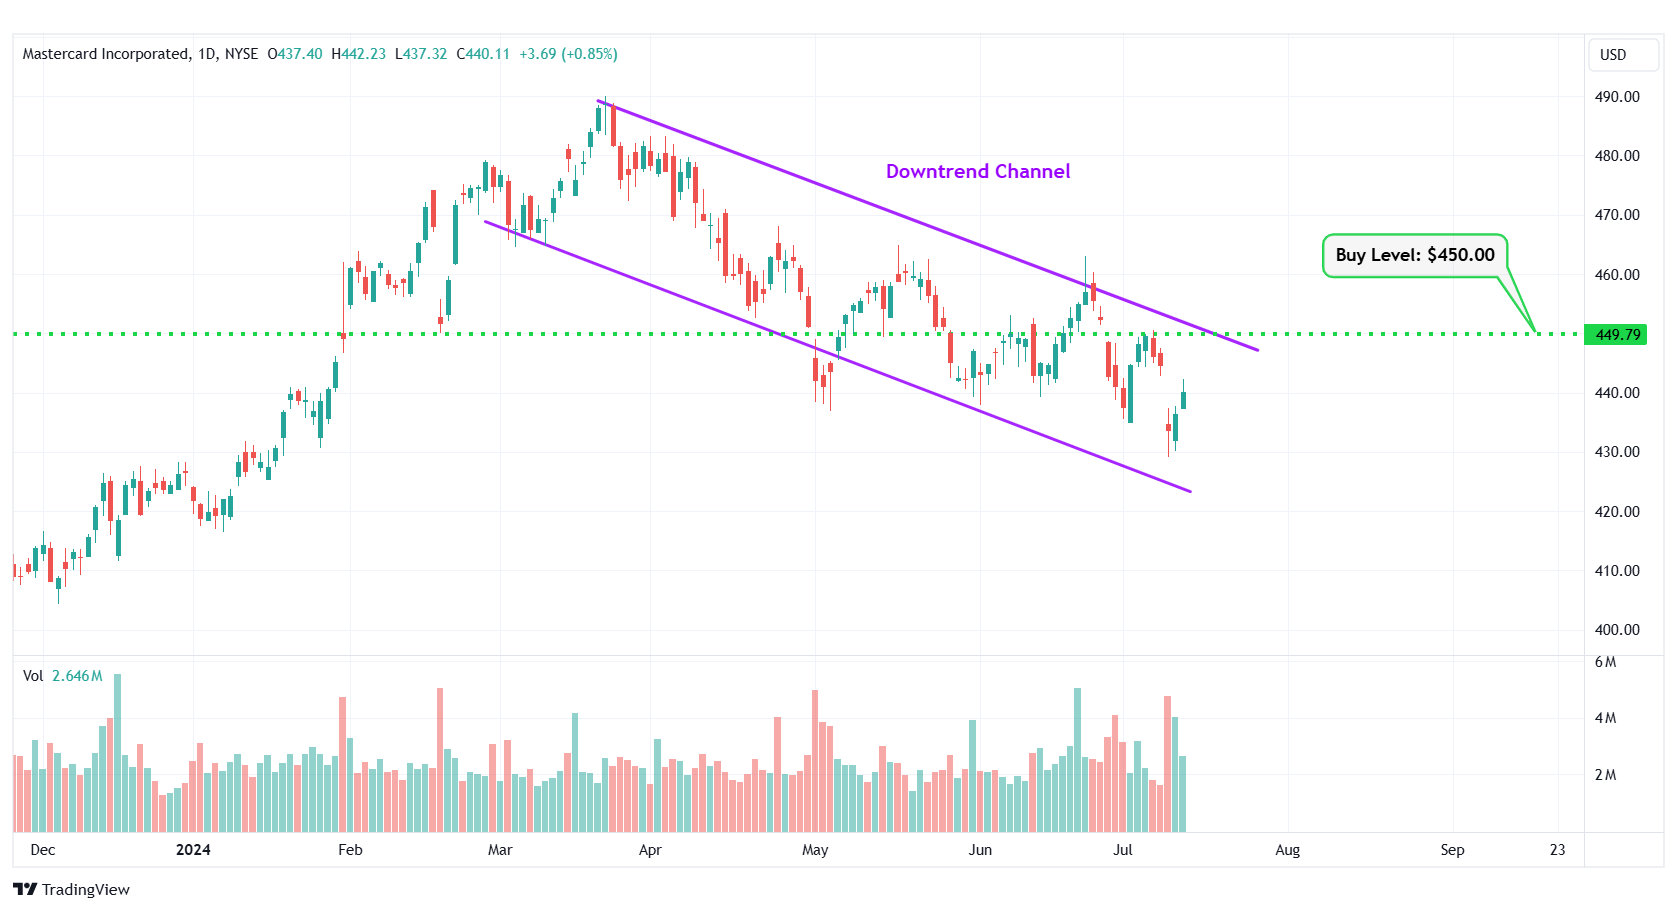
MA – Downtrend Channel
#10 Redfin Corp (NASDAQ: RDFN)
Sector: Real Estate • Real Estate Services
Reason: Symmetrical Triangle Pattern Breakout
A symmetrical triangle is a chart pattern formed by two converging trend lines connecting a series of sequential peaks and troughs. These two lines result in the formation of a triangle that appears to be symmetrical.
A symmetrical triangle pattern is usually formed when there is indecision in the price movements and there is uncertainty among the buyers and sellers. This chart pattern represents a period of consolidation before the price breaks out or breaks down. In case a breakout occurs from the upper trend line, it is a strong bullish indication as it signifies the start of a new bullish trend.
Buy Level(s): The stock has currently broken out of a symmetrical triangle pattern. However, the ideal buy level for RDFN is if the stock closes above the immediate resistance level of $8.00. This is marked in the chart below as a green color dotted line.
Daily chart – RDFN
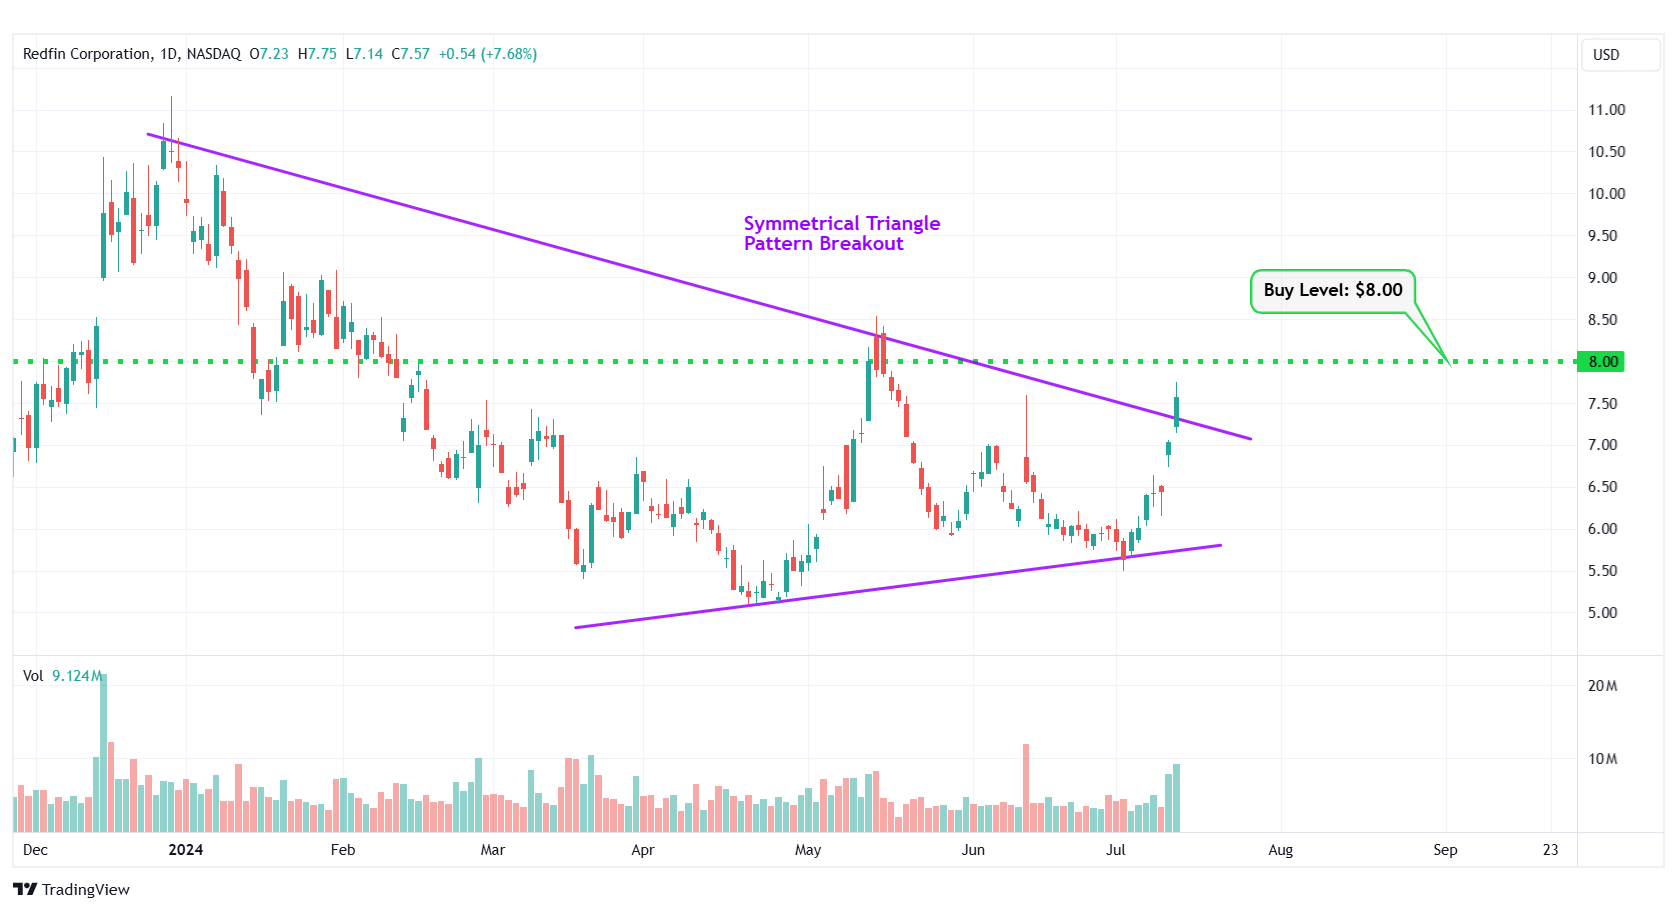
RDFN – Symmetrical Triangle Pattern Breakout
Happy Trading!
Trades of The Day Research Team
Karim Rahemtulla, the trader behind a 400% gain in 24-months on Rolls-Royce, has uncovered another potential multi-bagger. This under-$20 stock gives you exposure to over 1-oz of gold with the lowest production costs in the industry. And an upcoming announcement could send this stock soaring. Get Karim's urgent briefing - click here now.
Source: Trades of the Day
