Picking a winning trade on a consistent basis is not simply a stroke of luck. It’s the result of calculated screening, planning, and deliberation.
With this in mind, we have started a new weekly series on our top 10 stocks to watch this week — stocks that look poised for a possible breakout in the coming days. Traders should add these stocks to their watchlist now.
The Top 10 Stocks to Watch This Week for Possible Breakouts
| Sl # | Name of the Stock | Stock Ticker | Last Close | Buy Level(s) | Reason |
| 1 | Target Corp | NYSE: TGT | $148.04 | $150.10 | Symmetrical Triangle Pattern |
| 2 | ARS Pharmaceuticals Inc. | NASDAQ: SPRY | $8.51 | $9.20 | Flag Pattern |
| 3 | Unitedhealth Group Inc. | NYSE: UNH | $509.26 | $517.00 | Symmetrical Triangle Pattern |
| 4 | Longboard Pharmaceuticals Inc. | NASDAQ: LBPH | $27.03 | $27.50 | Downtrend Channel Breakout |
| 5 | WNS Holdings Limited | NYSE: WNS | $52.50 | $53.00 | Symmetrical Triangle Pattern |
| 6 | American Public Education Inc. | NASDAQ: APEI | $17.58 | $17.90 | Flag Pattern Breakout |
| 7 | Medifast Inc. | NYSE: MED | $21.82 | $22.70 | Falling Wedge Pattern Breakout |
| 8 | CNA Financial Corp. | NYSE: CNA | $46.07 | $46.50 | Symmetrical Triangle Pattern Breakout |
| 9 |
Permian Resources Corp |
NYSE: PR | $16.15 | $16.30 | Downtrend Channel Breakout |
| 10 | Seadrill Ltd. | NYSE: SDRL | $51.50 | $52.00 | Symmetrical Triangle Pattern |
Important: Typically, these trades offer a risk: reward ratio of 1:2 or 1:3 in the next 6 months, which implies 2x to 3x rewards when compared to risks. So, be sure to set your stop-loss levels and target prices accordingly to manage your risk. In addition, these trade ideas are triggered using daily closing prices, not intra-day pricing. So, if you participate in these trades, make sure that you only buy the stock once its daily close is above the recommended price level.
That said, here are the top 10 stocks to watch for a breakout, in no particular order.
#1 Target Corp (NYSE: TGT)
Sector: Consumer Defensive • Discount Stores
Reason: Formation of a Symmetrical Triangle Pattern
A symmetrical triangle is a chart pattern formed by two converging trend lines connecting a series of sequential peaks and troughs. These two lines result in the formation of a triangle that appears to be symmetrical.
A symmetrical triangle pattern is usually formed when there is indecision in the price movements and there is uncertainty among the buyers and sellers. This chart pattern represents a period of consolidation before the price breaks out or breaks down. In case a breakout occurs from the upper trend line, it is a strong bullish indication as it signifies the start of a new bullish trend.
Buy Level(s): The ideal buy level for TGT is if the stock has a daily close above the breakout level of the symmetrical triangle pattern, at around $150.10. This is marked in the chart below as a green color dotted line.
Daily chart – TGT
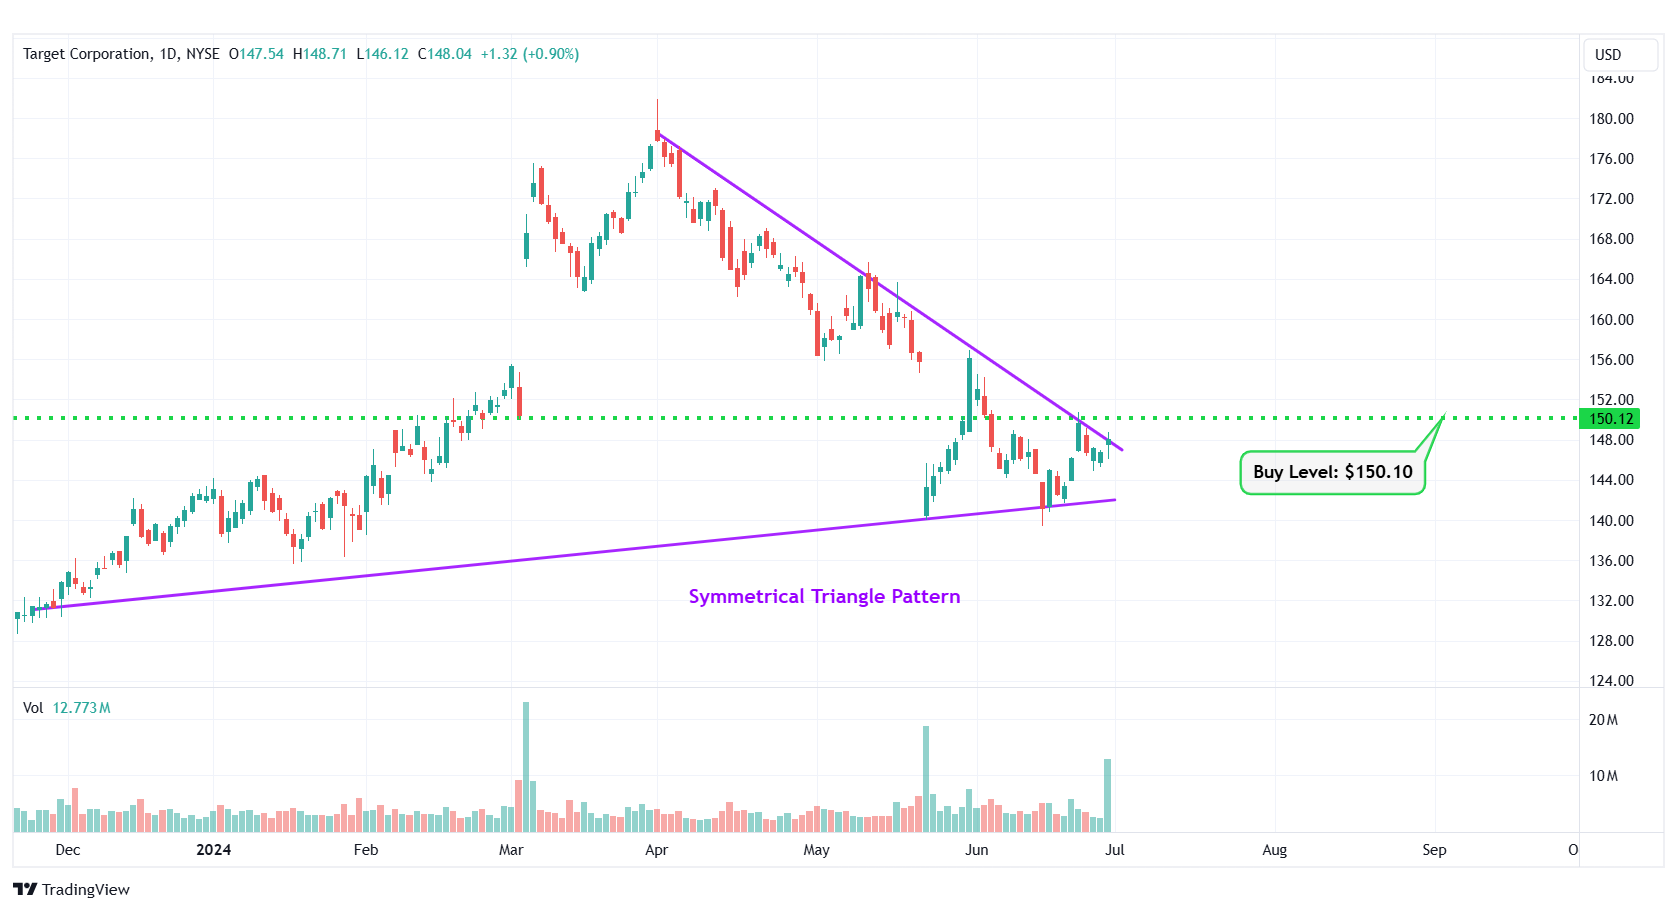
TGT – Symmetrical Triangle Pattern
#2 ARS Pharmaceuticals Inc. (NASDAQ: SPRY)
Sector: Healthcare • Biotechnology
Reason: Formation of a Flag Pattern
A flag pattern is a short-term continuation pattern that marks a small consolidation before the previous move resumes. The pattern is formed when the market consolidates in a narrow range after a sharp move. For a stock in an uptrend, a breakout from this pattern is typically a strong bullish indication.
Buy Level(s): The ideal buy level for SPRY is if the stock breaks out of the flag pattern, at around $9.20. This is marked in the chart below as a green color dotted line.
Daily chart – SPRY
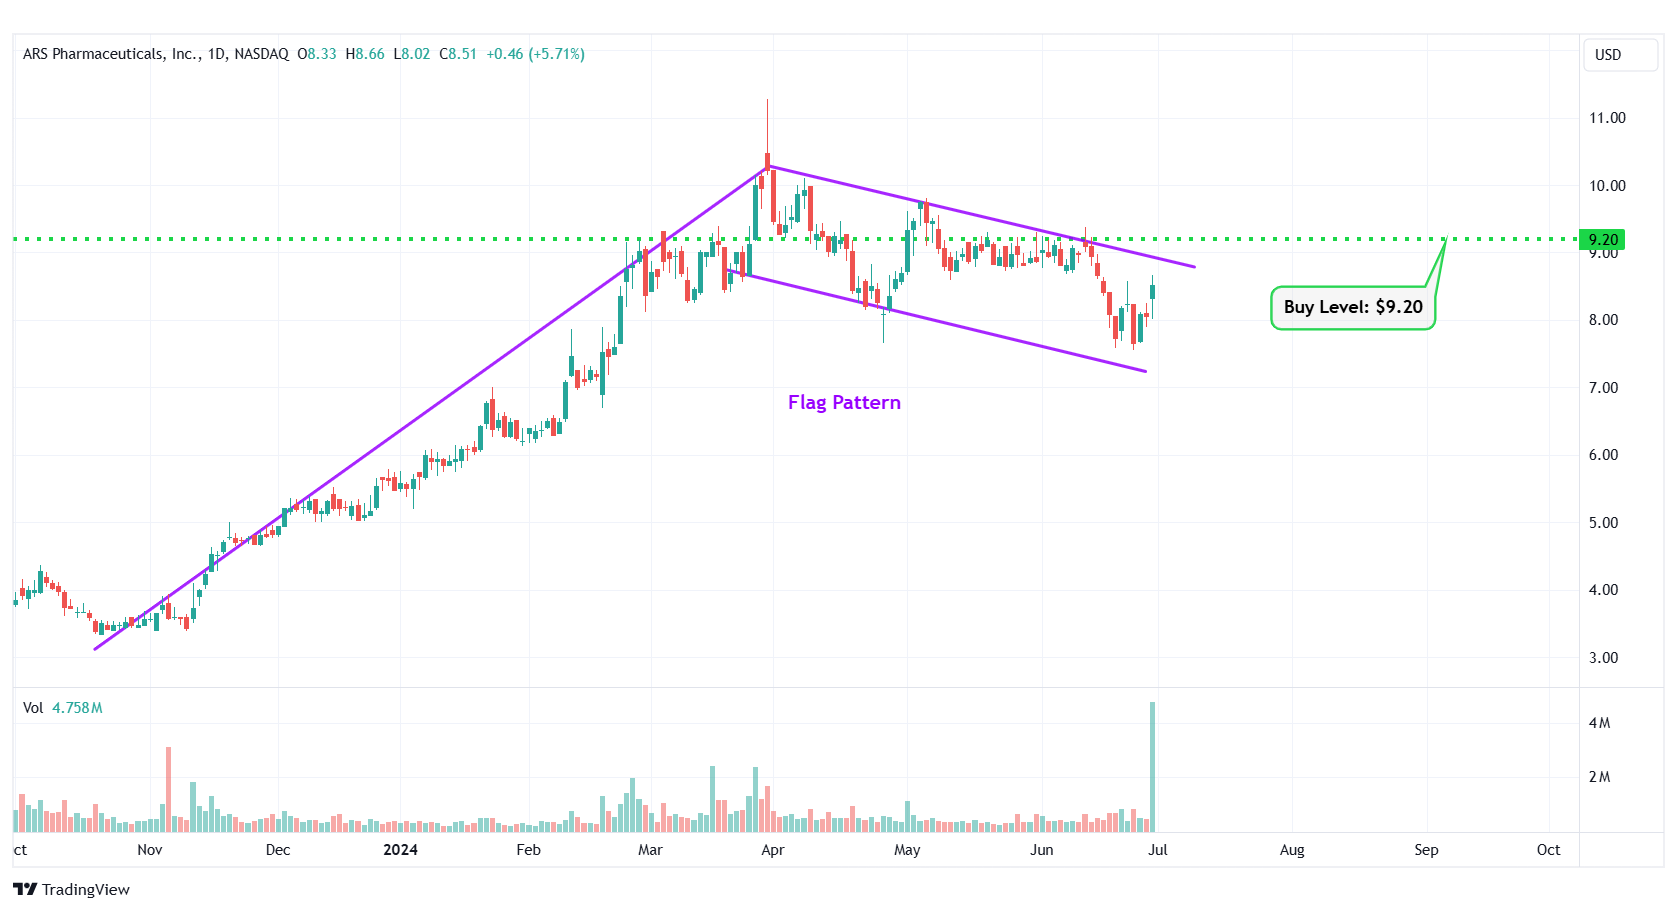
SPRY – Flag Pattern
#3 Unitedhealth Group Inc. (NYSE: UNH)
Sector: Healthcare • Healthcare Plans
Reason: Formation of a Symmetrical Triangle Pattern
A symmetrical triangle is a chart pattern formed by two converging trend lines connecting a series of sequential peaks and troughs. These two lines result in the formation of a triangle that appears to be symmetrical.
A symmetrical triangle pattern is usually formed when there is indecision in the price movements and there is uncertainty among the buyers and sellers. This chart pattern represents a period of consolidation before the price breaks out or breaks down. In case a breakout occurs from the upper trend line, it is a strong bullish indication as it signifies the start of a new bullish trend.
Buy Level(s): The ideal buy level for UNH is if the stock has a daily close above the breakout level of the symmetrical triangle pattern, at around $517.00. This is marked in the chart below as a green color dotted line.
Daily chart – UNH
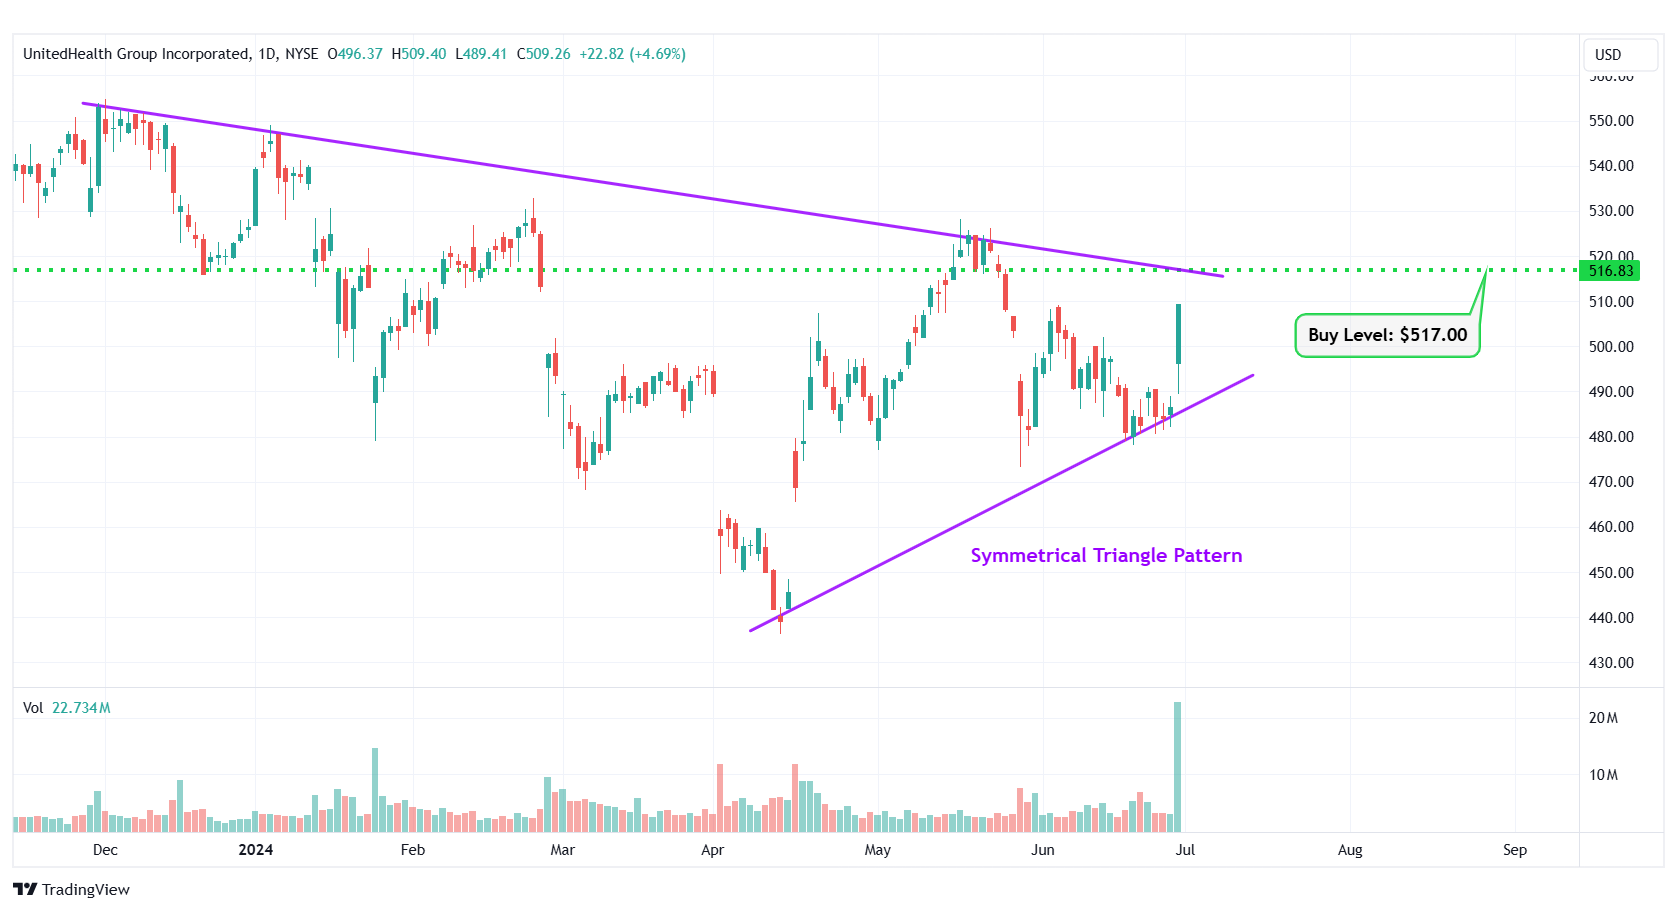
UNH – Symmetrical Triangle Pattern
#4 Longboard Pharmaceuticals Inc. (NASDAQ: LBPH)
Sector: Healthcare • Biotechnology
Reason: Downtrend Channel Breakout
A downtrend or descending channel is the price action contained between downward sloping parallel lines. It is formed by two lines that are drawn by connecting the lower highs and lower lows of a stock’s price. Even though this is typically a bearish pattern, a breakout from the upper rail of this pattern is considered a good bullish indication.
Buy Level(s): The daily chart shows that the stock has currently broken out of a downtrend channel. However, there is a near-term resistance level for the stock. Hence, the ideal buy level for LBPH is if the stock has a daily close above $27.50. This is marked in the chart below as a green color dotted line.
Daily chart – LBPH
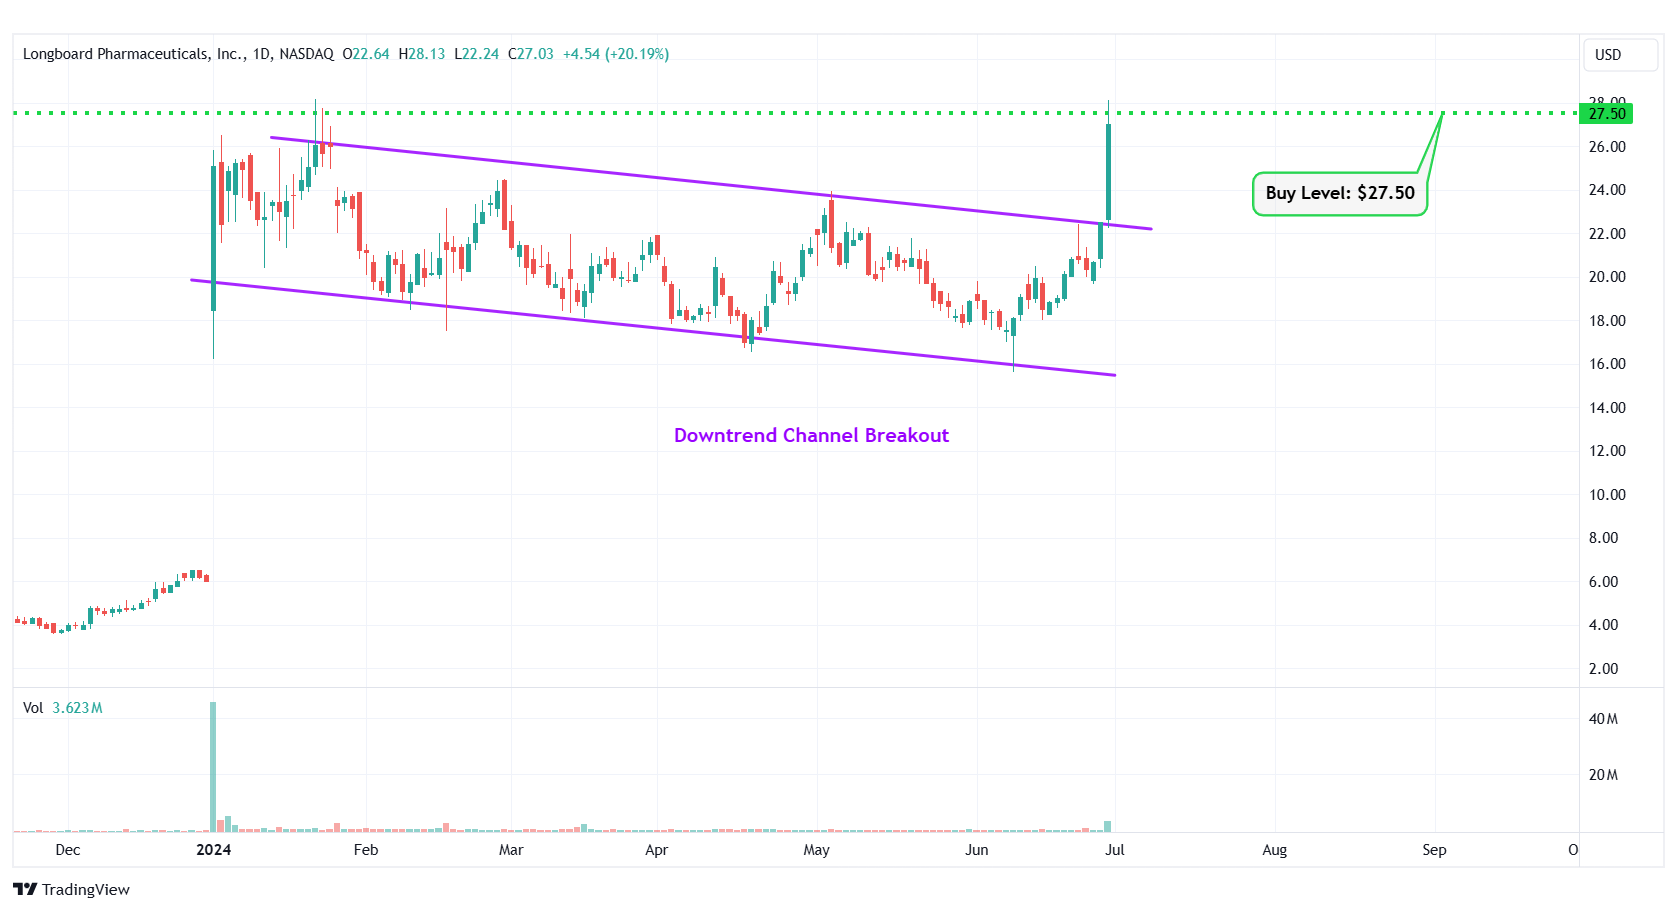
LBPH – Downtrend Channel Breakout
#5 WNS Holdings Limited (NYSE: WNS)
Sector: Technology • Information Technology Services
Reason: Formation of a Symmetrical Triangle Pattern
A symmetrical triangle is a chart pattern formed by two converging trend lines connecting a series of sequential peaks and troughs. These two lines result in the formation of a triangle that appears to be symmetrical.
A symmetrical triangle pattern is usually formed when there is indecision in the price movements and there is uncertainty among the buyers and sellers. This chart pattern represents a period of consolidation before the price breaks out or breaks down. In case a breakout occurs from the upper trend line, it is a strong bullish indication as it signifies the start of a new bullish trend.
Buy Level(s): The ideal buy level for WNS is if the stock has a daily close above the breakout level of the symmetrical triangle pattern, at around $53.00. This is marked in the chart below as a green color dotted line.
Daily chart – WNS
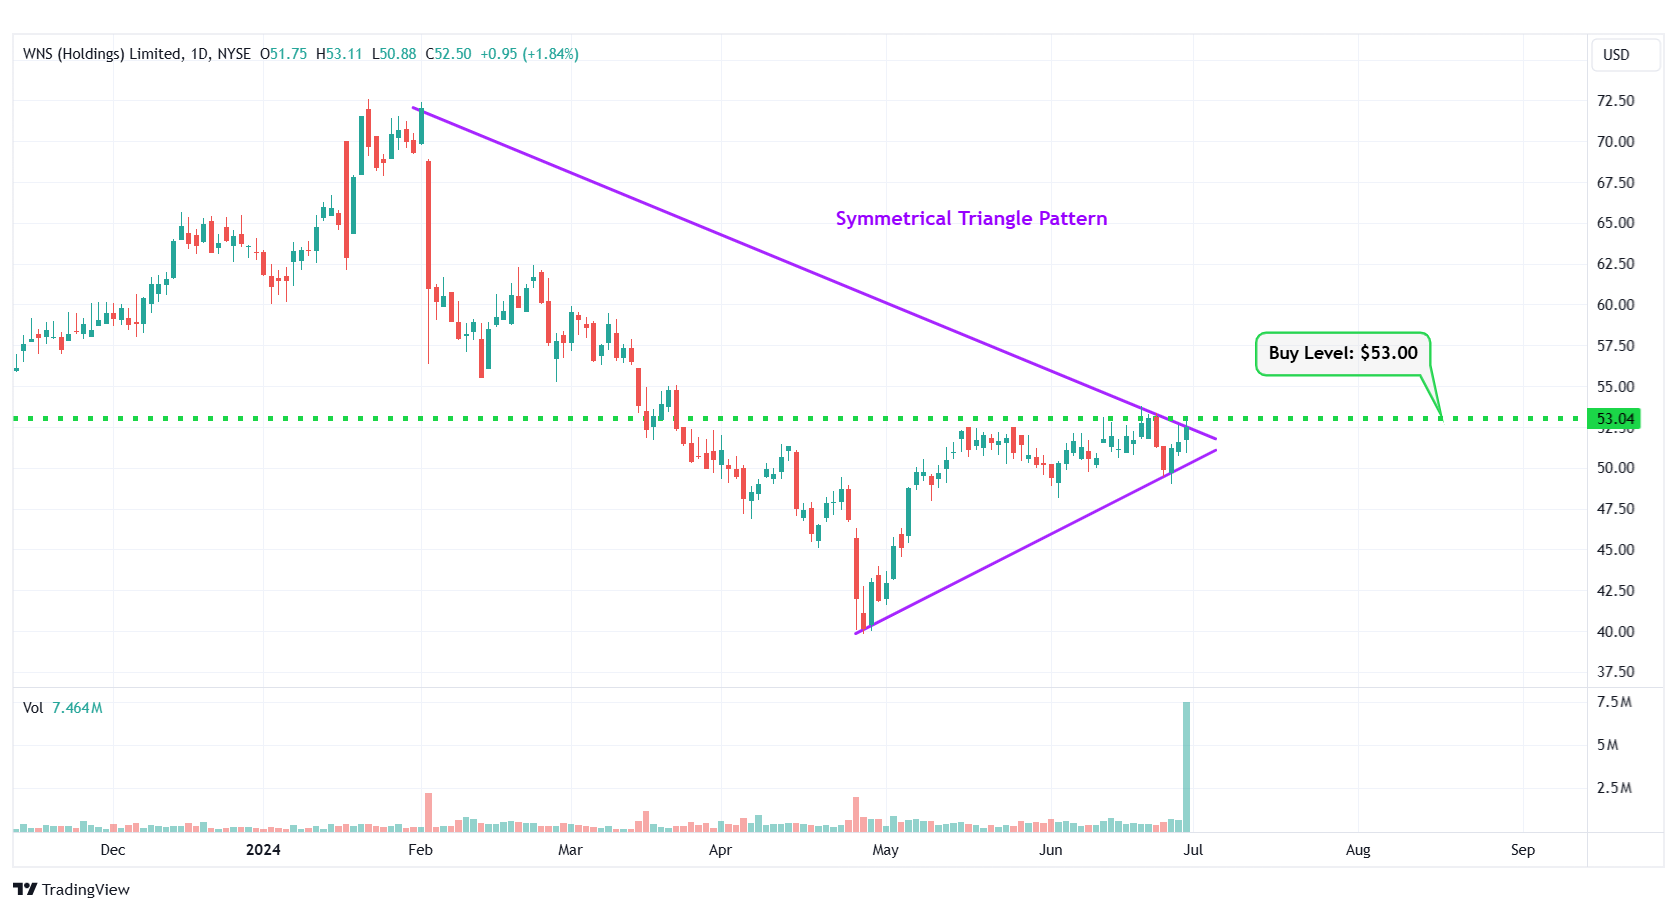
WNS – Symmetrical Triangle Pattern
#6 American Public Education Inc. (NASDAQ: APEI)
Sector: Consumer Defensive • Education & Training Services
Reason: Breakout From a Flag Pattern
A flag pattern is a short-term continuation pattern that marks a small consolidation before the previous move resumes. The pattern is formed when the market consolidates in a narrow range after a sharp move. For a stock in an uptrend, a breakout from this pattern is typically a strong bullish indication.
Buy Level(s): Although the stock has currently broken out of the flag pattern, the ideal buy level for APEI is above the near-term resistance level of $17.90. This is marked in the chart below as a green color dotted line.
Daily chart – APEI
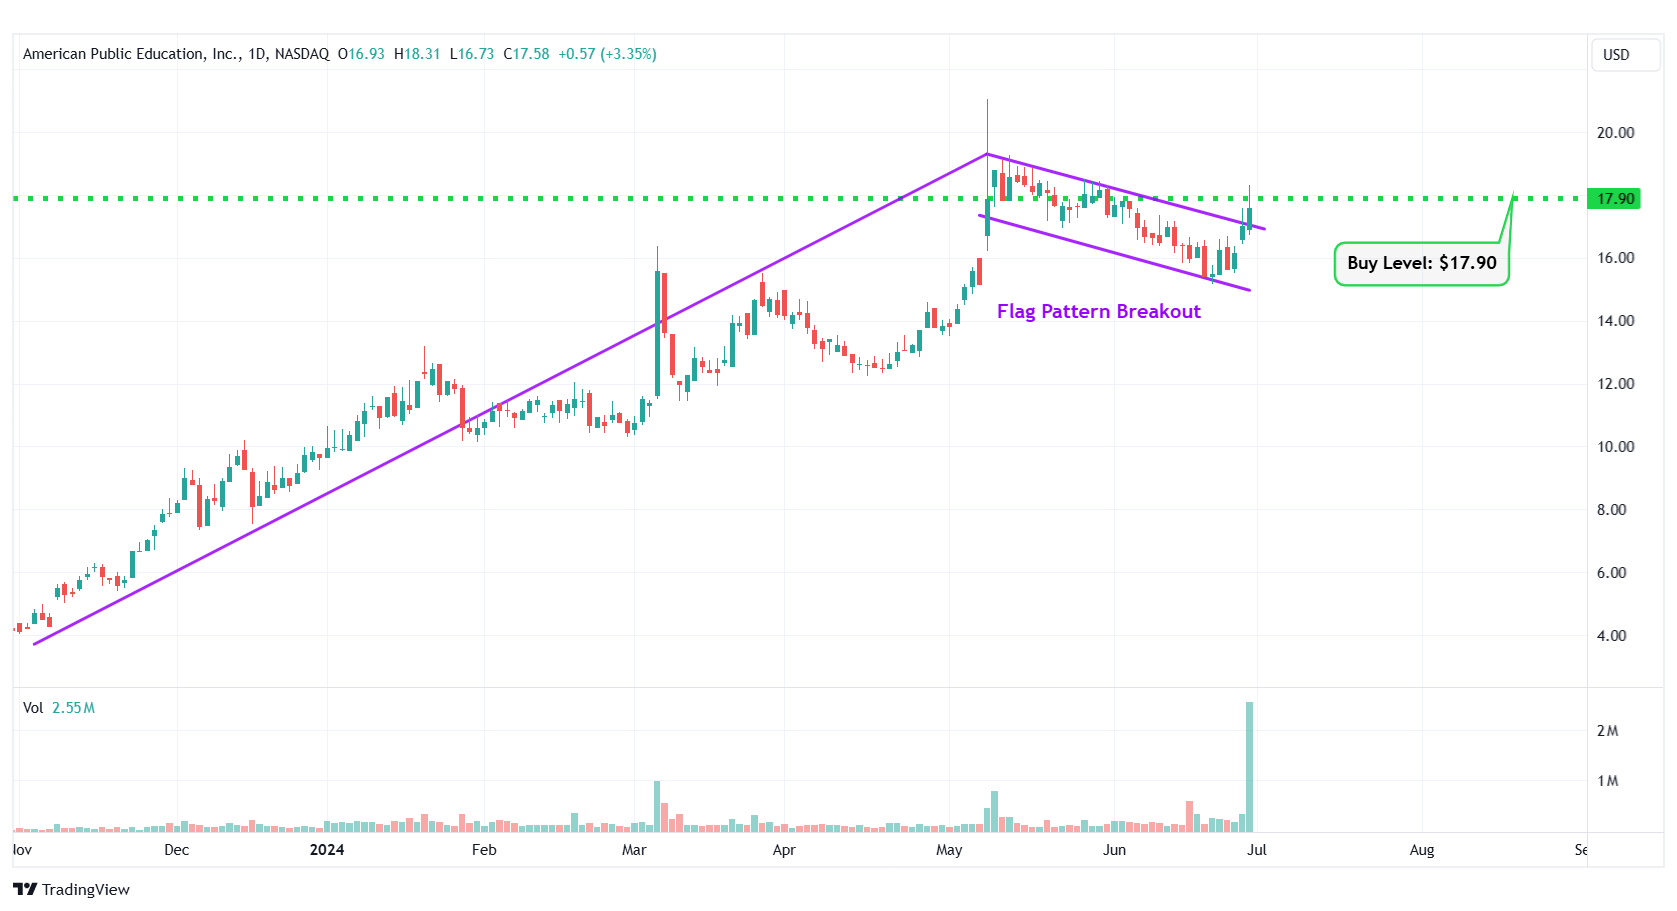
APEI – Flag Pattern Breakout
#7 Medifast Inc. (NYSE: MED)
Sector: Consumer Cyclical • Personal Services
Reason: Falling Wedge Pattern Breakout
A falling wedge pattern is formed by joining two downward-sloping, converging trendlines having a contracting range. The pattern appears to be wide at the top and continues to contract as prices fall. A breakout from a falling wedge pattern can indicate either reversal or continuation depending on where the pattern appeared in the trend.
A stock that has broken out of a falling wedge pattern would have gained momentum and would have the potential to move higher.
Buy Level(s): The stock has currently broken out of a falling wedge pattern. However, the ideal buy level for MED is above the nearest resistance level of $22.70. This is marked in the chart below as a green color dotted line.
Daily chart – MED
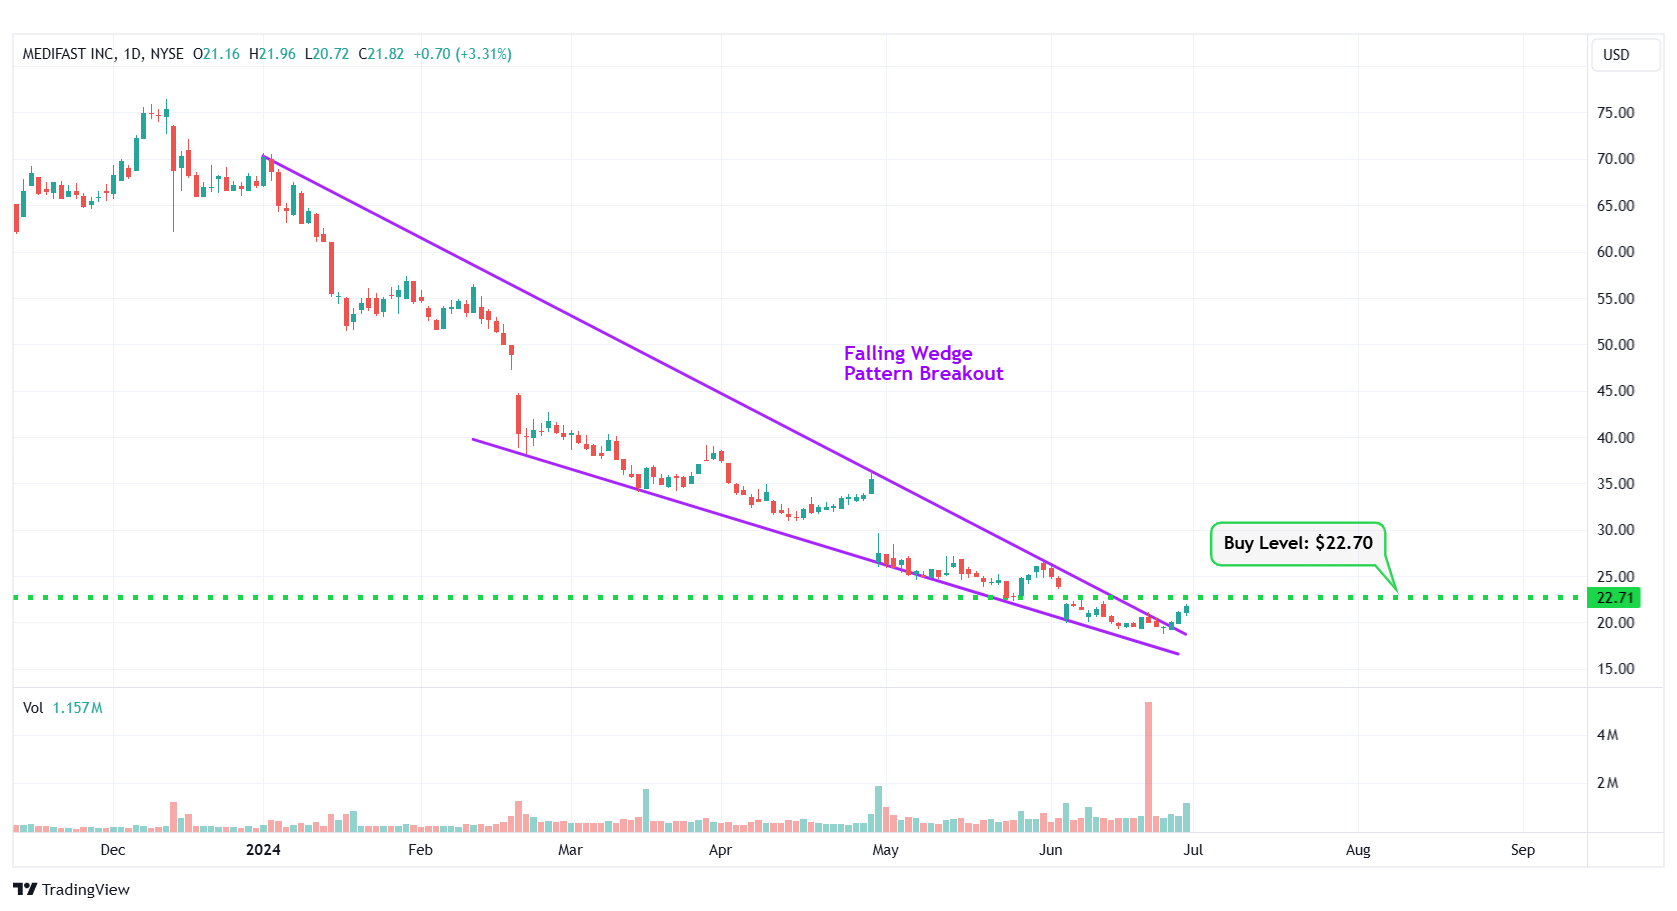
MED – Falling Wedge Pattern Breakout
#8 CNA Financial Corp. (NYSE: CNA)
Sector: Financial • Insurance – Property & Casualty
Reason: Symmetrical Triangle Pattern Breakout
A symmetrical triangle is a chart pattern formed by two converging trend lines connecting a series of sequential peaks and troughs. These two lines result in the formation of a triangle that appears to be symmetrical.
A symmetrical triangle pattern is usually formed when there is indecision in the price movements and there is uncertainty among the buyers and sellers. This chart pattern represents a period of consolidation before the price breaks out or breaks down. In case a breakout occurs from the upper trend line, it is a strong bullish indication as it signifies the start of a new bullish trend.
Buy Level(s): The stock has currently broken out of a symmetrical triangle pattern. However, the ideal buy level for CNA is if the stock closes above the immediate resistance level of $46.50. This is marked in the chart below as a green color dotted line.
Daily chart – CNA
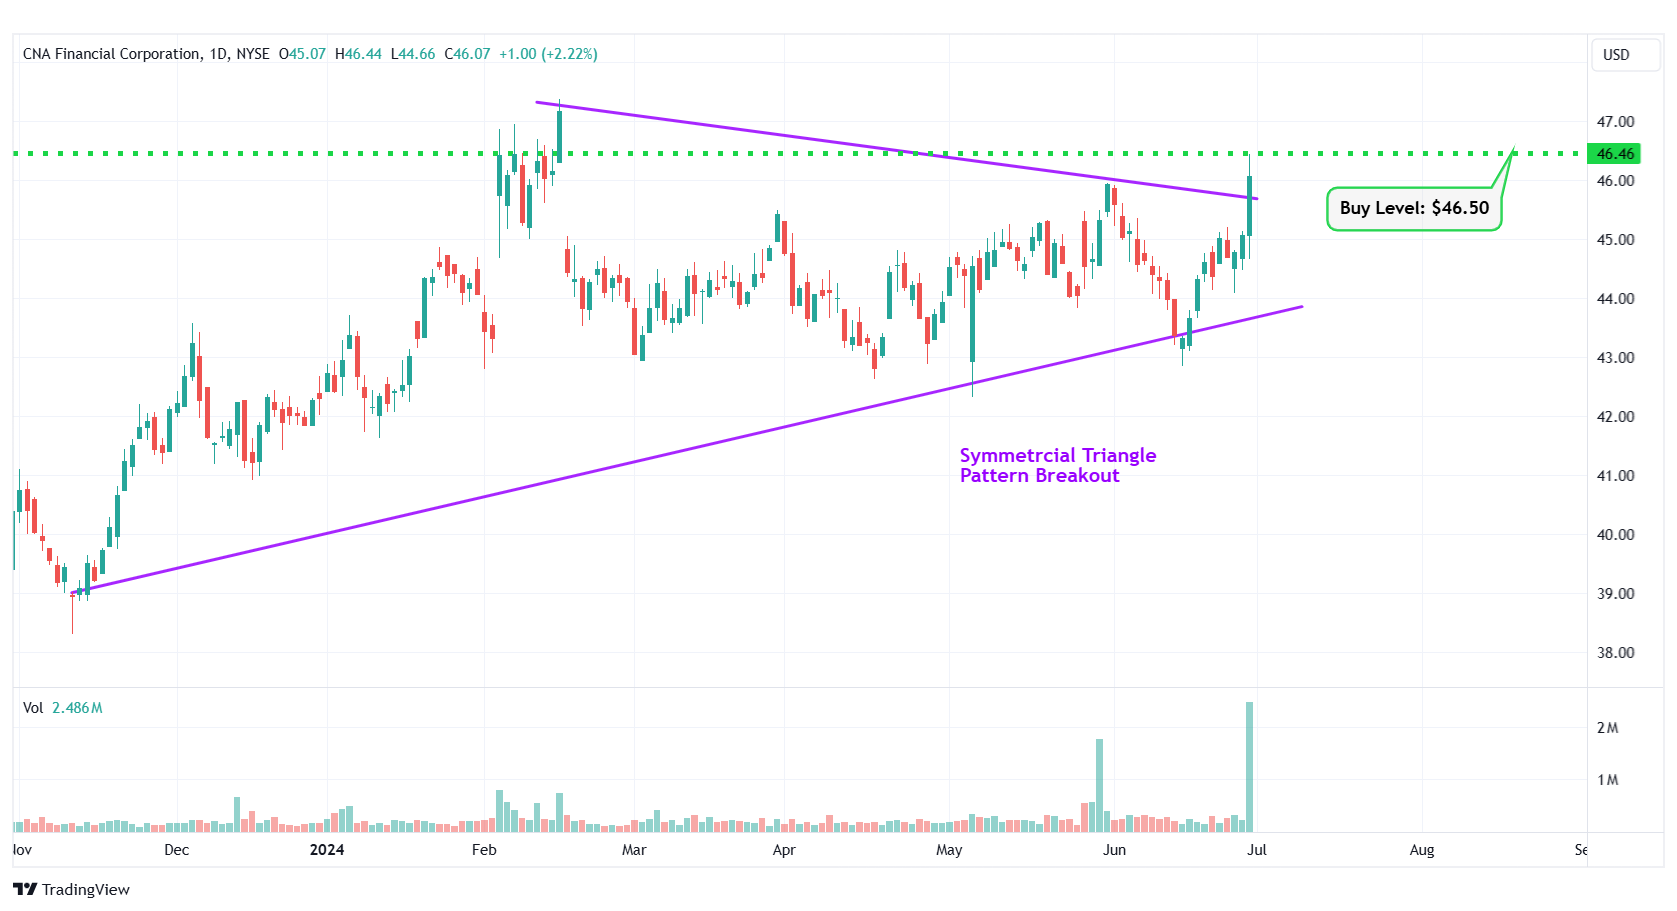
CNA – Symmetrcial Triangle Pattern Breakout
#9 Permian Resources Corp (NYSE: PR)
Sector: Energy • Oil & Gas E&P
Reason: Downtrend Channel Breakout
A downtrend or descending channel is the price action contained between downward sloping parallel lines. It is formed by two lines that are drawn by connecting the lower highs and lower lows of a stock’s price. Even though this is typically a bearish pattern, a breakout from the upper rail of this pattern is considered a good bullish indication.
Buy Level(s): The daily chart shows that the stock has currently broken out of a downtrend channel. However, there is a near-term resistance level for the stock. Hence, the ideal buy level for PR is if the stock has a daily close above $16.30. This is marked in the chart below as a green color dotted line.
Daily chart – PR
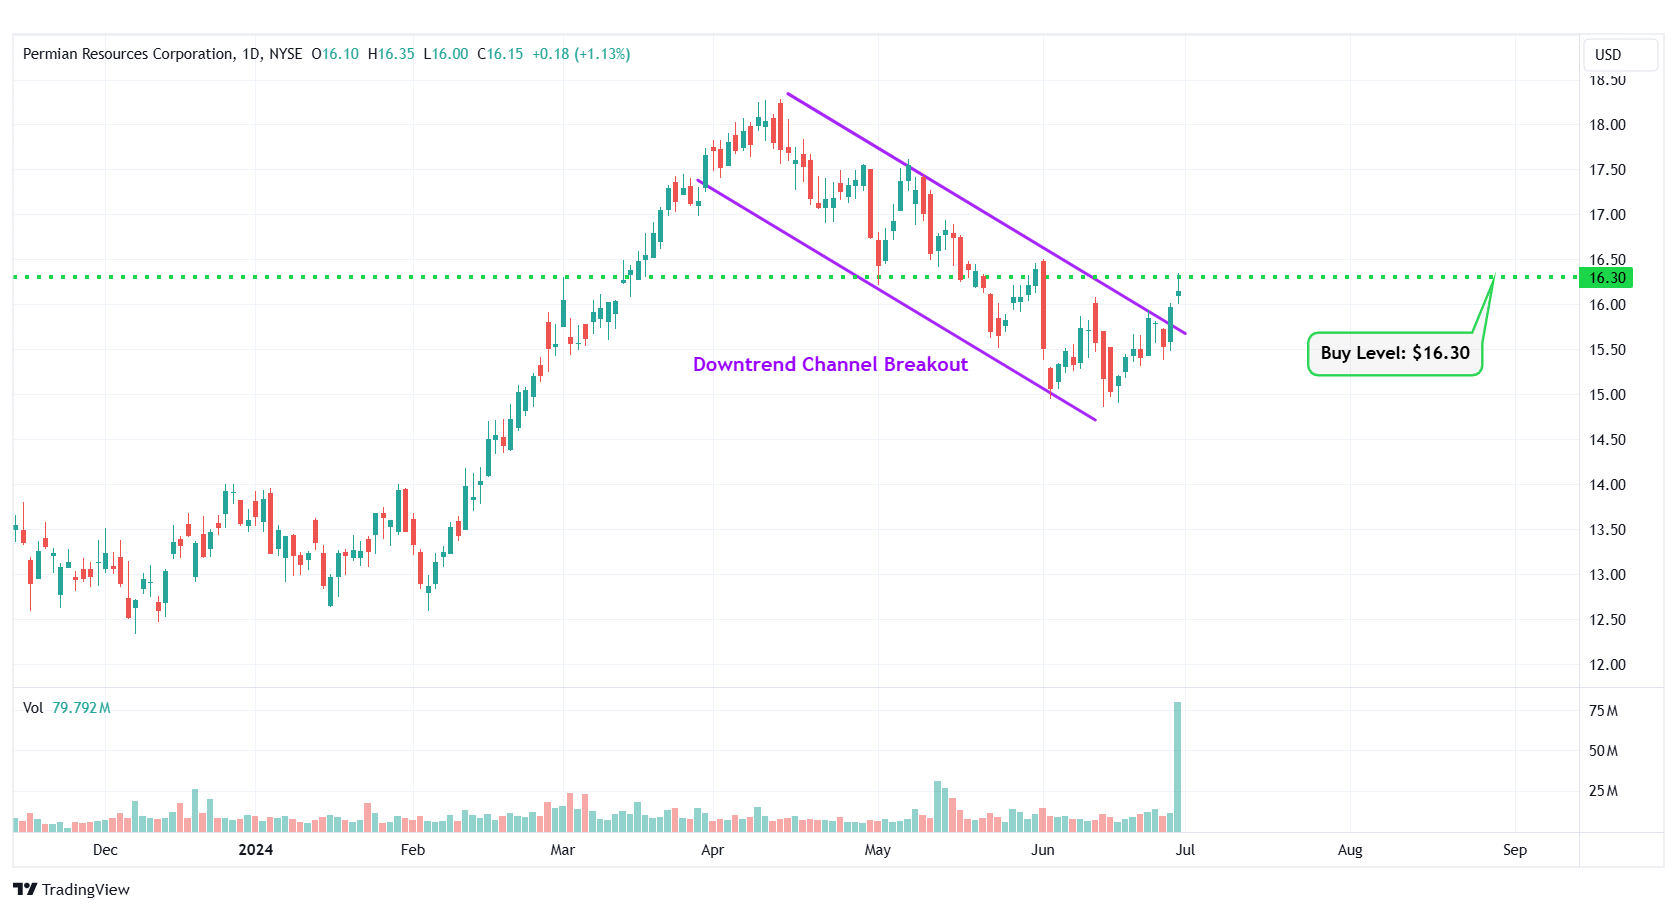
PR – Downtrend Channel Breakout
#10 Seadrill Ltd. (NYSE: SDRL)
Sector: Energy • Oil & Gas Drilling
Reason: Formation of a Symmetrical Triangle Pattern
A symmetrical triangle is a chart pattern formed by two converging trend lines connecting a series of sequential peaks and troughs. These two lines result in the formation of a triangle that appears to be symmetrical.
A symmetrical triangle pattern is usually formed when there is indecision in the price movements and there is uncertainty among the buyers and sellers. This chart pattern represents a period of consolidation before the price breaks out or breaks down. In case a breakout occurs from the upper trend line, it is a strong bullish indication as it signifies the start of a new bullish trend.
Buy Level(s): The ideal buy level for SDRL is if the stock has a daily close above the breakout level of the symmetrical triangle pattern, at around $52.00. This is marked in the chart below as a green color dotted line.
Daily chart – SDRL
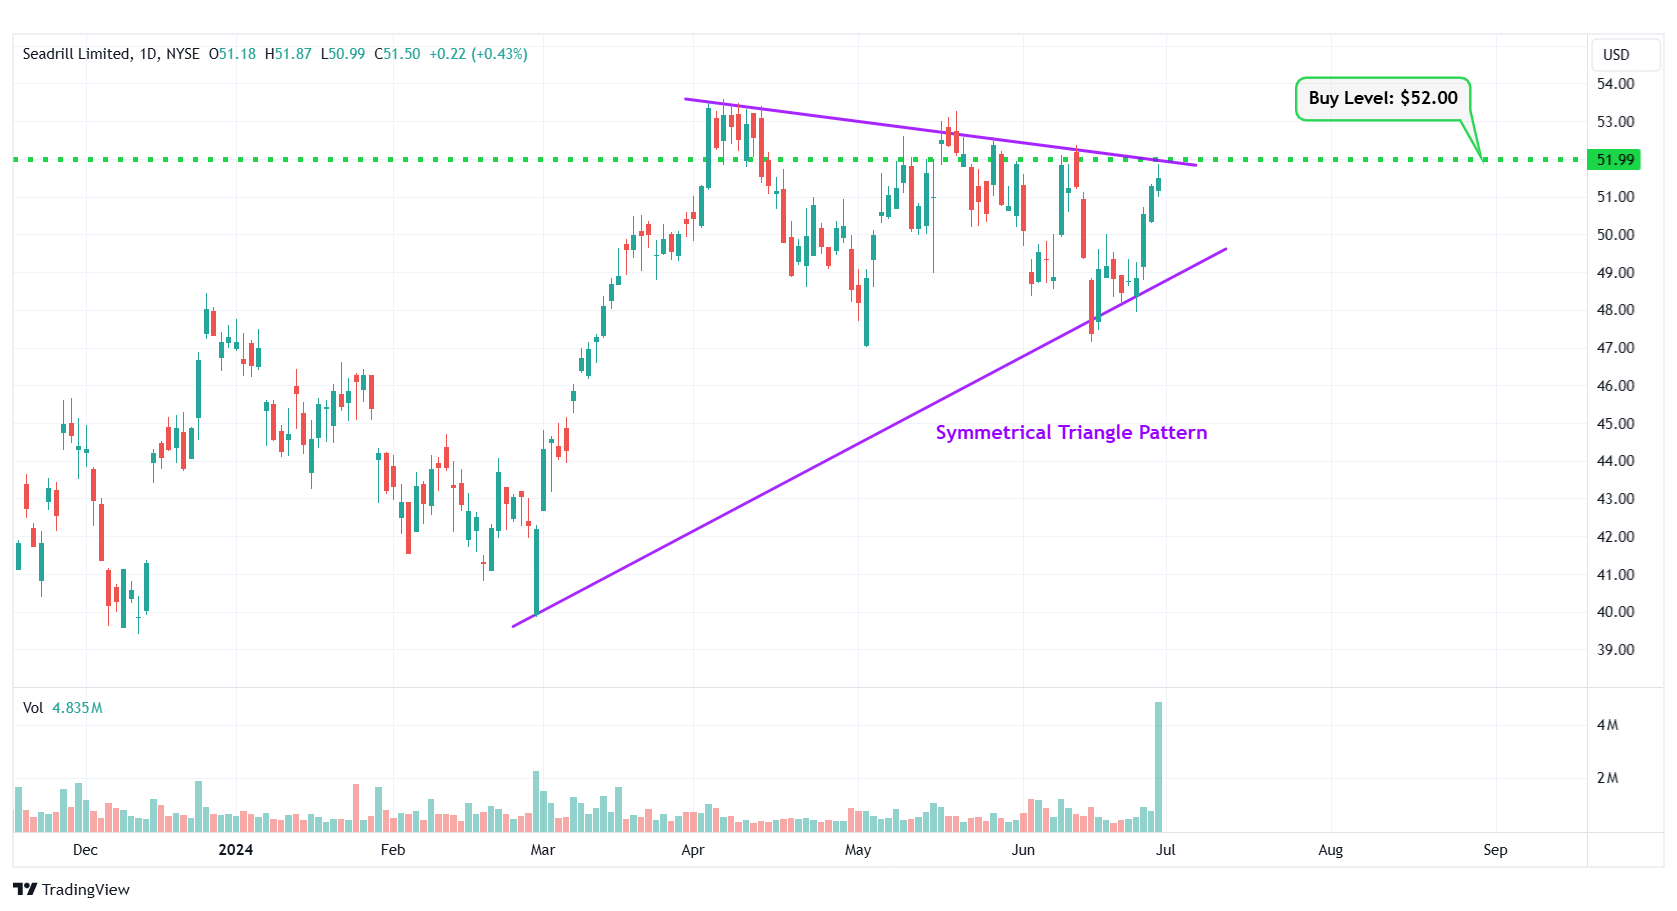
SDRL – Symmetrical Triangle Pattern
Happy Trading!
Trades of The Day Research Team
If you're buying rare earth or other critical mineral stocks, you're already one step behind - because we believe that political insiders in Washington are preparing to buy a whole new group of stocks, which could begin soaring 500%+ just days from now. The man once ranked in 2020 as America's #1 stock picker is doing something extraordinary and giving away the name and ticker of every single stock that could be next. Everything you need to know is here.
Source: Trades of the Day

