We recently started a series called “Penny Stock of the Day”. These ideas are geared towards traders with an extremely high risk appetite.
Our Penny Stock of the Day is chosen by screening for stocks under $5 and then applying technical analysis on the shortlisted set of penny stocks showing unusual volume. When making these trades, please make sure to pay vigilant attention to pricing moves and have a strict stop loss in place to avoid significant losses.
Penny Stock of the Day: Mesa Air Group, Inc. (NASDAQ: MESA)
Today’s penny stock pick is the airline company, Mesa Air Group, Inc. (NASDAQ: MESA).
Mesa Air Group, Inc. operates as the holding company for Mesa Airlines, Inc. which provides regional air carrier scheduled passenger services. The company offers scheduled flight and cargo services. As of September 30, 2023, it operated a fleet of 80 aircraft with approximately 296 daily departures to 86 cities in the United States and Mexico.
Website: https://www.mesa-air.com
Latest 10-k report: https://investor.mesa-air.com/static-files/44d69843-bc4f-4552-8d77-e49c2ff832e2
Analyst Consensus: Not covered by Wall Street analysts.
Potential Catalysts / Reasons for the Hype:
- The company reported positive results for the second quarter of 2024. Mesa Air Gr reported revenue of $131.58 million.
- MESA had also announced agreements with United Airlines Holdings, Inc.to amend its capacity purchase agreement and certain credit agreements between the companies.
On analyzing the company’s stock charts, there seem to be multiple bullish indications…
Bullish Indications
#1 Symmetrical Triangle Pattern Breakout: The daily chart shows that the stock has currently broken out a symmetrical triangle pattern, which is marked as purple color lines. A symmetrical triangle pattern represents a period of consolidation before the price breaks out. This is typically formed when there is indecision in the price movements and uncertainty among the buyers and sellers. Once a breakout from the upper trend line occurs, it usually signifies the start of a new bullish trend.
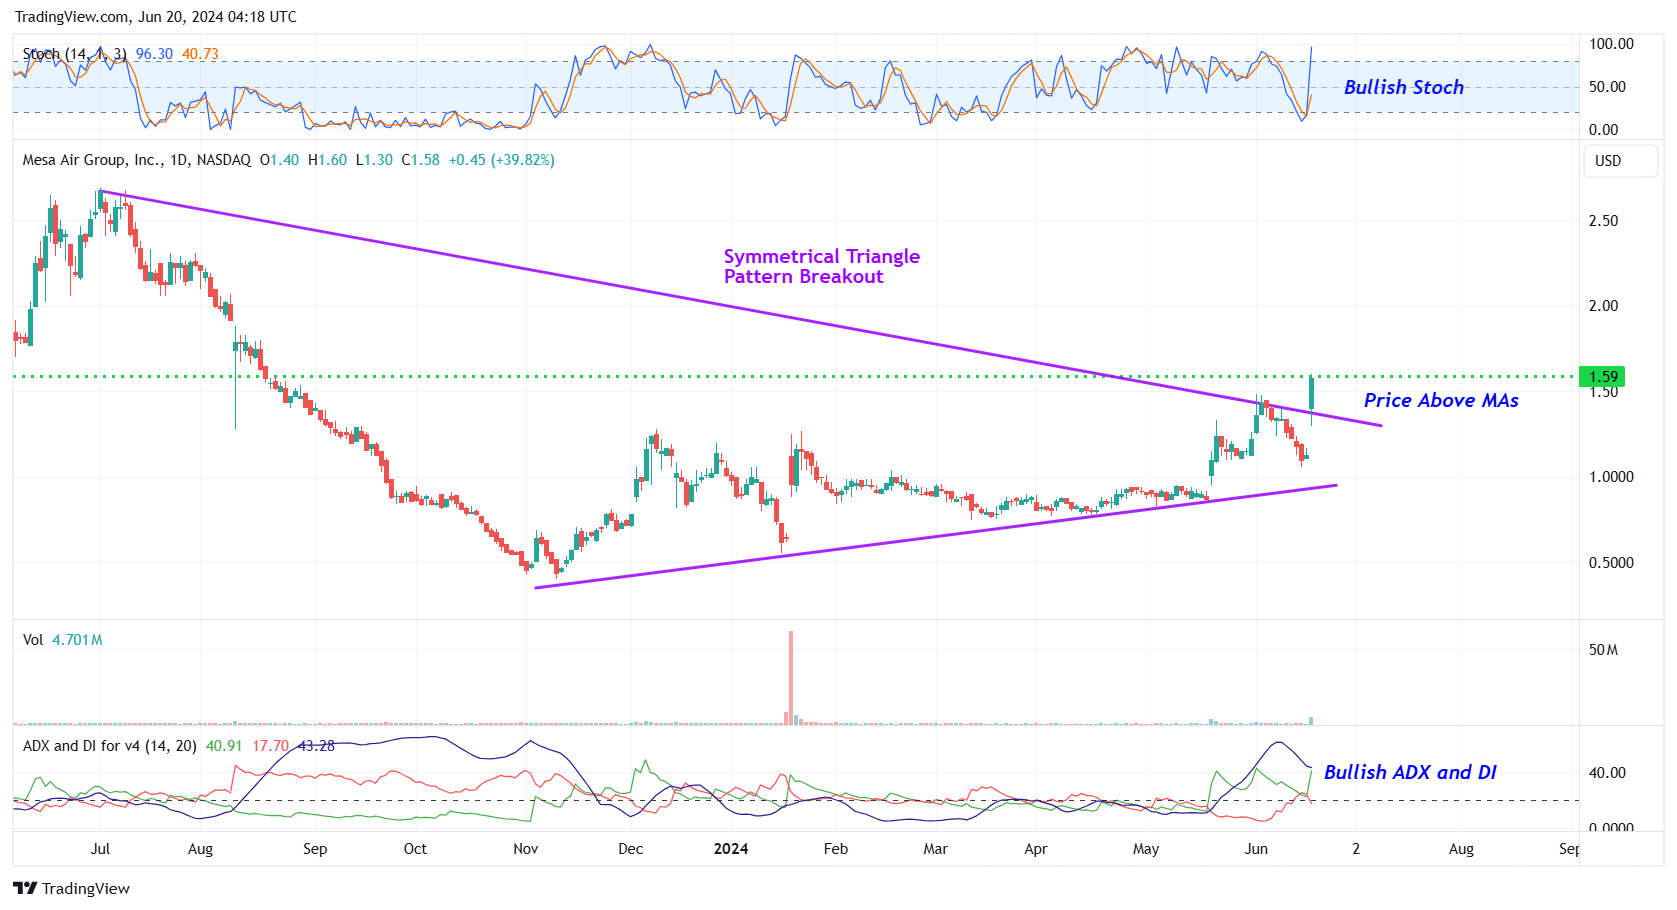
MESA – Daily Chart
#2 Bullish ADX and DI: The ADX indicator shows bullishness as the +DI line is above the -DI line, and the ADX line is currently moving higher from below the +DI and -DI lines.
#3 Price above MAs: The stock is currently above its 50-day as well as 200-day SMA, indicating that the bulls have currently gained control.
#4 Bullish Stoch: The %K line of the stochastic is above the %D line, and has also moved higher from oversold levels, indicating possible bullishness.
#5 Above Support Area: The weekly chart shows that the stock is currently trading above a support area, which is marked as a pink color dotted line. This looks like a good area for the stock to move higher. The stock is also trading above its 50-week SMA, indicating that the bulls are gaining control.
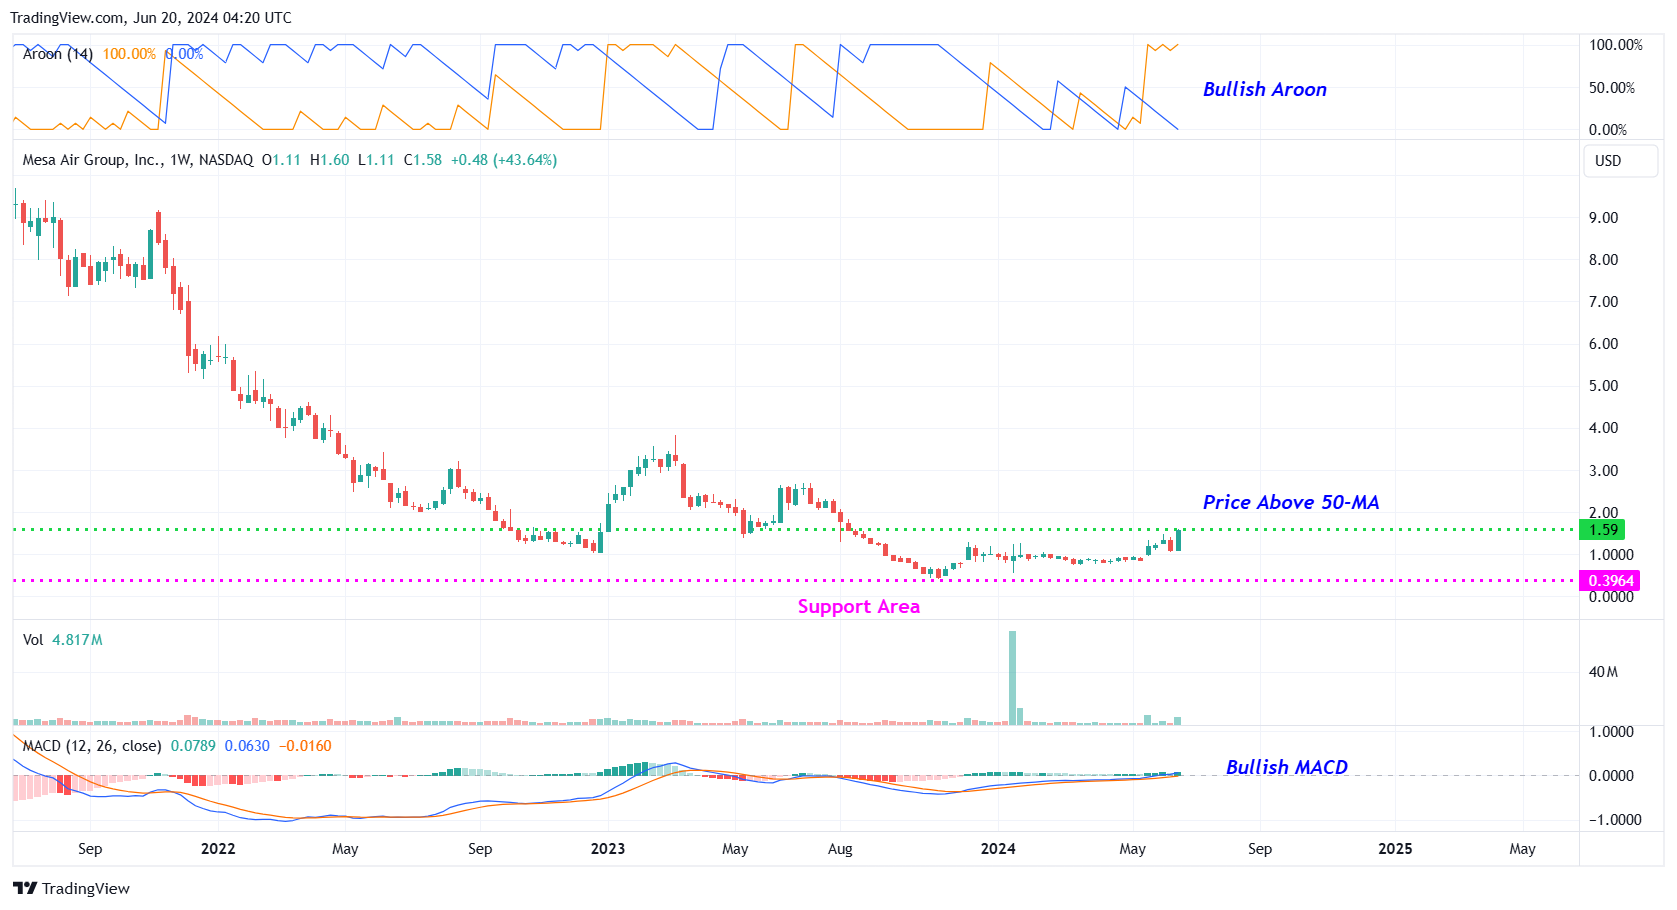
MESA – Weekly Chart
#6 Bullish Aroon: The value of Aroon Up (orange line) is above 70 while Aroon Down (blue line) is below 30. This indicates bullishness.
#7 MACD above Signal Line: In the weekly chart, the MACD (light blue color) is currently above the MACD signal line (orange color). This indicates a possible bullish setup.
Recommended Trade (based on the charts)
Buy Levels: If you want to get in on this trade, the ideal buy level for MESA is above the price of $1.60.
Target Prices: Our first target is $2.70. If it closes above that level, the second target price is $3.60.
Stop Loss: To limit risk, place a stop loss below $1.00. Note that the stop loss is on a closing basis.
Our target potential upside is 64% to 118%.
For a risk of $0.65, our first target reward is $1.05, and the second target reward is $1.95. This is a nearly 1:2 and 1:3 risk-reward trade.
In other words, this trade offers 2x to 3x more potential upside than downside.
Potential Risks / Red Flags:
- The company has a history of net losses. MESA reported a net loss of $120.1 million for the year ended September 30, 2023, and a net loss of $182.7 million for the year ended September 30, 2022.
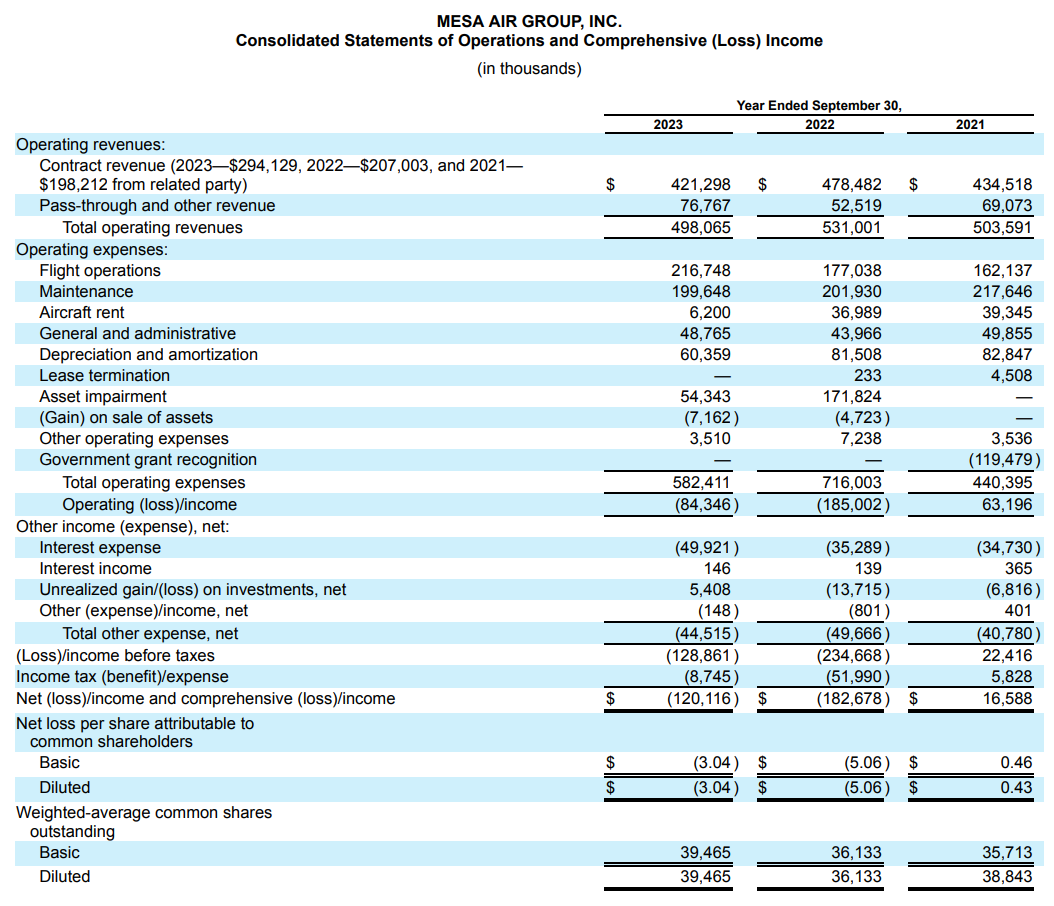
MESA – Consolidated Statements of Operations
- The company has customer concentration risk. MESA derives substantially all of its operating revenue from its CPA with United and previously with American. American accounted for approximately 23% and 45% of the company’s total revenue for the fiscal years ended September 30, 2023, and 2022, respectively. United accounted for approximately 73% and 48% of the total revenue for fiscal years ended September 30, 2023 and 2022, respectively.
- Hedge Funds Decreased Holdings by 536.6K Shares Last Quarter.
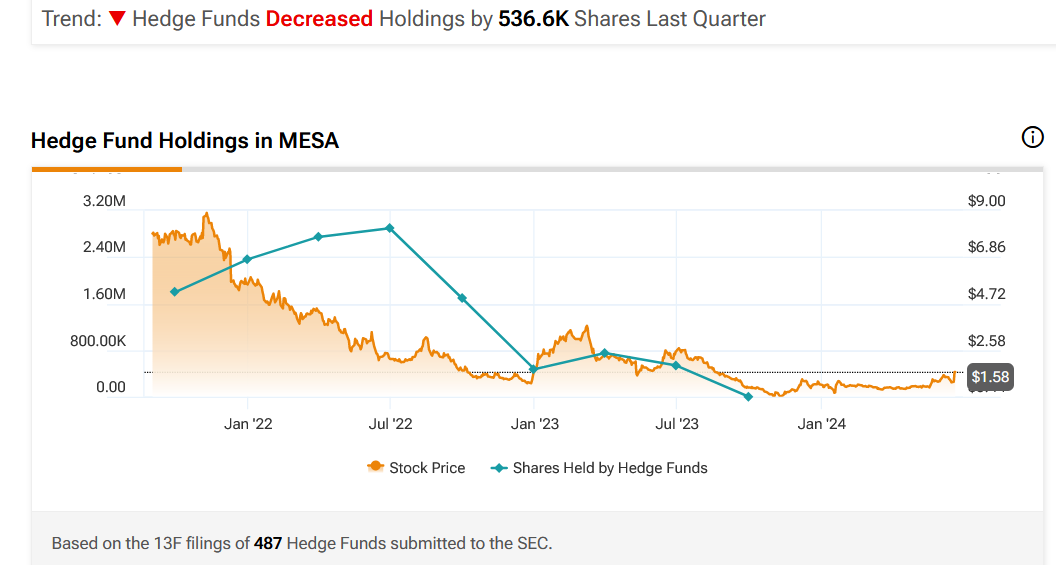
Hedge Funds | Source: TipRanks.com
- The airline business is a capital-intensive business. MESA is highly leveraged and has a significant amount of debt. The company’s total long-term principal balance is approximately $538.3 million.
- On November 3, 2023, MESA received a letter from the Listing Qualifications Staff of The Nasdaq Stock Market LLC indicating that, based upon the closing bid price of the common stock for the last 30 consecutive business days, the company no longer meet Nasdaq Listing Rule 5450(a)(1), which requires listed companies to maintain a minimum bid price of at least $1.00 per share.
- Despite being a loss-making company, the executives are being paid significant compensation.
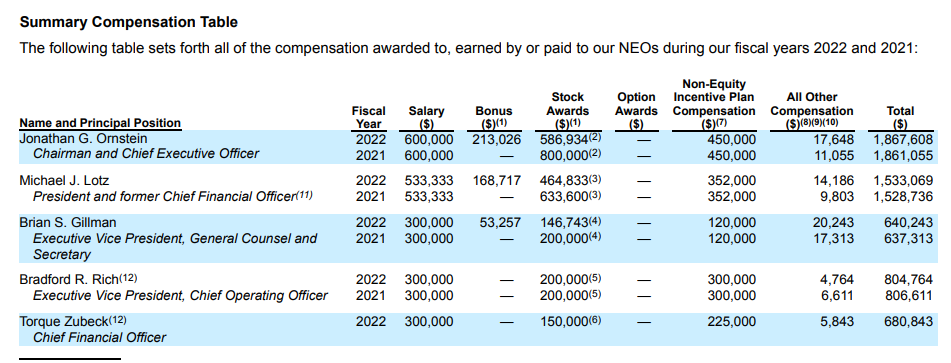
MESA – Executive Compensation
As you can see, today’s featured penny stock offers big upside potential… but it also comes with a number of risks and red flags. As always, when dealing with penny stocks, we advise caution before entering into such high-risk ventures. Remember to think before you trade… understand the risks… and if you decide to trade, stick to your stop-losses!
Happy Trading!
Trades of the Day Research Team
READ BEFORE TRADING PENNY STOCKS: The allure of penny stocks lies in their potential to deliver massive gains in a short period of time. However, in exchange for that opportunity, most penny stocks carry tremendous risk. They can be extremely volatile and are susceptible to “pump and dump” schemes and fraud.
Unlike regular stocks, the financial condition of most penny stock companies can be extremely difficult to analyze, as the majority of such stocks are traded on over-the-counter (OTC) exchanges, which are typically less transparent and less regulated than the major exchanges. In fact, in the penny stock space, it’s often easier to spot warning signs and red flags than it is to identify a sound investment. Nevertheless, we do our best to identify short-term trade opportunities in this exciting space because we know some of our readers are looking for high-risk, high-reward ideas. We just urge you to make sure you fully understand the risks before making any of these trades.
To carry out Trump's Executive Order #14196 initiative, the administration will have to partner with a handful of U.S. companies that control the "reserve accounts" sitting on trillions of dollars' worth of untapped natural resources. I've spent months digging into this – and I've identified three companies that have already been granted "emergency status" and fast-track approvals. I believe their shares could skyrocket once new capital starts moving into the sector. See the three stocks that I expect to be the biggest winners as this plan rolls.
Source: Trades of the Day

