Picking a winning trade on a consistent basis is not simply a stroke of luck. It’s the result of calculated screening, planning, and deliberation.
With this in mind, we have started a new weekly series on our top 10 stocks to watch this week — stocks that look poised for a possible breakout in the coming days. Traders should add these stocks to their watchlist now.
The Top 10 Stocks to Watch This Week for Possible Breakouts
| Sl # | Name of the Stock | Stock Ticker | Last Close | Buy Level(s) | Reason |
| 1 | Catalent Inc. | NYSE: CTLT | $56.39 | $58.80 | Symmetrical Triangle Pattern Breakout |
| 2 | Toro Co. | NYSE: TTC | $95.98 | $96.80 | Downtrend Channel Breakout |
| 3 | CVS Health Corp | NYSE: CVS | $61.78 | $63.00 | Falling Wedge Pattern Breakout |
| 4 | ODDITY Tech Ltd. | NASDAQ: ODD | $44.31 | $46.00 | Symmetrical Triangle Pattern |
| 5 | Incyte Corp. | NASDAQ: INCY | $59.16 | $59.70 | Downtrend Channel Breakout |
| 6 | Crowdstrike Holdings Inc. | NASDAQ: CRWD | $349.12 | $356.60 | Ascending Triangle Pattern |
| 7 | Nike, Inc. | NYSE: NKE | $96.55 | $97.80 | Falling Wedge Pattern Breakout |
| 8 | WalkMe Ltd | NASDAQ: WKME | $13.78 | $14.00 | Symmetrical Triangle Pattern Breakout |
| 9 | PowerSchool Holdings Inc. | NYSE: PWSC | $22.46 | $22.80 | Falling Wedge Pattern Breakout |
| 10 | Honeywell International Inc. | NASDAQ: HON | $208.78 | $210.10 | Symmetrical Triangle Pattern Breakout |
Important: Typically, these trades offer a risk: reward ratio of 1:2 or 1:3 in the next 6 months, which implies 2x to 3x rewards when compared to risks. So, be sure to set your stop-loss levels and target prices accordingly to manage your risk. In addition, these trade ideas are triggered using daily closing prices, not intra-day pricing. So, if you participate in these trades, make sure that you only buy the stock once its daily close is above the recommended price level.
That said, here are the top 10 stocks to watch for a breakout, in no particular order.
#1 Catalent Inc. (NYSE: CTLT)
Sector: Healthcare • Drug Manufacturers – Specialty & Generic
Reason: Symmetrical Triangle Pattern Breakout
A symmetrical triangle is a chart pattern formed by two converging trend lines connecting a series of sequential peaks and troughs. These two lines result in the formation of a triangle that appears to be symmetrical.
A symmetrical triangle pattern is usually formed when there is indecision in the price movements and there is uncertainty among the buyers and sellers. This chart pattern represents a period of consolidation before the price breaks out or breaks down. In case a breakout occurs from the upper trend line, it is a strong bullish indication as it signifies the start of a new bullish trend.
Buy Level(s): The stock has currently broken out of a symmetrical triangle pattern. However, the ideal buy level for CTLT is if the stock closes above the immediate resistance level of $58.80. This is marked in the chart below as a green color dotted line.
Daily chart – CTLT
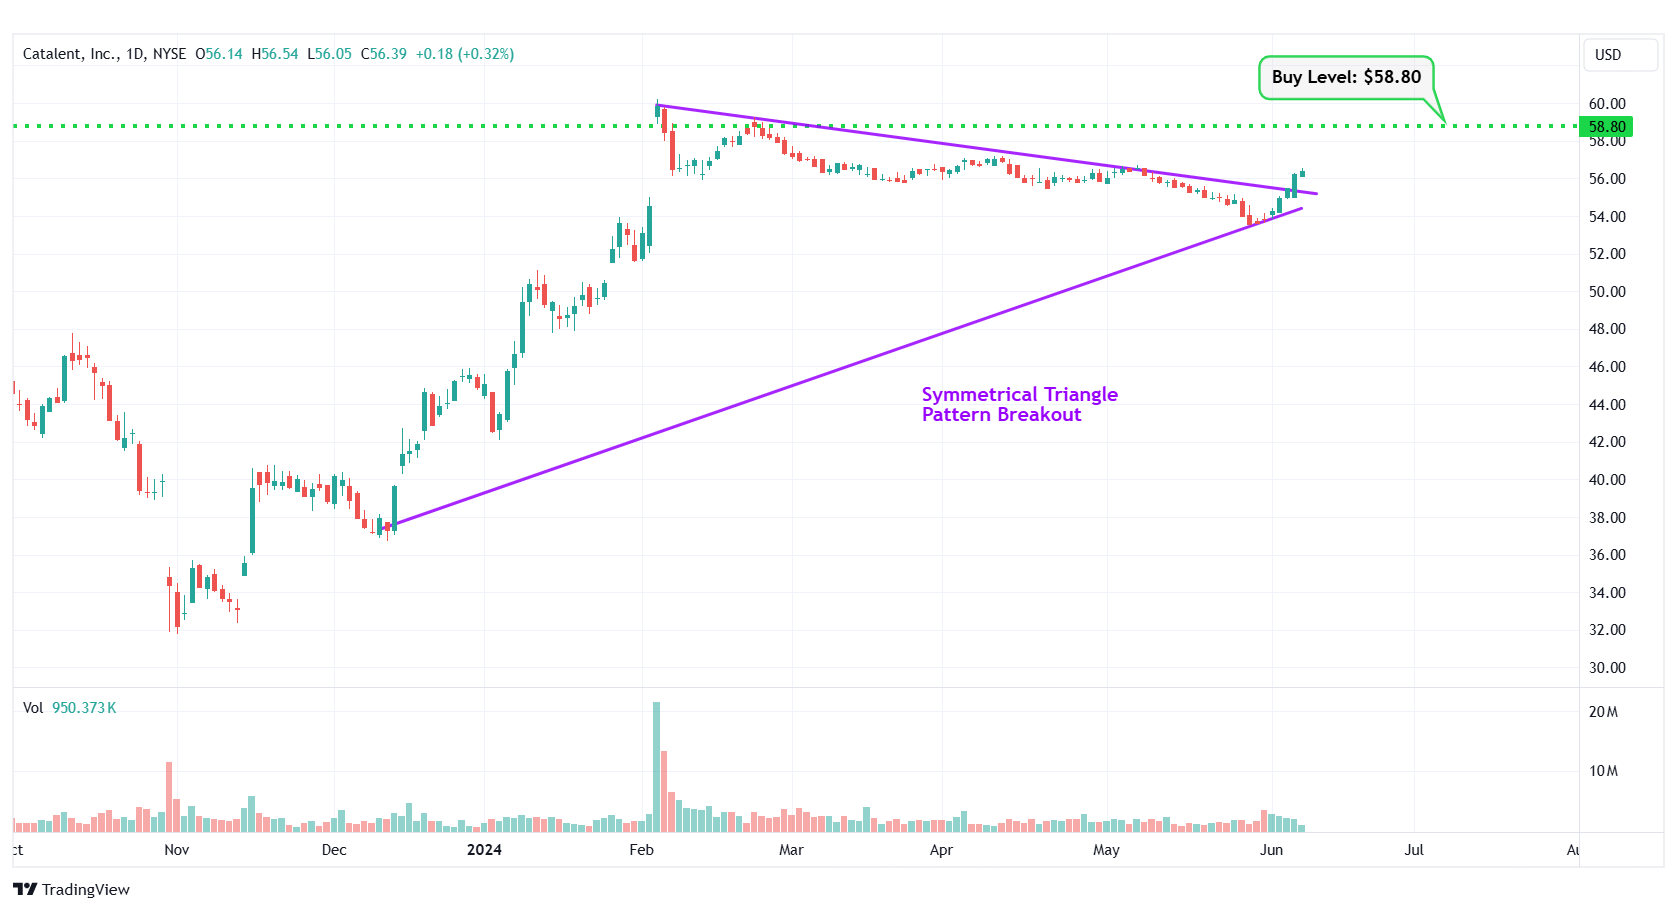
CTLT – Symmetrical Triangle Pattern Breakout
#2 Toro Co. (NYSE: TTC)
Sector: Industrials • Tools & Accessories
Reason: Downtrend Channel Breakout
A downtrend or descending channel is the price action contained between downward sloping parallel lines. It is formed by two lines that are drawn by connecting the lower highs and lower lows of a stock’s price. Even though this is typically a bearish pattern, a breakout from the upper rail of this pattern is considered a good bullish indication.
Buy Level(s): The daily chart shows that the stock has currently broken out of a downtrend channel. However, there is a near-term resistance level for the stock. Hence, the ideal buy level for TTC is if the stock has a daily close above $96.80. This is marked in the chart below as a green color dotted line.
Daily chart – TTC
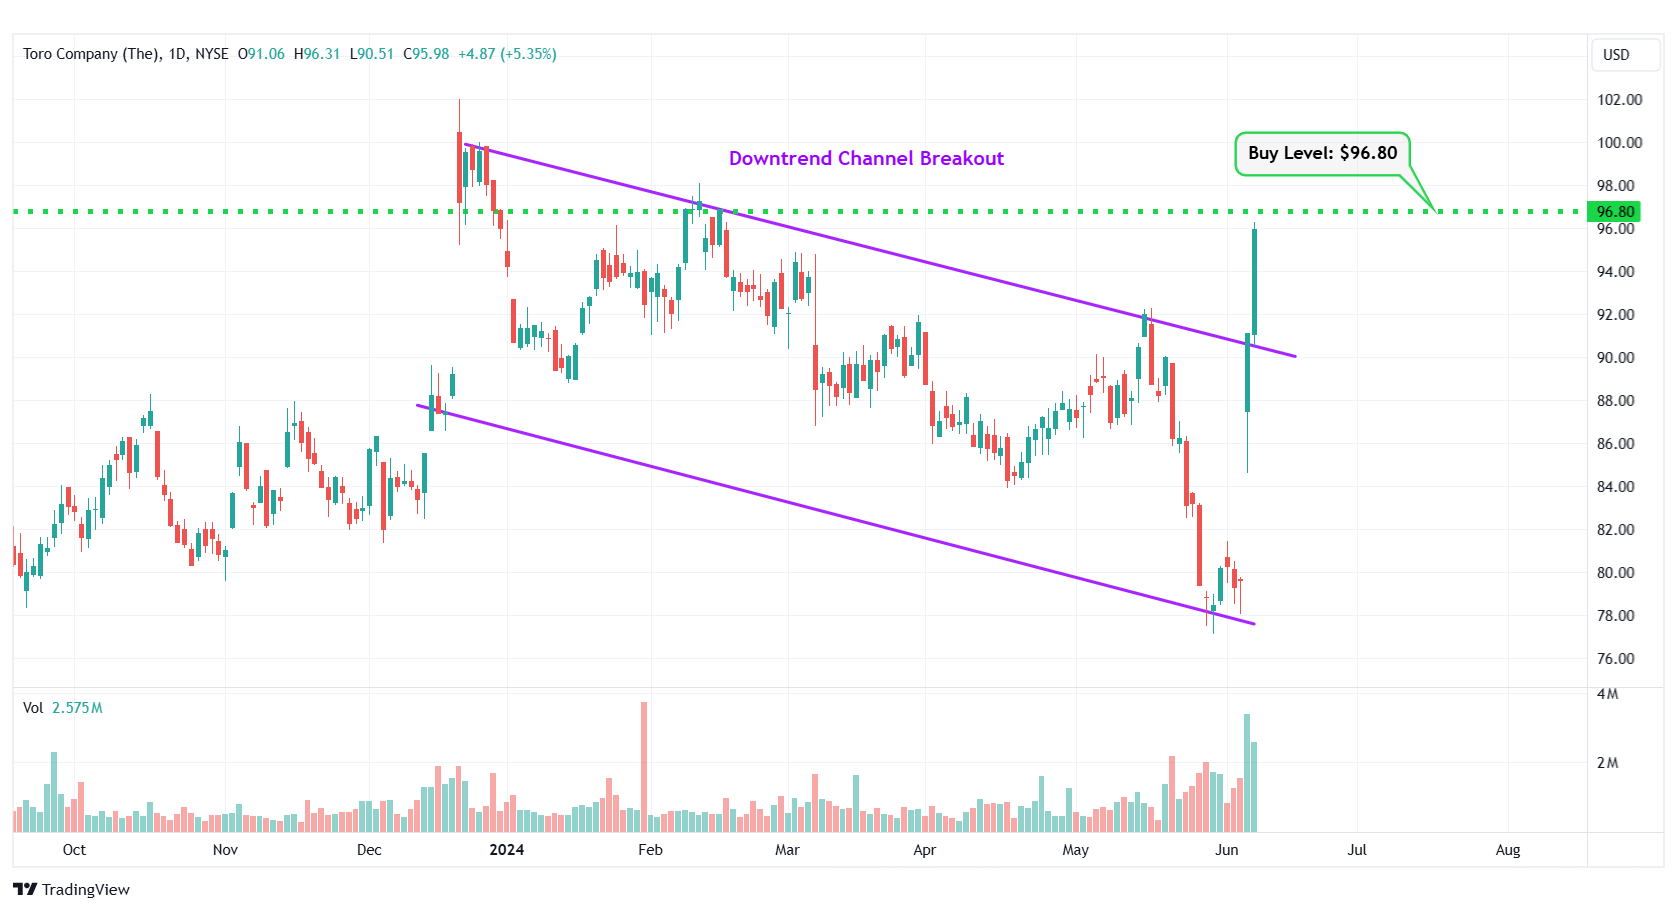
TTC – Downtrend Channel Breakout
#3 CVS Health Corp (NYSE: CVS)
Sector: Healthcare • Healthcare Plans
Reason: Falling Wedge Pattern Breakout
A falling wedge pattern is formed by joining two downward-sloping, converging trendlines having a contracting range. The pattern appears to be wide at the top and continues to contract as prices fall. A breakout from a falling wedge pattern can indicate either reversal or continuation depending on where the pattern appeared in the trend.
A stock that has broken out of a falling wedge pattern would have gained momentum and would have the potential to move higher.
Buy Level(s): The stock has currently broken out of a falling wedge pattern. However, the ideal buy level for CVS is above the nearest resistance level of $63.00. This is marked in the chart below as a green color dotted line.
Daily chart – CVS
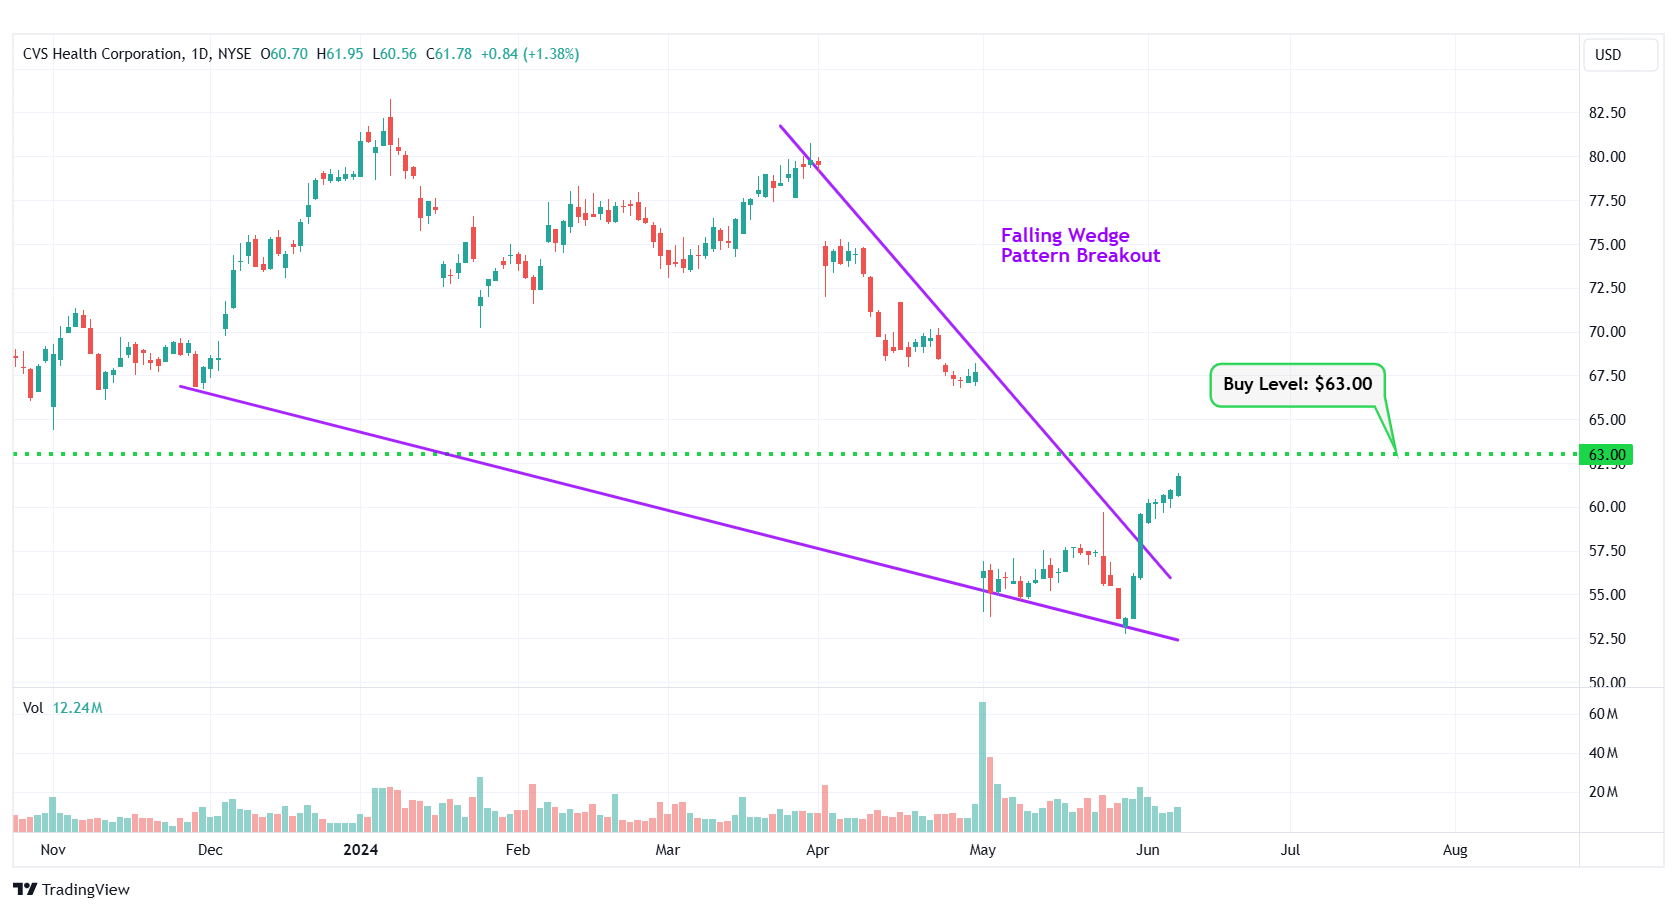
CVS – Falling Wedge Pattern Breakout
#4 ODDITY Tech Ltd. (NASDAQ: ODD)
Sector: Technology • Software – Infrastructure
Reason: Formation of a Symmetrical Triangle Pattern
A symmetrical triangle is a chart pattern formed by two converging trend lines connecting a series of sequential peaks and troughs. These two lines result in the formation of a triangle that appears to be symmetrical.
A symmetrical triangle pattern is usually formed when there is indecision in the price movements and there is uncertainty among the buyers and sellers. This chart pattern represents a period of consolidation before the price breaks out or breaks down. In case a breakout occurs from the upper trend line, it is a strong bullish indication as it signifies the start of a new bullish trend.
Buy Level(s): The ideal buy level for ODD is if the stock has a daily close above the breakout level of the symmetrical triangle pattern, at around $46.00. This is marked in the chart below as a green color dotted line.
Daily chart – ODD
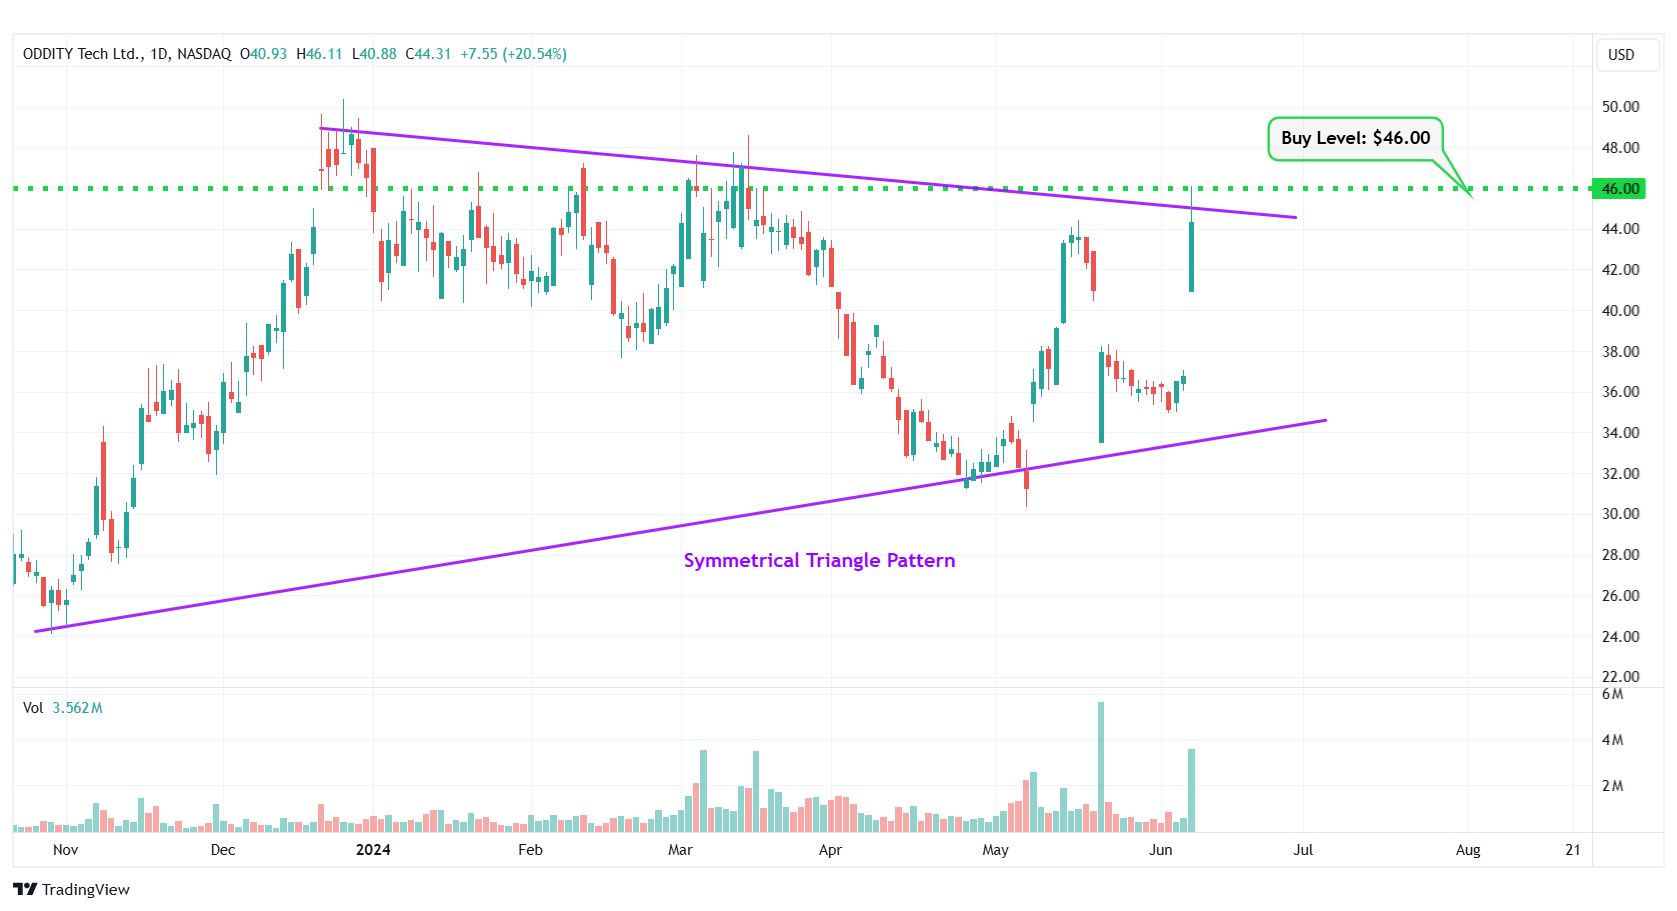
ODD – Symmetrical Triangle Pattern
#5 Incyte Corp. (NASDAQ: INCY)
Sector: Healthcare • Biotechnology
Reason: Downtrend Channel Breakout
A downtrend or descending channel is the price action contained between downward sloping parallel lines. It is formed by two lines that are drawn by connecting the lower highs and lower lows of a stock’s price. Even though this is typically a bearish pattern, a breakout from the upper rail of this pattern is considered a good bullish indication.
Buy Level(s): The daily chart shows that the stock has currently broken out of a downtrend channel. However, there is a near-term resistance level for the stock. Hence, the ideal buy level for INCY is if the stock has a daily close above $59.70. This is marked in the chart below as a green color dotted line.
Daily chart – INCY
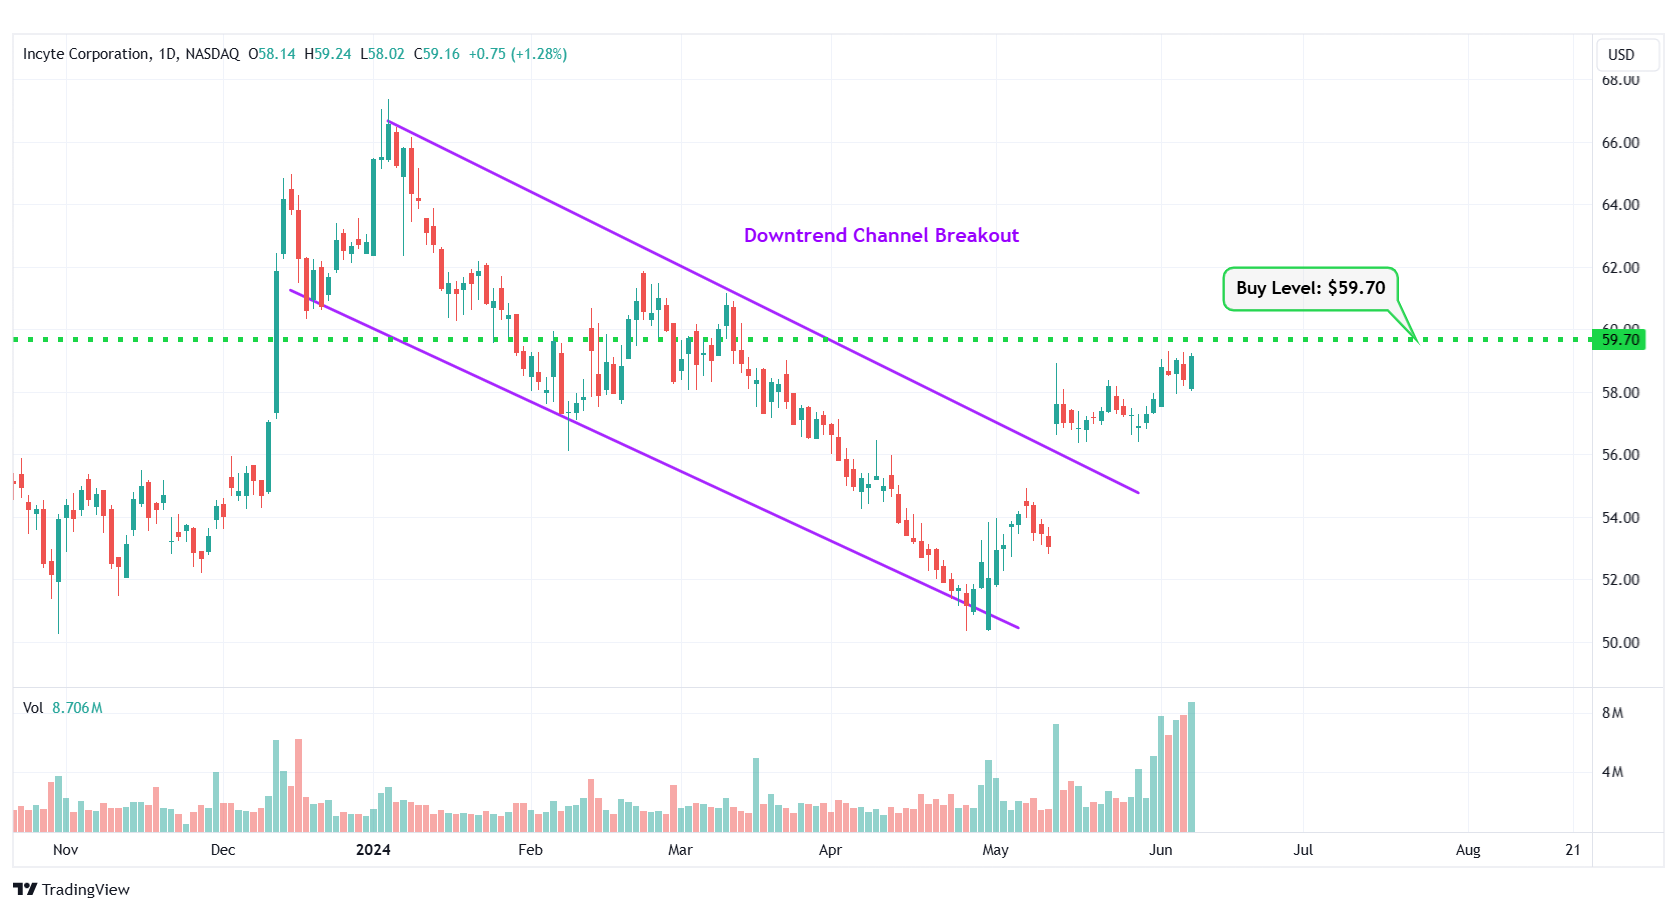
INCY – Downtrend Channel Breakout
#6 Crowdstrike Holdings Inc. (NASDAQ: CRWD)
Sector: Technology • Software – Infrastructure
Reason: Formation of an Ascending Triangle Pattern
An ascending triangle pattern is a bullish pattern formed by drawing a horizontal line along the swing highs, and a rising trendline along the swing lows. These two lines result in the formation of a triangle. A breakout from this pattern is typically a strong bullish indication.
Buy Level(s): The ideal buy level for CRWD is if the stock breaks out of the ascending triangle pattern and has a daily close above the near-term resistance level of $356.60. This is marked in the chart below as a green color dotted line.
Daily chart – CRWD
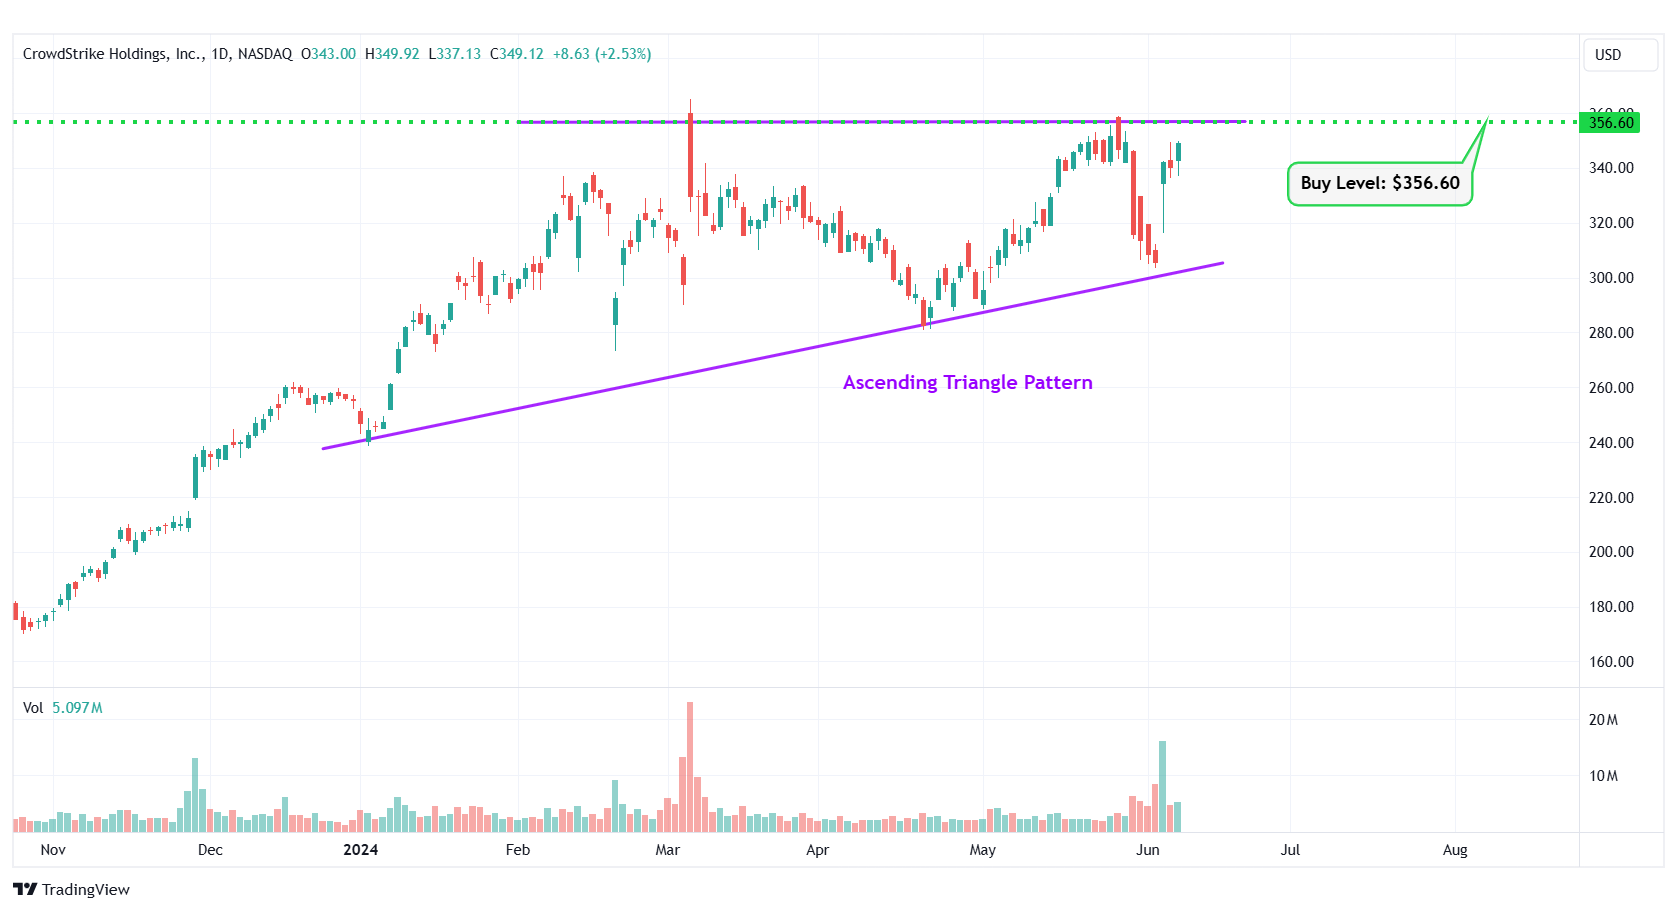
CRWD – Ascending Triangle Pattern
#7 Nike, Inc. (NYSE: NKE)
Sector: Consumer Cyclical • Footwear & Accessories
Reason: Falling Wedge Pattern Breakout
A falling wedge pattern is formed by joining two downward-sloping, converging trendlines having a contracting range. The pattern appears to be wide at the top and continues to contract as prices fall. A breakout from a falling wedge pattern can indicate either reversal or continuation depending on where the pattern appeared in the trend.
A stock that has broken out of a falling wedge pattern would have gained momentum and would have the potential to move higher.
Buy Level(s): The stock has currently broken out of a falling wedge pattern. However, the ideal buy level for NKE is above the nearest resistance level of $97.80. This is marked in the chart below as a green color dotted line.
Daily chart – NKE
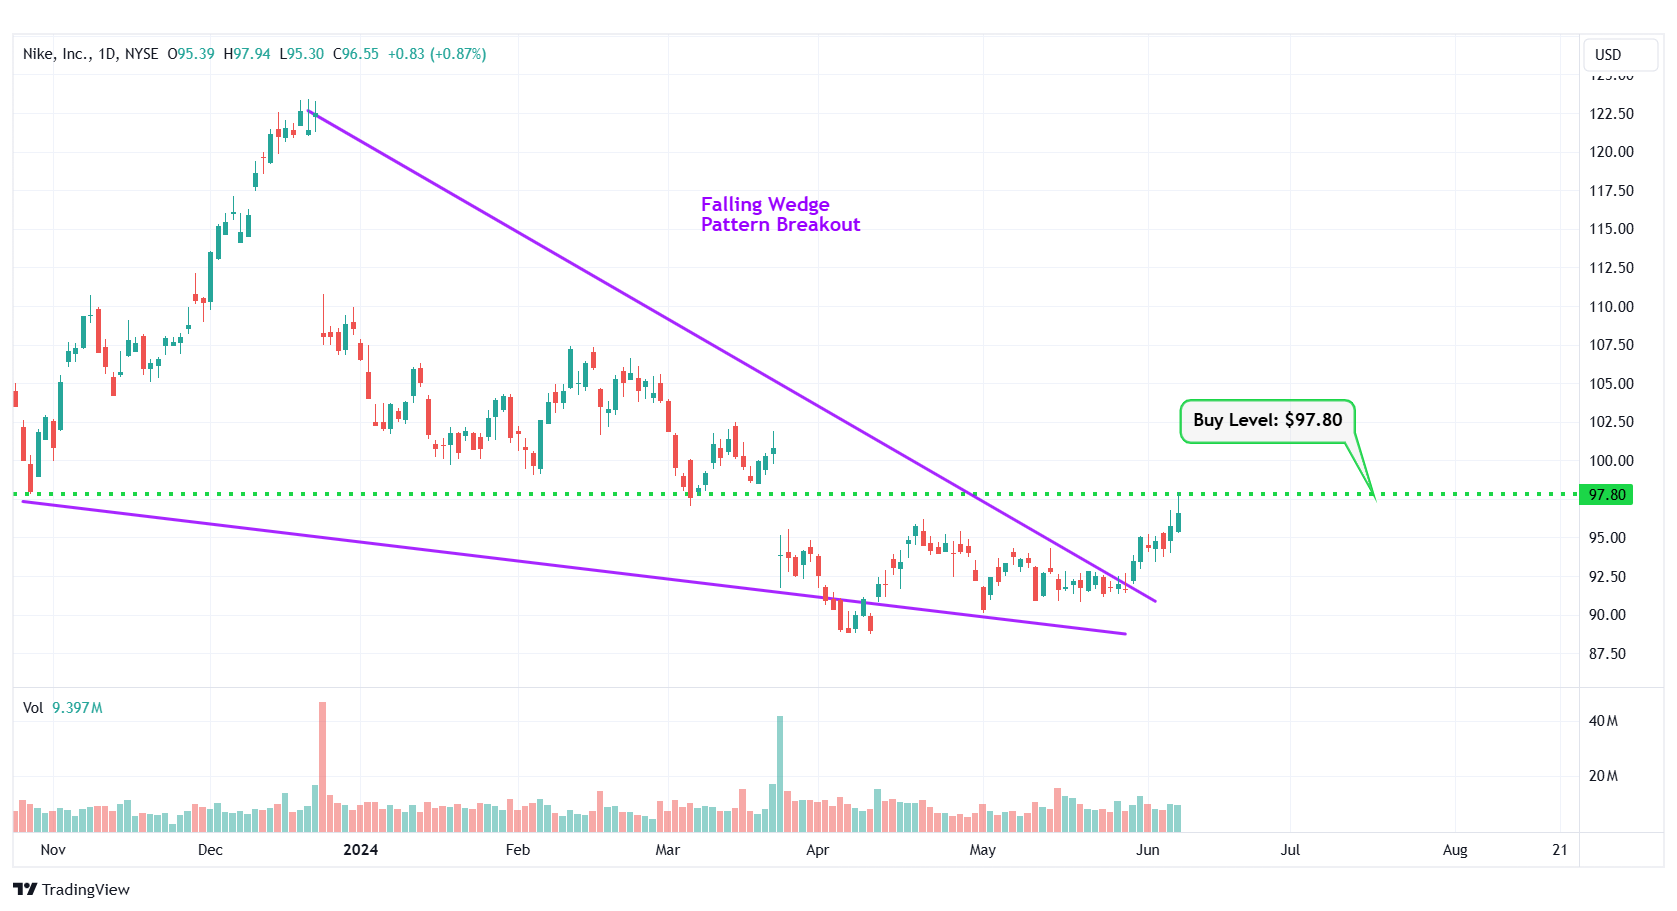
NKE – Falling Wedge Pattern Breakout
#8 WalkMe Ltd (NASDAQ: WKME)
Sector: Technology • Software – Application
Reason: Symmetrical Triangle Pattern Breakout
A symmetrical triangle is a chart pattern formed by two converging trend lines connecting a series of sequential peaks and troughs. These two lines result in the formation of a triangle that appears to be symmetrical.
A symmetrical triangle pattern is usually formed when there is indecision in the price movements and there is uncertainty among the buyers and sellers. This chart pattern represents a period of consolidation before the price breaks out or breaks down. In case a breakout occurs from the upper trend line, it is a strong bullish indication as it signifies the start of a new bullish trend.
Buy Level(s): The stock has currently broken out of a symmetrical triangle pattern. However, the ideal buy level for WKME is if the stock closes above the immediate resistance level of $14.00. This is marked in the chart below as a green color dotted line.
Daily chart – WKME
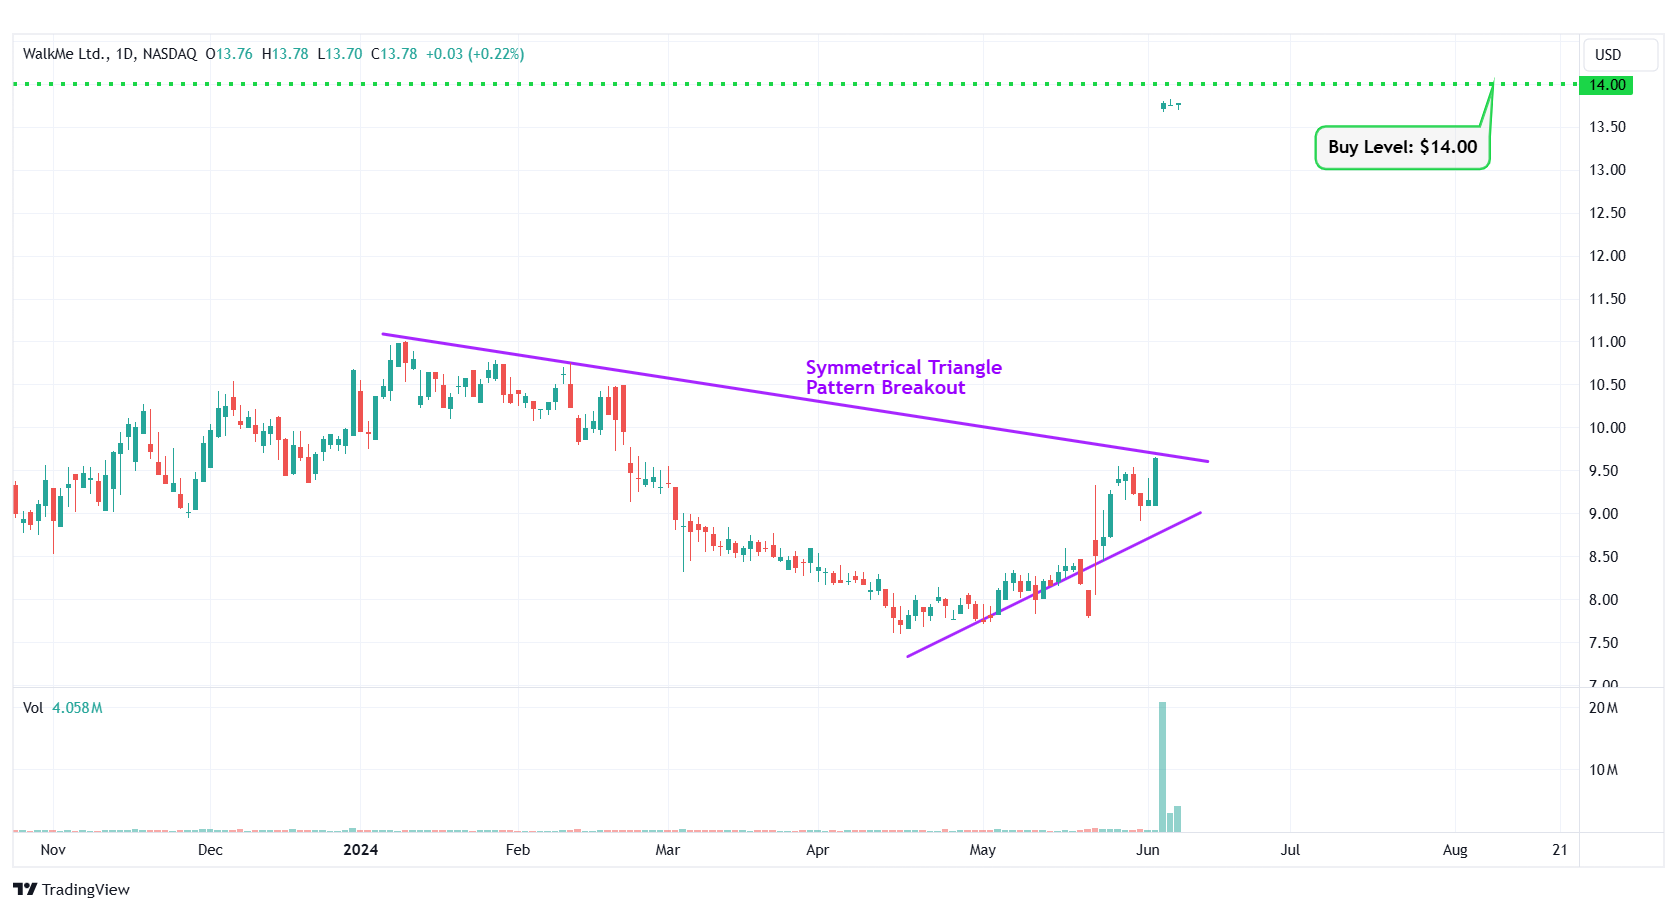
WKME – Symmetrical Triangle Pattern Breakout
#9 PowerSchool Holdings Inc. (NYSE: PWSC)
Sector: Technology • Software – Application
Reason: Falling Wedge Pattern Breakout
A falling wedge pattern is formed by joining two downward-sloping, converging trendlines having a contracting range. The pattern appears to be wide at the top and continues to contract as prices fall. A breakout from a falling wedge pattern can indicate either reversal or continuation depending on where the pattern appeared in the trend.
A stock that has broken out of a falling wedge pattern would have gained momentum and would have the potential to move higher.
Buy Level(s): The stock has currently broken out of a falling wedge pattern. However, the ideal buy level for PWSC is above the nearest resistance level of $22.80. This is marked in the chart below as a green color dotted line.
Daily chart – PWSC
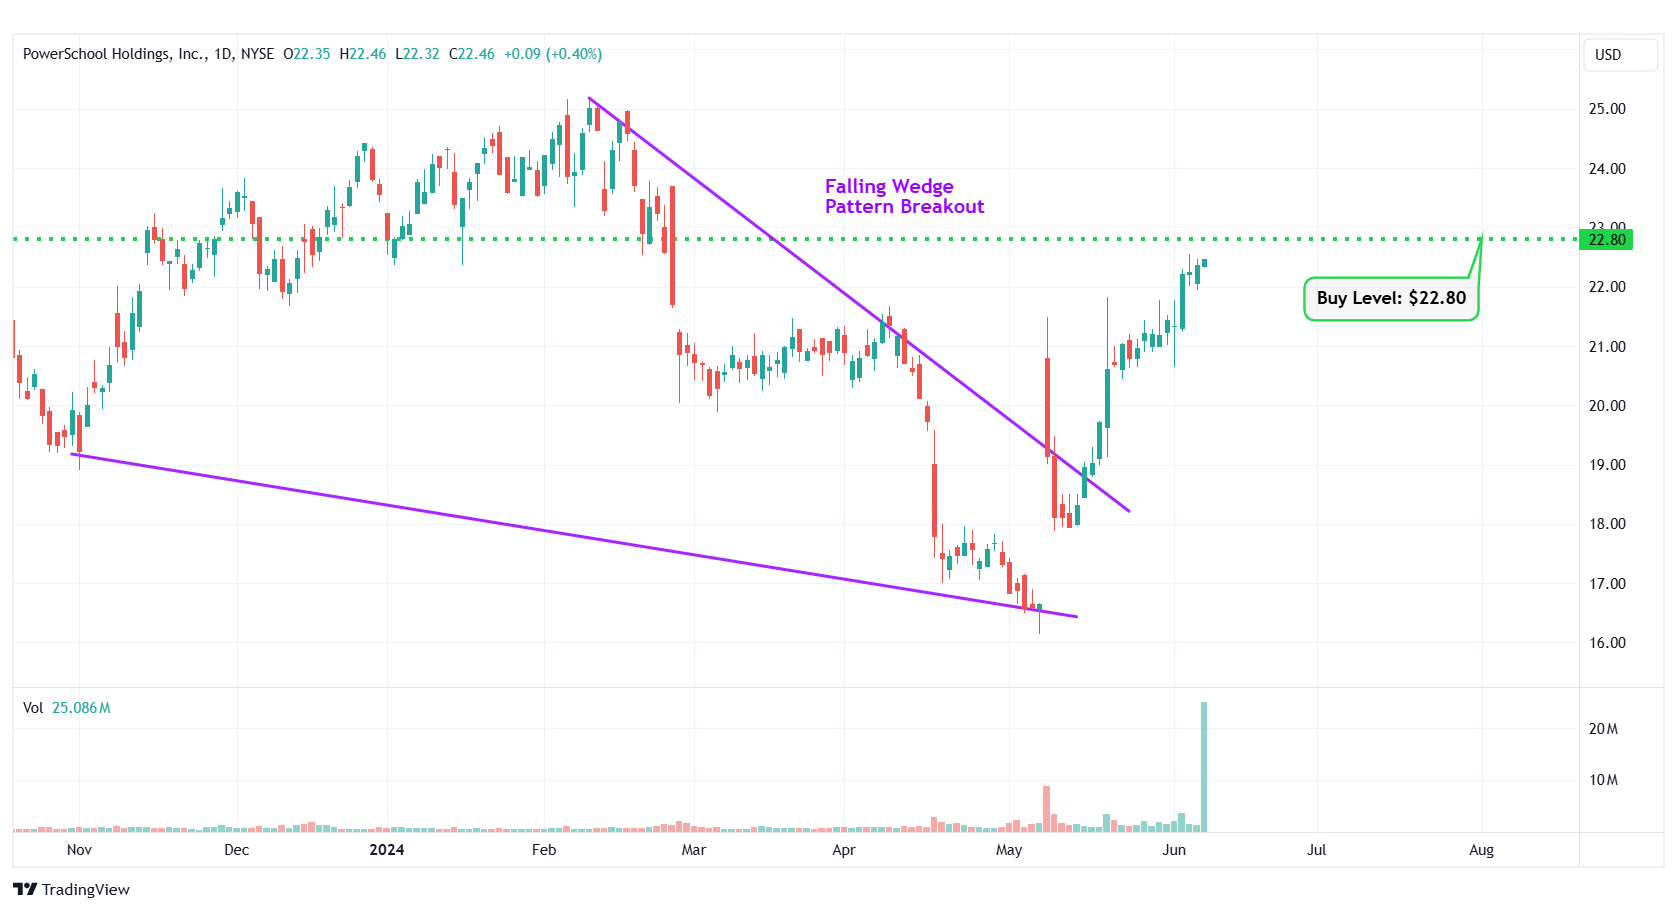
PWSC – Falling Wedge Pattern Breakout
#10 Honeywell International Inc. (NASDAQ: HON)
Sector: Industrials • Conglomerates
Reason: Symmetrical Triangle Pattern Breakout
A symmetrical triangle is a chart pattern formed by two converging trend lines connecting a series of sequential peaks and troughs. These two lines result in the formation of a triangle that appears to be symmetrical.
A symmetrical triangle pattern is usually formed when there is indecision in the price movements and there is uncertainty among the buyers and sellers. This chart pattern represents a period of consolidation before the price breaks out or breaks down. In case a breakout occurs from the upper trend line, it is a strong bullish indication as it signifies the start of a new bullish trend.
Buy Level(s): The stock has currently broken out of a symmetrical triangle pattern. However, the ideal buy level for HON is if the stock closes above the immediate resistance level of $210.10. This is marked in the chart below as a green color dotted line.
Daily chart – HON
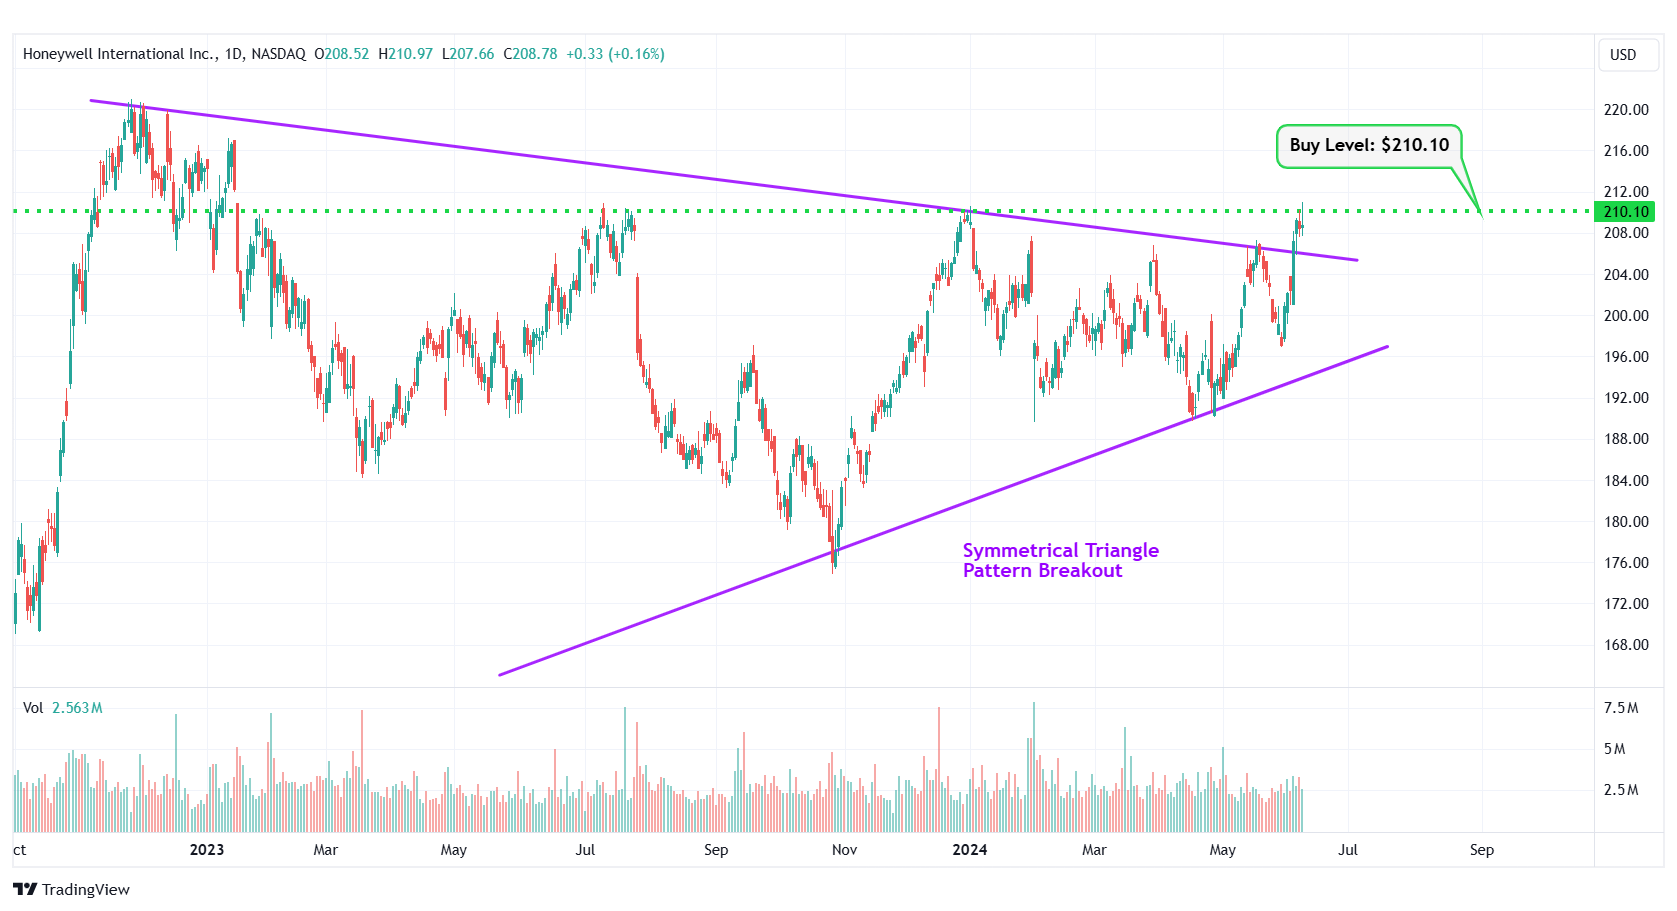
HON – Symmetrical Triangle Pattern Breakout
Happy Trading!
Trades of The Day Research Team
Everyone wants to know when to buy, sell, or hold a stock. FAST Graphs reveals this by clearly illustrating the value of the business relative to its stock price. Get 25% off using Daily Trade Alert's special referral link and coupon code AFFILIATE25
Source: Trades of the Day

