Picking a winning trade on a consistent basis is not simply a stroke of luck. It’s the result of calculated screening, planning, and deliberation.
With this in mind, we have started a new weekly series on our top 10 stocks to watch this week — stocks that look poised for a possible breakout in the coming days. Traders should add these stocks to their watchlist now.
The Top 10 Stocks to Watch This Week for Possible Breakouts
| Sl # | Name of the Stock | Stock Ticker | Last Close | Buy Level(s) | Reason |
| 1 | PENN Entertainment Inc. | NASDAQ: PENN | $17.50 | $18.00 | Falling Wedge Pattern Breakout |
| 2 | CRH Plc | NYSE: CRH | $81.76 | $82.50 | Flag Pattern |
| 3 | Broadridge Financial Solutions, Inc. | NYSE: BR | $200.77 | $206.00 | Downtrend Channel |
| 4 | MGM Resorts International | NYSE: MGM | $40.17 | $42.00 | Falling Wedge Pattern |
| 5 | Fluor Corporation | NYSE: FLR | $43.40 | $44.50 | Ascending Triangle Pattern Breakout |
| 6 | Liberty Media Corp. | NASDAQ: FWONK | $74.14 | $75.00 | Symmetrical Triangle Pattern Breakout |
| 7 | Molson Coors Beverage Company | NYSE: TAP | $54.81 | $57.00 | Falling Wedge Pattern Breakout |
| 8 | NextEra Energy Inc. | NYSE: NEE | $80.02 | $81.00 | Flag Pattern Breakout |
| 9 | BCE Inc. | NYSE: BCE | $34.21 | $34.60 | Downtrend Channel Breakout |
| 10 | Boston Beer Co., Inc. | NYSE: SAM | $313.67 | $316.50 | Falling Wedge Pattern Breakout |
Important: Typically, these trades offer a risk: reward ratio of 1:2 or 1:3 in the next 6 months, which implies 2x to 3x rewards when compared to risks. So, be sure to set your stop-loss levels and target prices accordingly to manage your risk. In addition, these trade ideas are triggered using daily closing prices, not intra-day pricing. So, if you participate in these trades, make sure that you only buy the stock once its daily close is above the recommended price level.
That said, here are the top 10 stocks to watch for a breakout, in no particular order.
#1 PENN Entertainment Inc. (NASDAQ: PENN)
Sector: Consumer Cyclical • Resorts & Casinos
Reason: Falling Wedge Pattern Breakout
A falling wedge pattern is formed by joining two downward-sloping, converging trendlines having a contracting range. The pattern appears to be wide at the top and continues to contract as prices fall. A breakout from a falling wedge pattern can indicate either reversal or continuation depending on where the pattern appeared in the trend.
A stock that has broken out of a falling wedge pattern would have gained momentum and would have the potential to move higher.
Buy Level(s): The stock has currently broken out of a falling wedge pattern. However, the ideal buy level for PENN is above the nearest resistance level of $18.00. This is marked in the chart below as a green color dotted line.
Daily chart – PENN
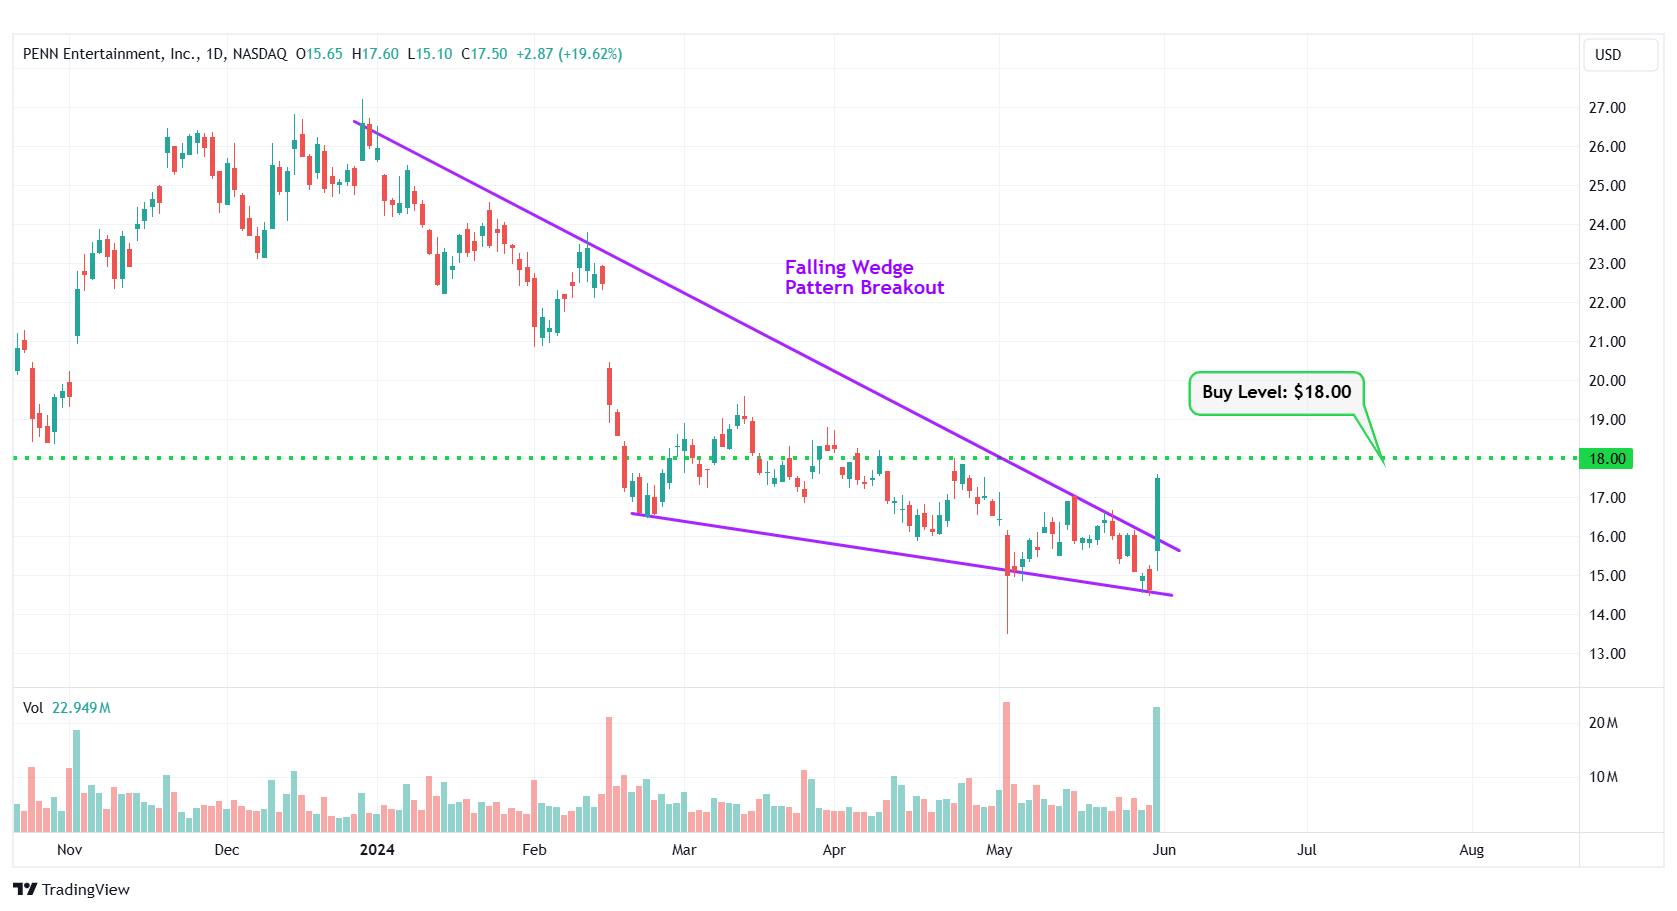
PENN – Falling Wedge Pattern Breakout
#2 CRH Plc (NYSE: CRH)
Sector: Basic Materials • Building Materials
Reason: Formation of a Flag Pattern
A flag pattern is a short-term continuation pattern that marks a small consolidation before the previous move resumes. The pattern is formed when the market consolidates in a narrow range after a sharp move. For a stock in an uptrend, a breakout from this pattern is typically a strong bullish indication.
Buy Level(s): The ideal buy level for CRH is if the stock breaks out of the flag pattern, at around $82.50. This is marked in the chart below as a green color dotted line.
Daily chart – CRH
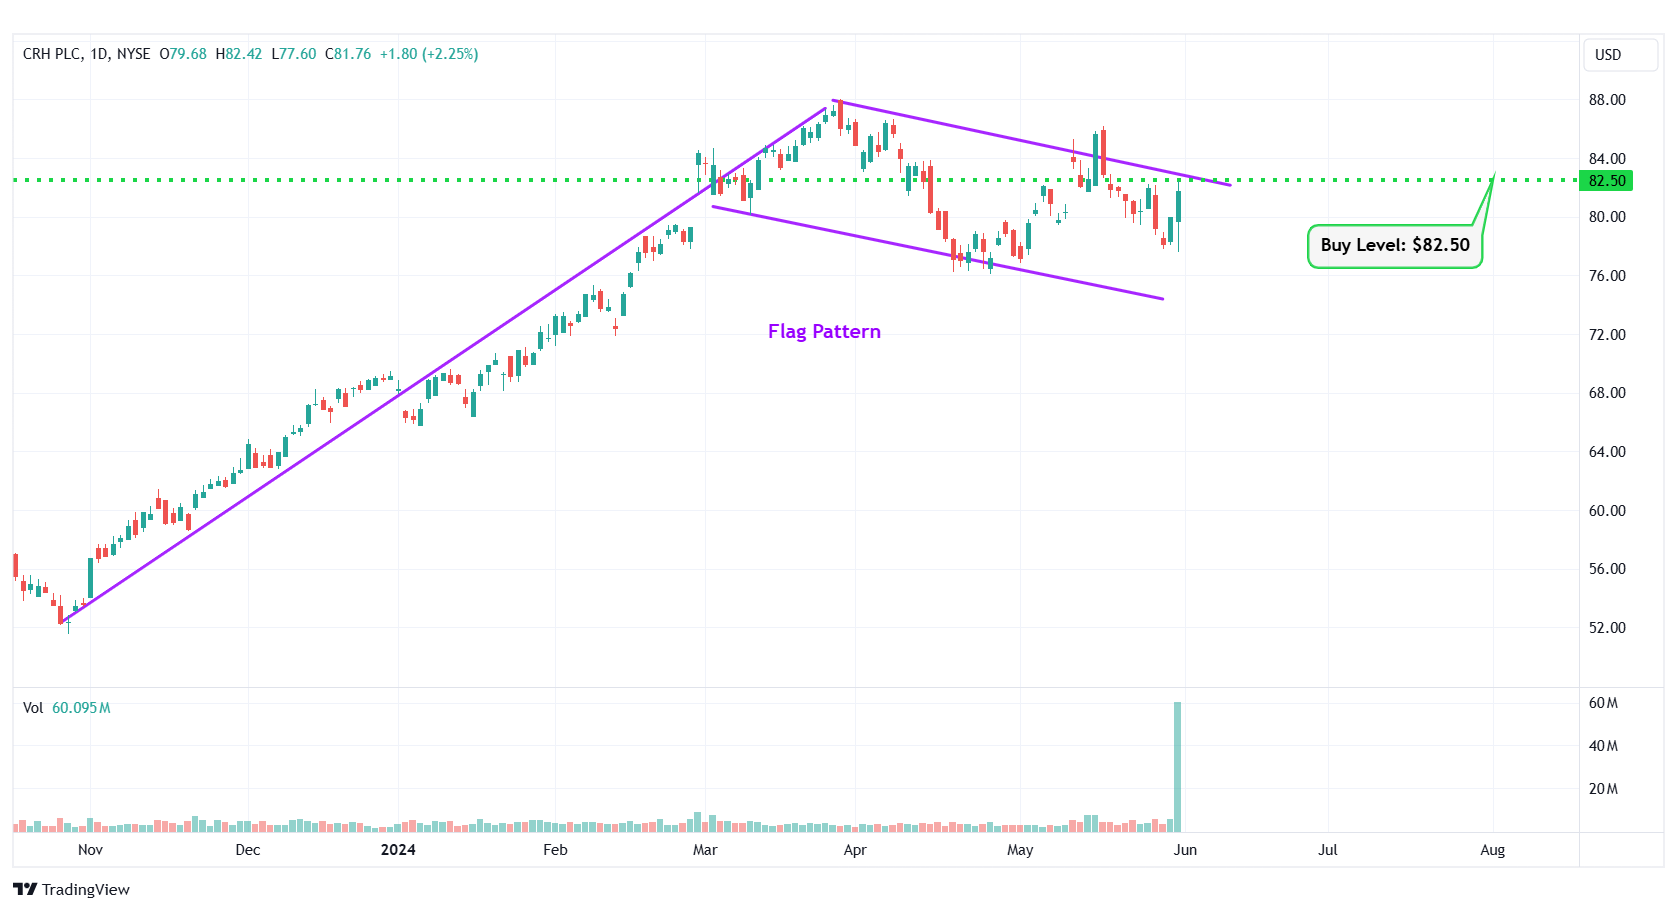
CRH – Flag Pattern
#3 Broadridge Financial Solutions, Inc. (NYSE: BR)
Sector: Technology • Information Technology Services
Reason: Formation of a Downtrend Channel
A downtrend or descending channel is the price action contained between downward sloping parallel lines. It is formed by two lines that are drawn by connecting the lower highs and lower lows of a stock’s price. Even though this is typically a bearish pattern, a breakout from the upper rail of this pattern is considered a good bullish indication.
Buy Level(s): The daily chart shows that the stock is currently forming a downtrend channel. The ideal buy level for BR is if the stock breaks out of the downtrend channel and has a daily close above $206.00. This is marked in the chart below as a green color dotted line.
Daily chart – BR
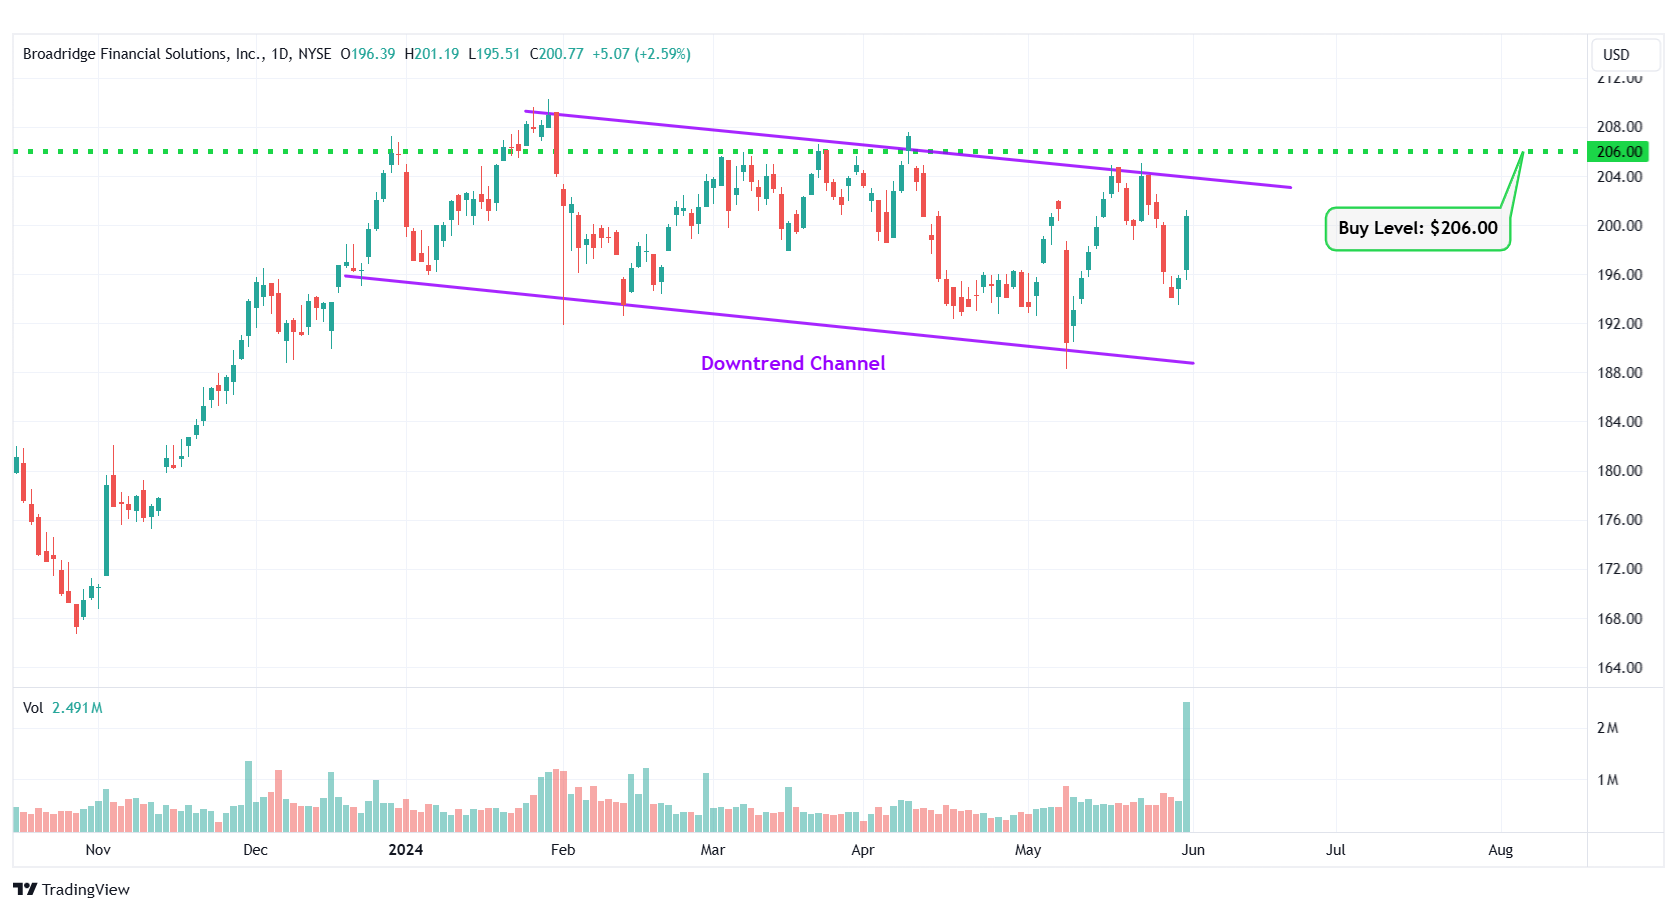
BR – Downtrend Channel
#4 MGM Resorts International (NYSE: MGM)
Sector: Consumer Cyclical • Resorts & Casinos
Reason: Formation of a Falling Wedge Pattern
A falling wedge pattern is formed by joining two downward-sloping, converging trendlines having a contracting range. The pattern appears to be wide at the top and continues to contract as prices fall. A breakout from a falling wedge pattern can indicate either reversal or continuation depending on where the pattern appeared in the trend.
A stock that has broken out of a falling wedge pattern would have gained momentum and would have the potential to move higher.
Buy Level(s): The ideal buy level for MGM is if the stock breaks out of the falling wedge pattern, at a price of around $42.00. This is marked in the chart below as a green color dotted line.
Daily chart – MGM
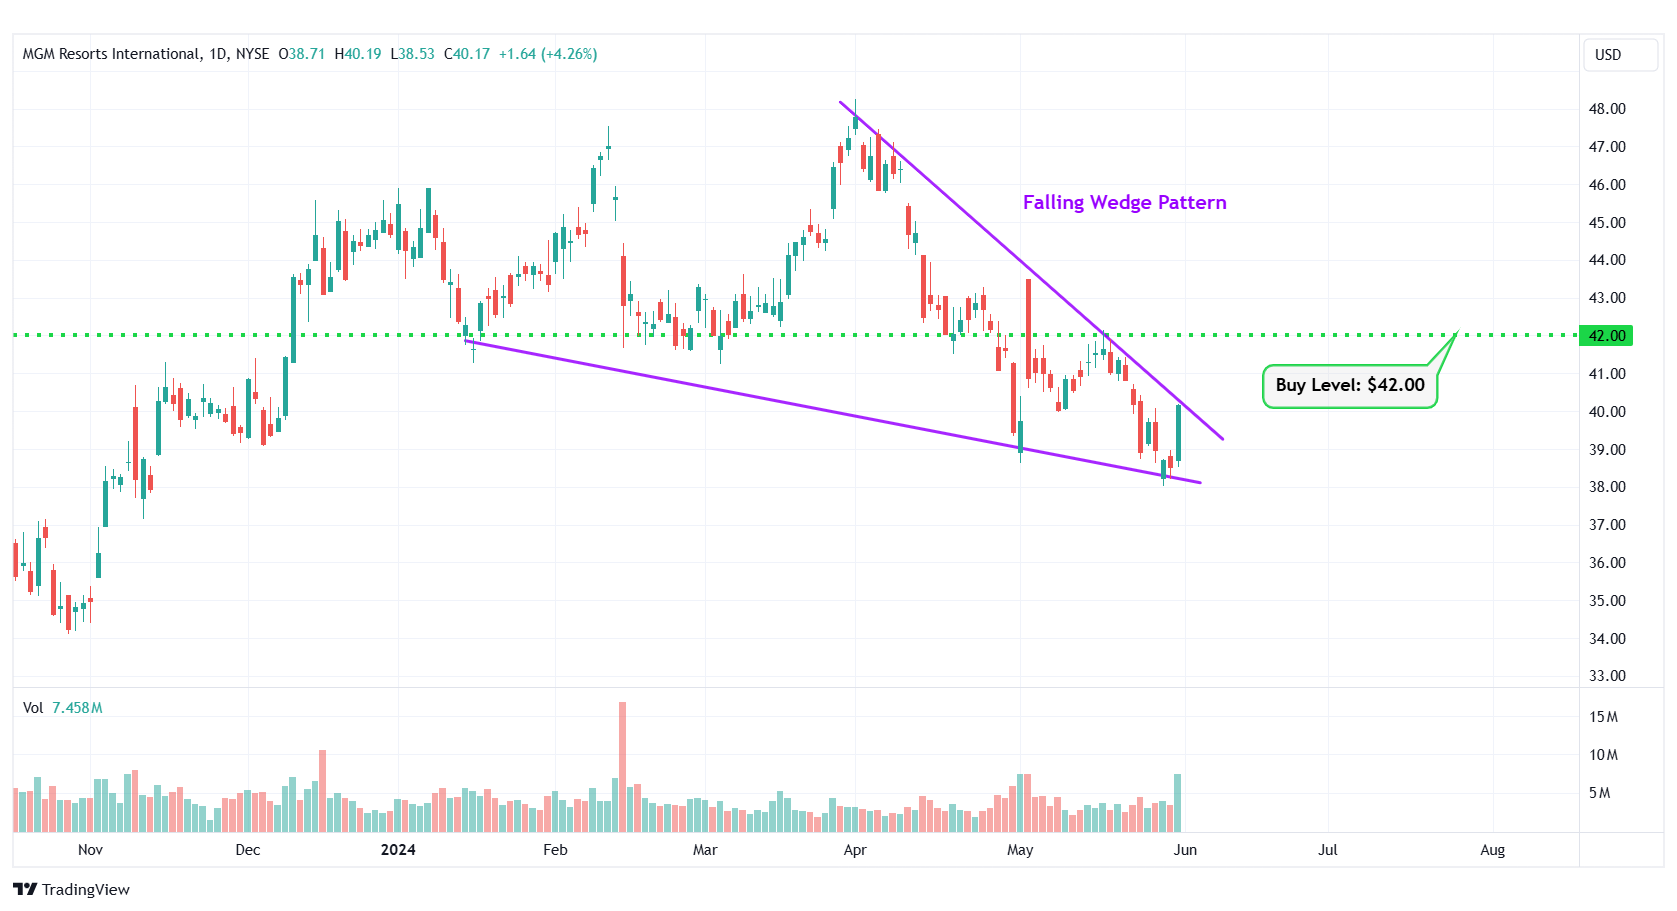
MGM – Falling Wedge Pattern
#5 Fluor Corporation (NYSE: FLR)
Sector: Industrials • Engineering & Construction
Reason: Breakout From an Ascending Triangle Pattern
An ascending triangle pattern is a bullish pattern formed by drawing a horizontal line along the swing highs, and a rising trendline along the swing lows. These two lines result in the formation of a triangle. A breakout from this pattern is typically a strong bullish indication.
Buy Level(s): Although the stock has broken out of the ascending triangle pattern, the ideal buy level for FLR is if the stock has a daily close above the near-term resistance level of $44.50. This is marked in the chart below as a green color dotted line.
Daily chart – FLR
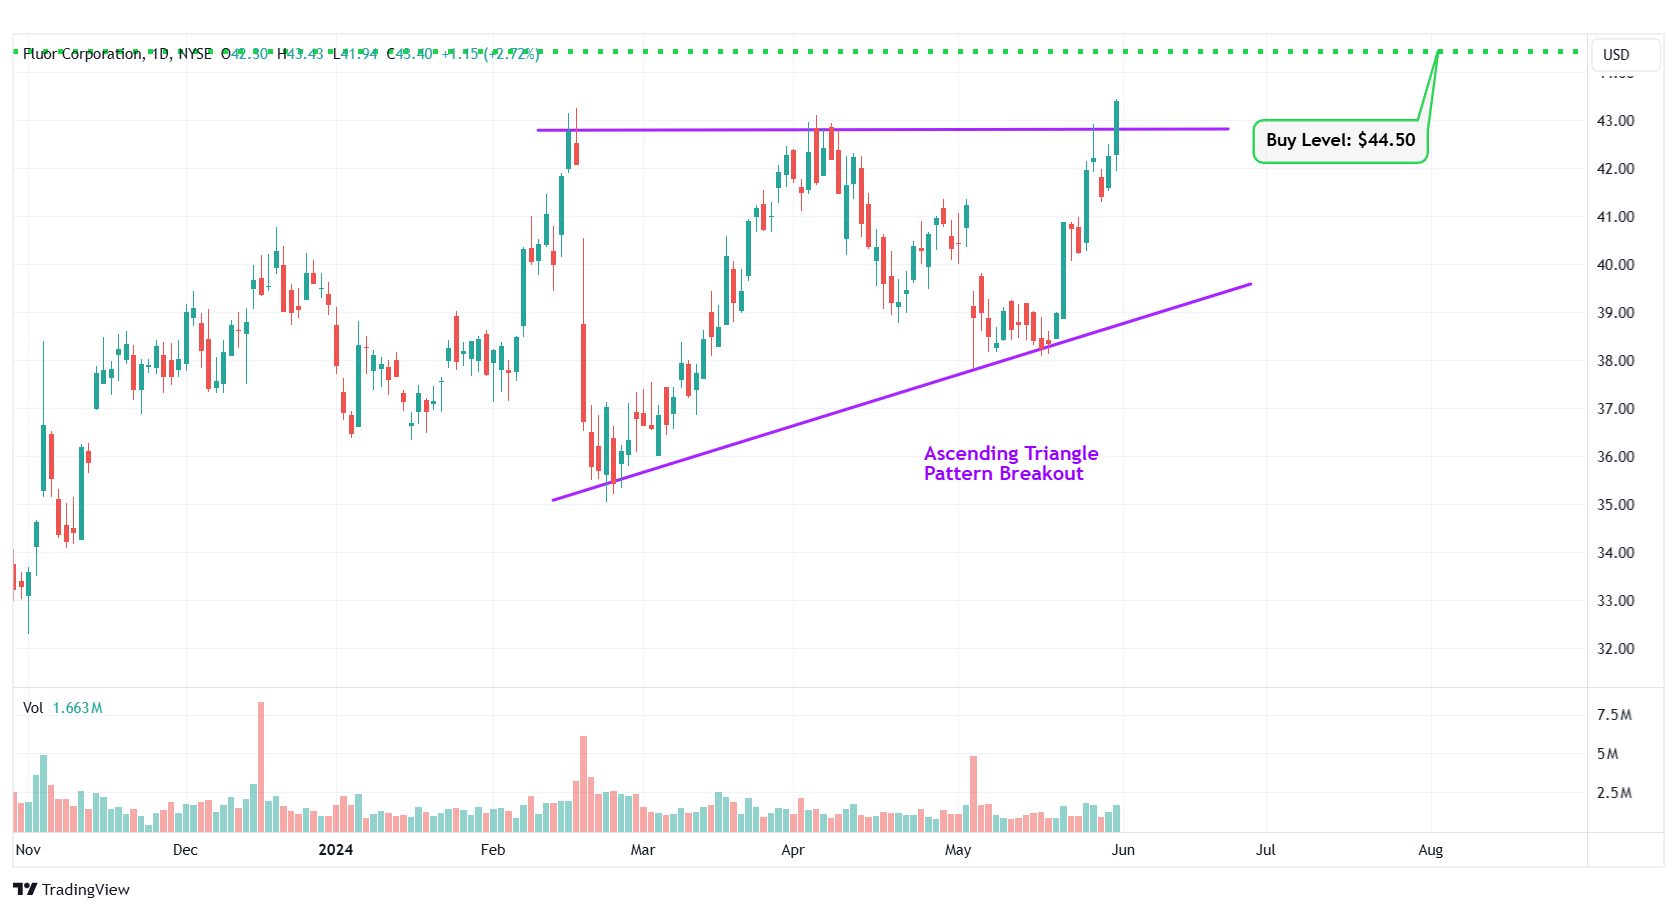
FLR – Ascending Triangle Pattern Breakout
#6 Liberty Media Corp. (NASDAQ: FWONK)
Sector: Communication Services • Entertainment
Reason: Symmetrical Triangle Pattern Breakout
A symmetrical triangle is a chart pattern formed by two converging trend lines connecting a series of sequential peaks and troughs. These two lines result in the formation of a triangle that appears to be symmetrical.
A symmetrical triangle pattern is usually formed when there is indecision in the price movements and there is uncertainty among the buyers and sellers. This chart pattern represents a period of consolidation before the price breaks out or breaks down. In case a breakout occurs from the upper trend line, it is a strong bullish indication as it signifies the start of a new bullish trend.
Buy Level(s): The stock has currently broken out of a symmetrical triangle pattern. However, the ideal buy level for FWONK is if the stock closes above the immediate resistance level of $75.00. This is marked in the chart below as a green color dotted line.
Daily chart – FWONK
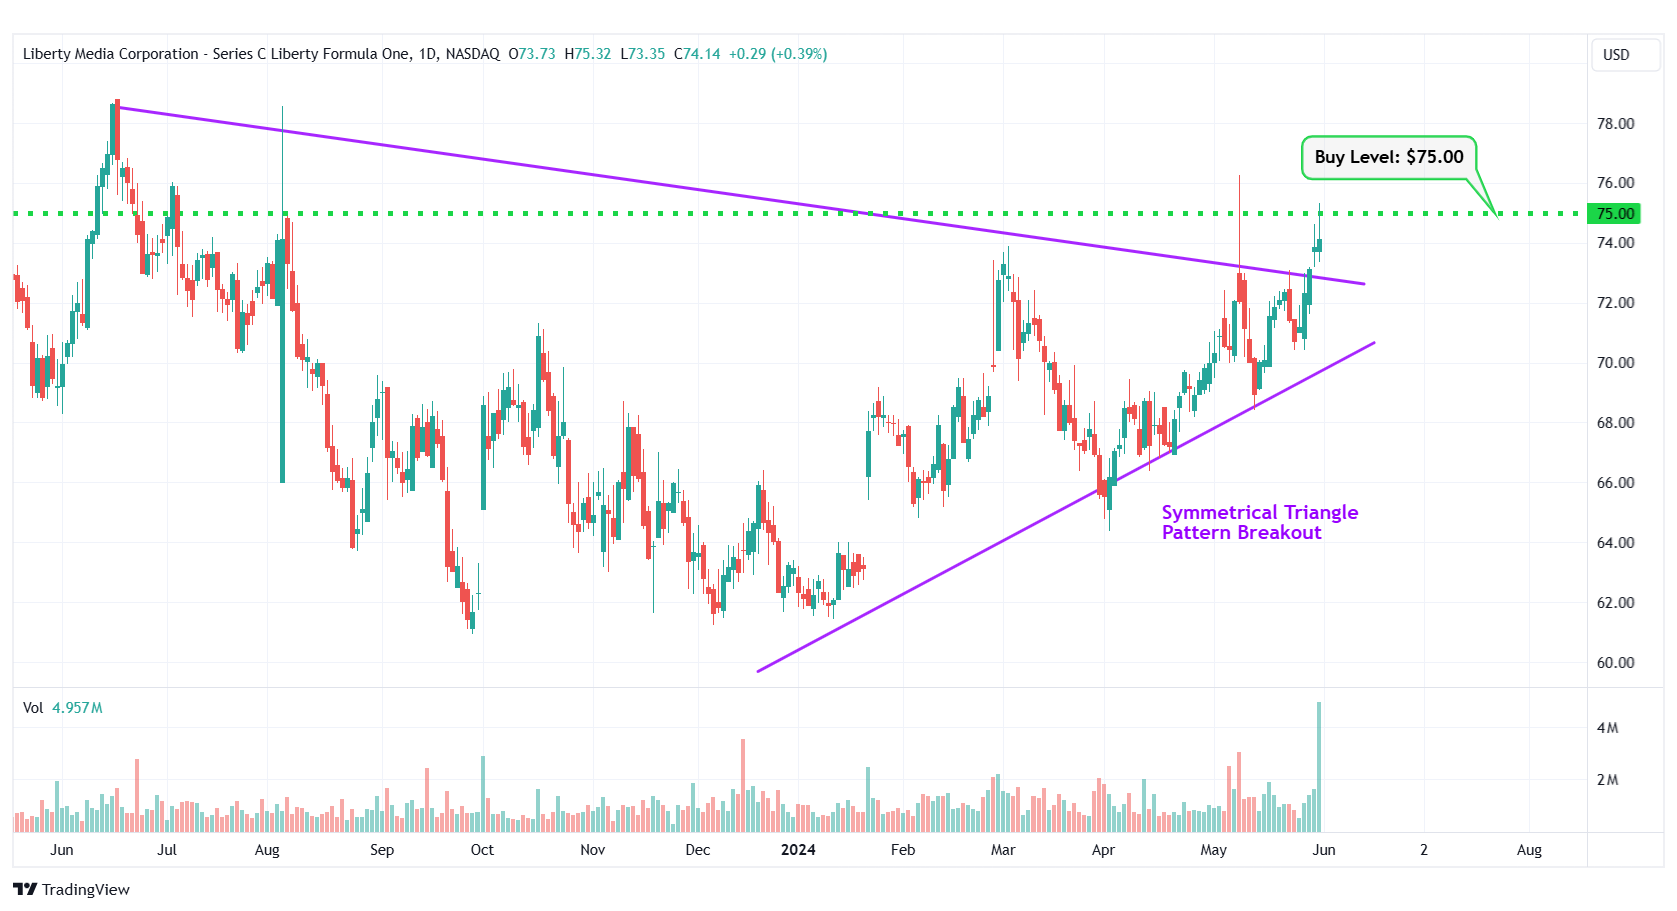
FWONK – Symmetrical Triangle Pattern Breakout
#7 Molson Coors Beverage Company (NYSE: TAP)
Sector: Consumer Defensive • Beverages – Brewers
Reason: Falling Wedge Pattern Breakout
A falling wedge pattern is formed by joining two downward-sloping, converging trendlines having a contracting range. The pattern appears to be wide at the top and continues to contract as prices fall. A breakout from a falling wedge pattern can indicate either reversal or continuation depending on where the pattern appeared in the trend.
A stock that has broken out of a falling wedge pattern would have gained momentum and would have the potential to move higher.
Buy Level(s): The stock has currently broken out of a falling wedge pattern. However, the ideal buy level for TAP is above the nearest resistance level of $57.00. This is marked in the chart below as a green color dotted line.
Daily chart – TAP
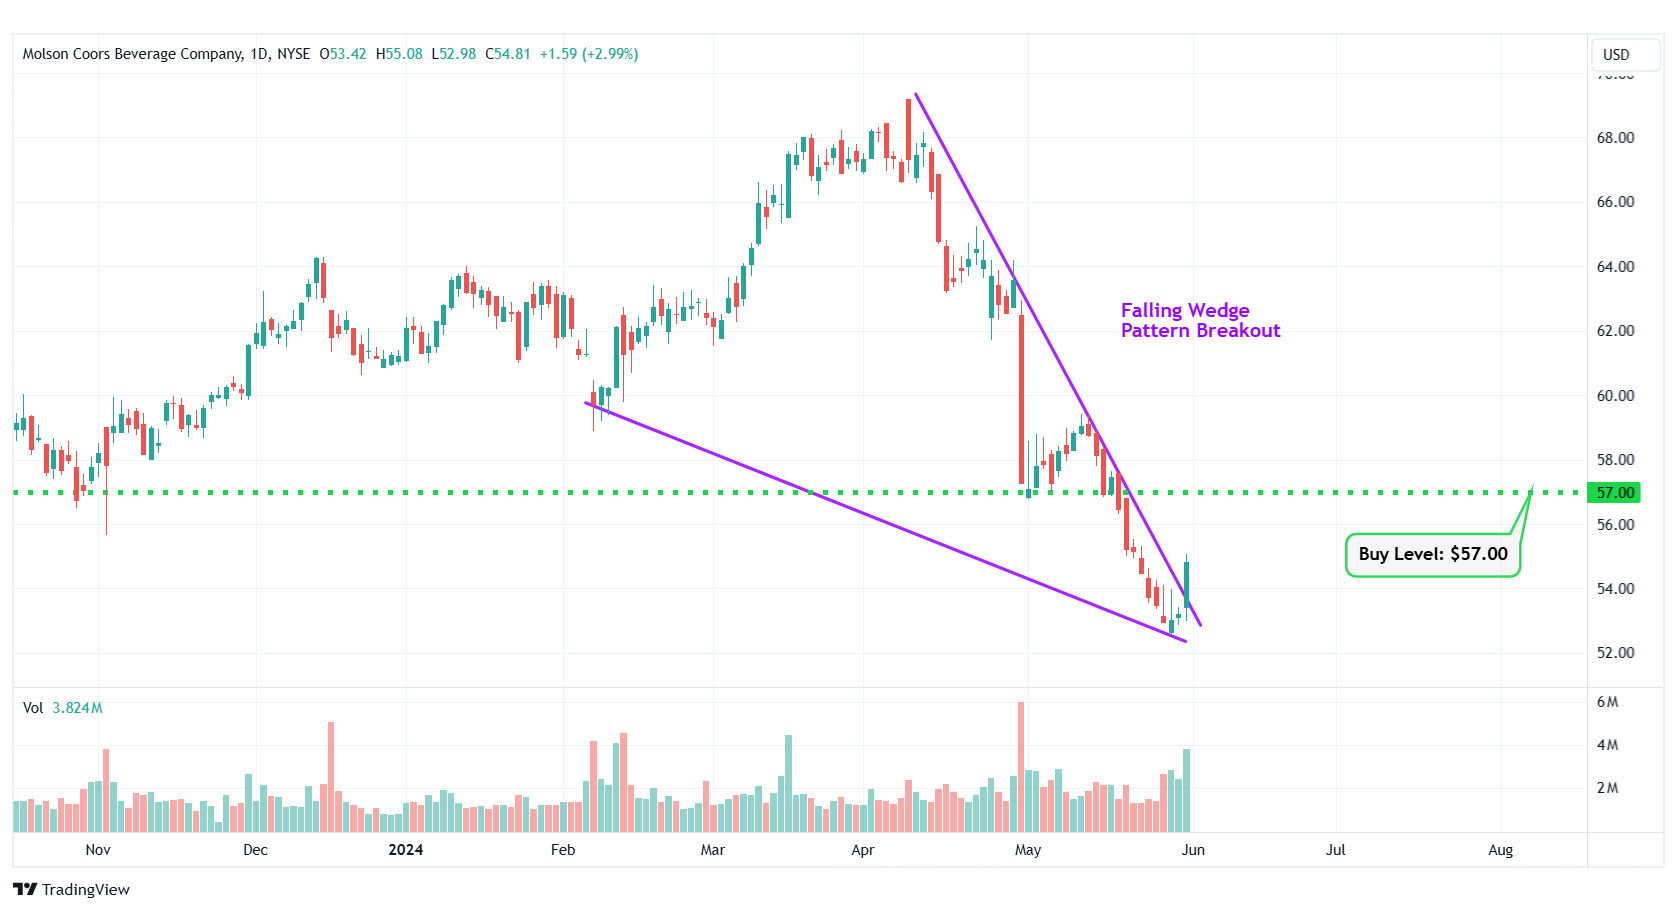
TAP – Falling Wedge Pattern Breakout
#8 NextEra Energy Inc. (NYSE: NEE)
Sector: Utilities • Utilities – Regulated Electric
Reason: Breakout From a Flag Pattern
A flag pattern is a short-term continuation pattern that marks a small consolidation before the previous move resumes. The pattern is formed when the market consolidates in a narrow range after a sharp move. For a stock in an uptrend, a breakout from this pattern is typically a strong bullish indication.
Buy Level(s): Although the stock has currently broken out of the flag pattern, the ideal buy level for NEE is above the near-term resistance level of $81.00. This is marked in the chart below as a green color dotted line.
Daily chart – NEE
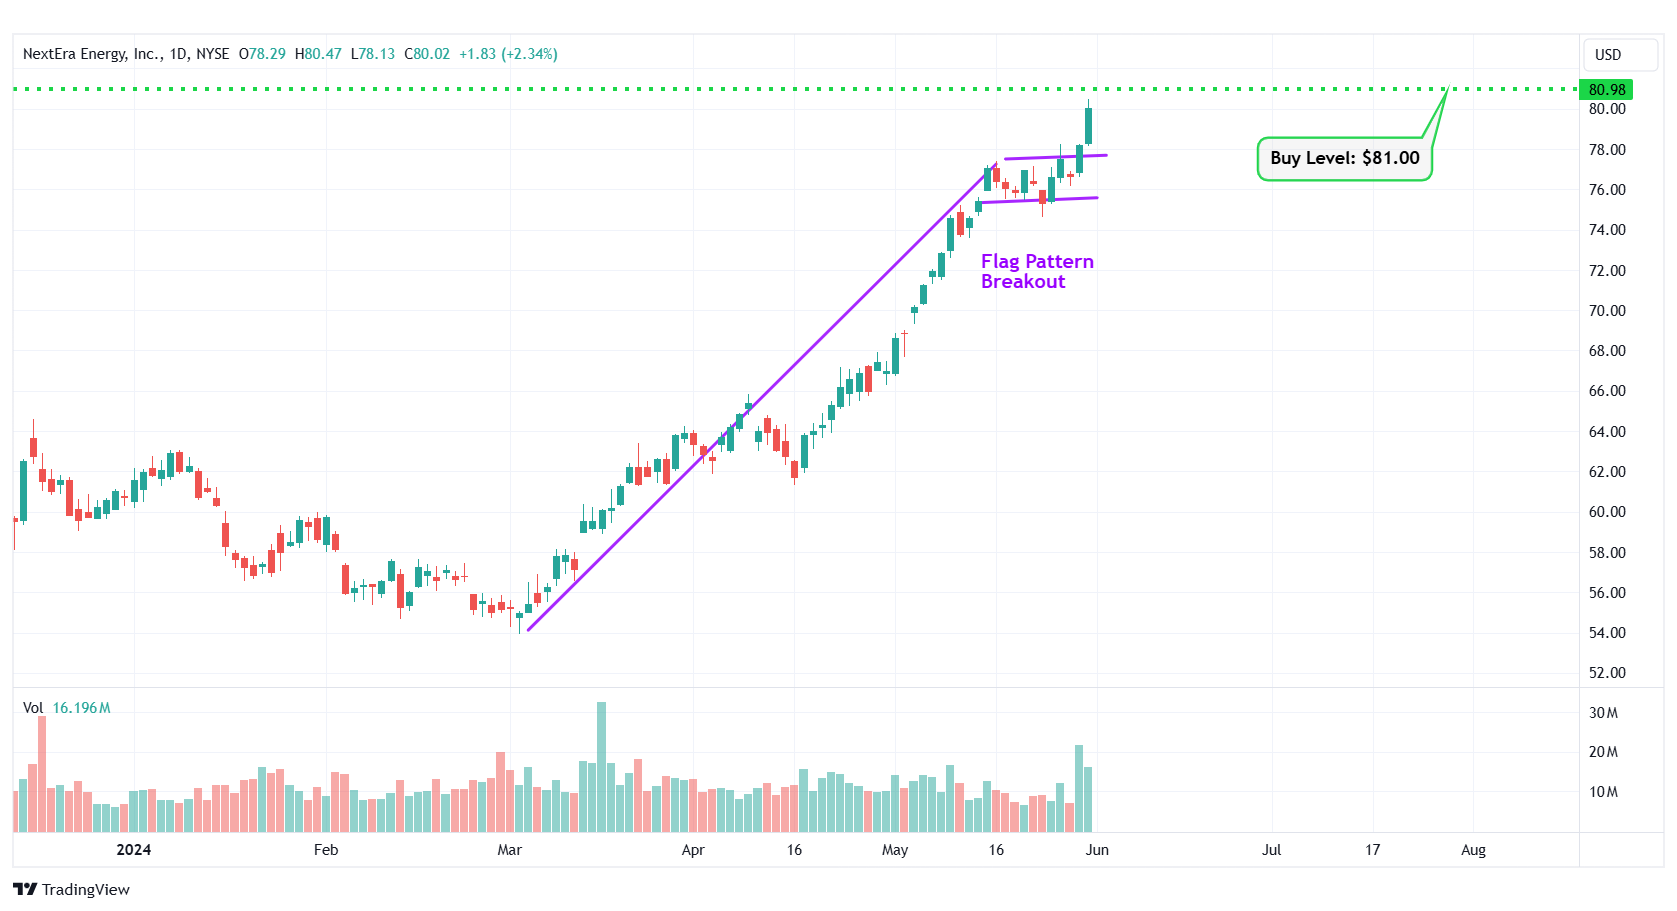
NEE – Flag Pattern Breakout
#9 BCE Inc. (NYSE: BCE)
Sector: Communication Services • Telecom Services
Reason: Downtrend Channel Breakout
A downtrend or descending channel is the price action contained between downward sloping parallel lines. It is formed by two lines that are drawn by connecting the lower highs and lower lows of a stock’s price. Even though this is typically a bearish pattern, a breakout from the upper rail of this pattern is considered a good bullish indication.
Buy Level(s): The daily chart shows that the stock has currently broken out of a downtrend channel. However, there is a near-term resistance level for the stock. Hence, the ideal buy level for BCE is if the stock has a daily close above $34.60. This is marked in the chart below as a green color dotted line.
Daily chart – BCE
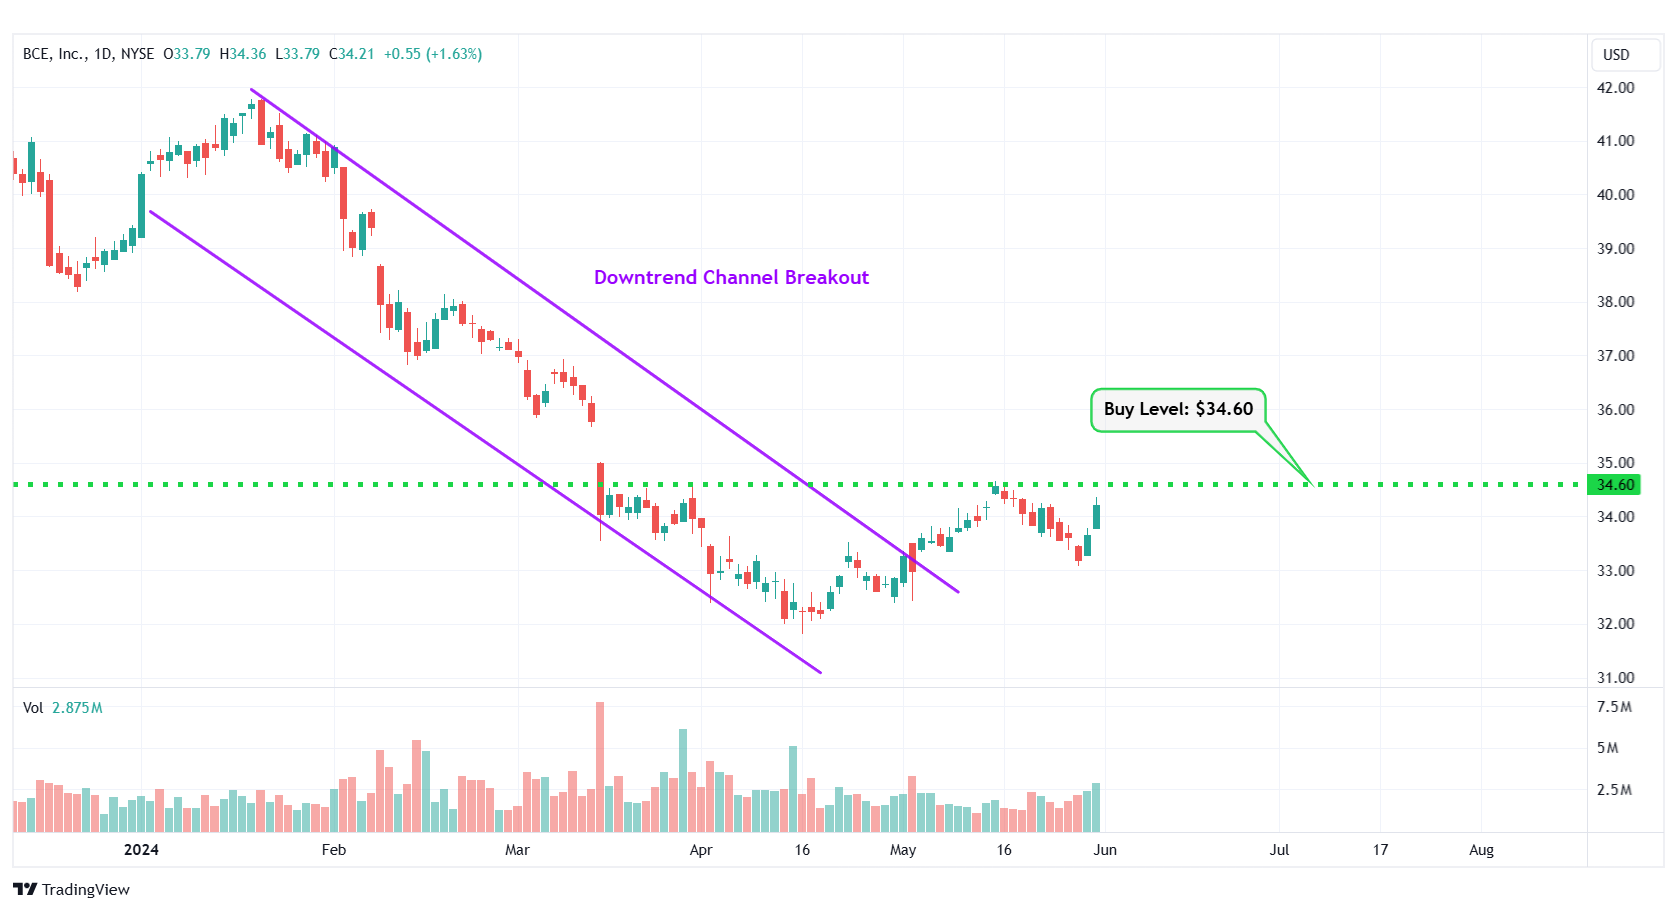
BCE – Downtrend Channel Breakout
#10 Boston Beer Co., Inc. (NYSE: SAM)
Sector: Consumer Defensive • Beverages – Brewers
Reason: Falling Wedge Pattern Breakout
A falling wedge pattern is formed by joining two downward-sloping, converging trendlines having a contracting range. The pattern appears to be wide at the top and continues to contract as prices fall. A breakout from a falling wedge pattern can indicate either reversal or continuation depending on where the pattern appeared in the trend.
A stock that has broken out of a falling wedge pattern would have gained momentum and would have the potential to move higher.
Buy Level(s): The stock has currently broken out of a falling wedge pattern. However, the ideal buy level for SAM is above the nearest resistance level of $316.50. This is marked in the chart below as a green color dotted line.
Daily chart – SAM
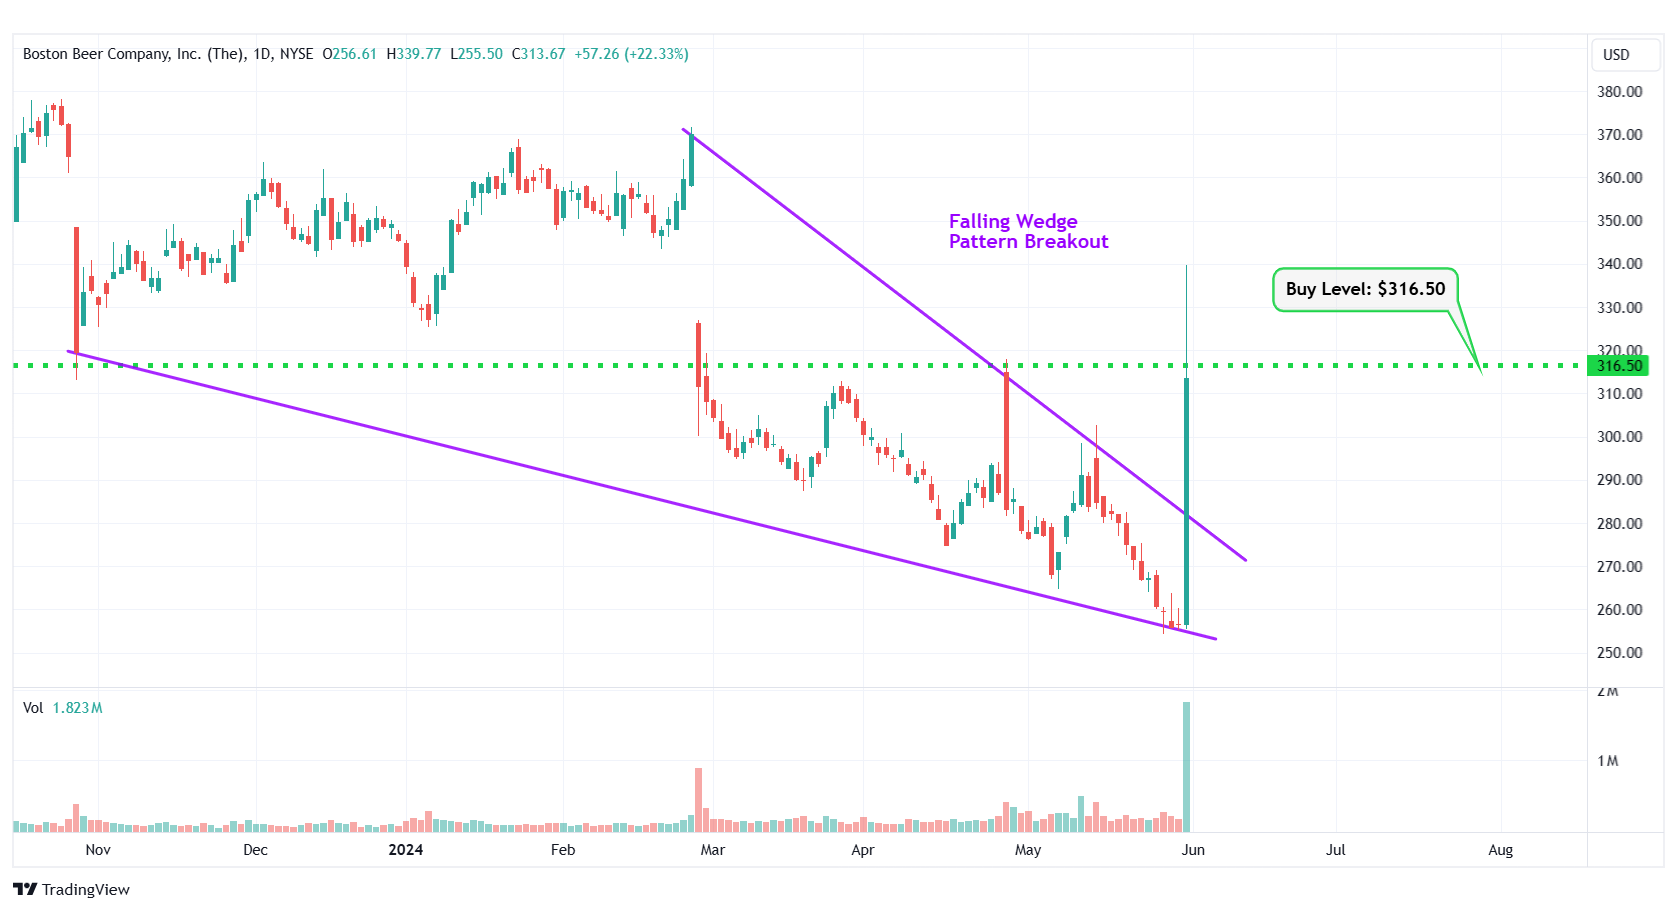
SAM – Falling Wedge Pattern Breakout
Happy Trading!
Trades of The Day Research Team
Everyone wants to know when to buy, sell, or hold a stock. FAST Graphs reveals this by clearly illustrating the value of the business relative to its stock price. Get 25% off using Daily Trade Alert's special referral link and coupon code AFFILIATE25
Source: Trades of the Day

