
We recently started a series called “Penny Stock of the Day”. These ideas are geared towards traders with an extremely high risk appetite.
Our Penny Stock of the Day is chosen by screening for stocks under $5 and then applying technical analysis on the shortlisted set of penny stocks showing unusual volume. When making these trades, please make sure to pay vigilant attention to pricing moves and have a strict stop loss in place to avoid significant losses.
Penny Stock of the Day: FREYR Battery, Inc. (NYSE: FREY)
Today’s penny stock pick is the developer of clean, next-generation battery cell production capacity, FREYR Battery, Inc. (NYSE: FREY).
FREYR Battery, Inc. provides battery solutions in the United States, Norway, and internationally. The company develops battery cell manufacturing facilities. It serves its products to energy storage systems and commercial mobility, including marine applications and commercial vehicles markets.
Website: https://www.freyrbattery.com
Latest 10-k report: https://d18rn0p25nwr6d.cloudfront.net/CIK-0001992243/0d4784ba-255c-47d5-9551-d4fad15e9df1.pdf
Analyst Consensus: As per TipRanks Analytics, based on 2 Wall Street analyst offering 12-month price targets for FREY in the last 3 months, the stock has an average price target of $3.00, which is nearly 20% upside from current levels.
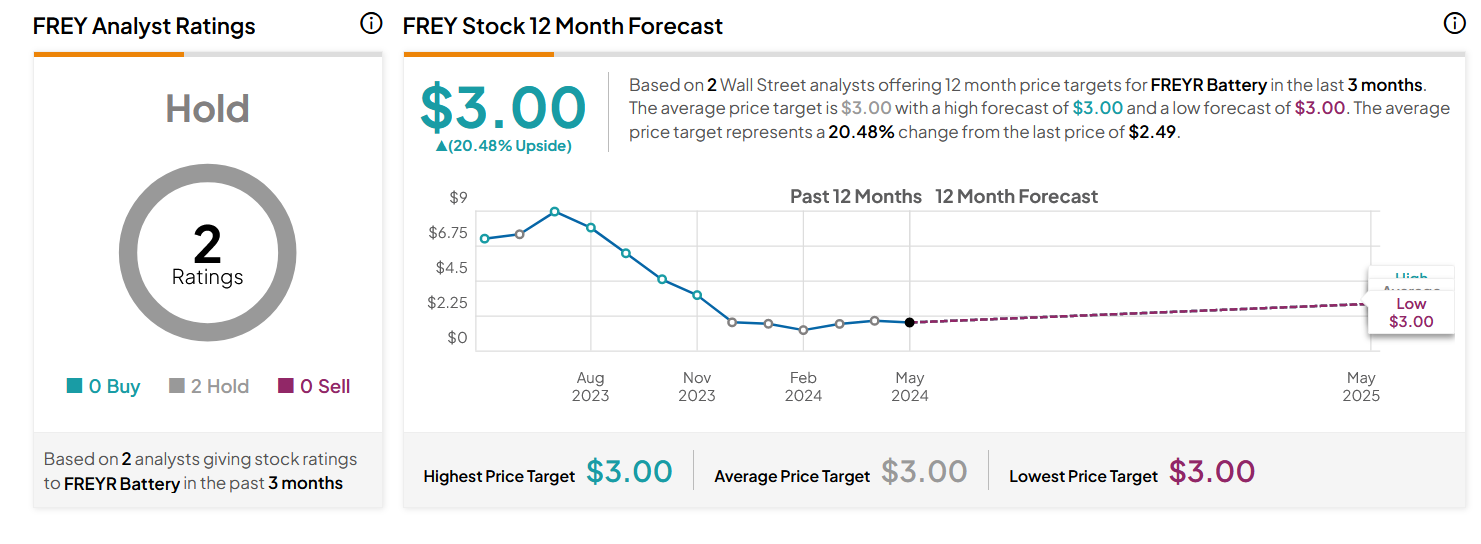
Analysts | Source: TipRanks.com
Potential Catalysts / Reasons for the Hype:
- Freyr conducted successful unit cell production trials at Customer Qualification Plant (CQP) in Mo i Rana, Norway. With this, FREYR is the first company globally to successfully demonstrate the functionality of giga scale production line equipment for the second generation of the 24M Technologies SemiSolidTM platform.
- FREYR has also entered into several strategic partnerships to enhance its technology and expand its market reach.
On analyzing the company’s stock charts, there seem to be multiple bullish indications…
Bullish Indications
#1 Breakout from Consolidation Area: The daily chart shows that the stock has broken out of a consolidation area, which is shown as purple color rectangle. This is a possible bullish indication.
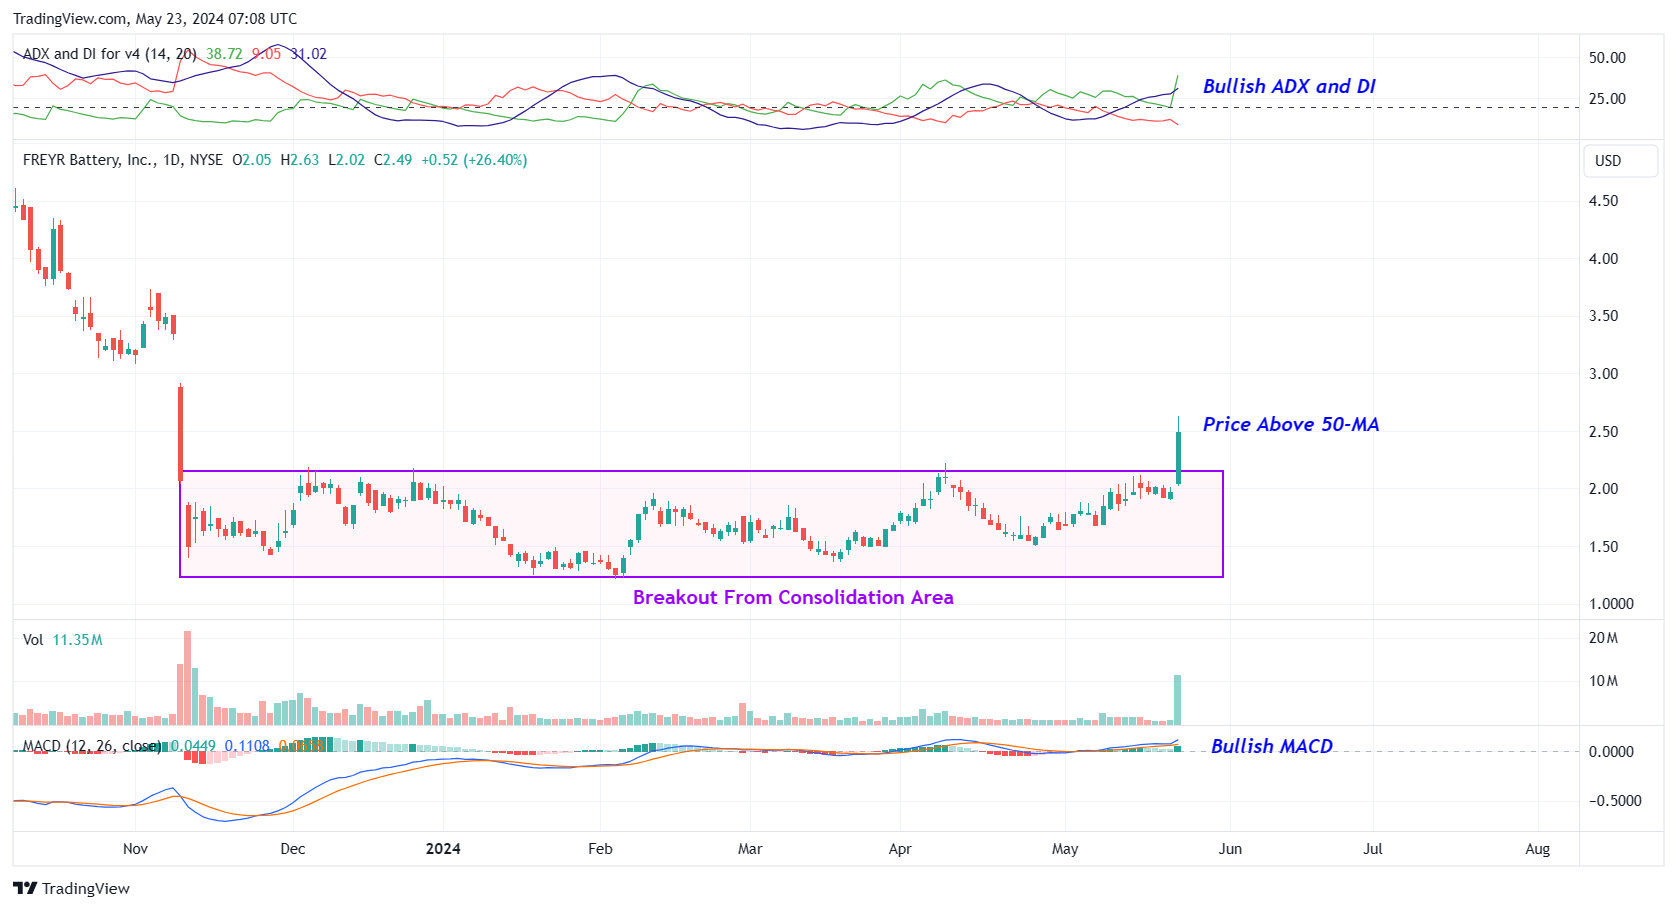
FREY – Daily Chart
#2 Bullish ADX and DI: The ADX indicator shows bullishness as the +DI line is above the -DI line, and the ADX line is currently moving higher from below the +DI and -DI lines.
#3 Price above MA: The stock is currently above its 50-day SMA, indicating that the bulls have currently gained control.
#4 MACD above Signal Line: In the daily chart, the MACD (light blue color) is currently above the MACD signal line (orange color). This indicates a possible bullish setup.
#5 Above Support Area: The weekly chart shows that the stock is currently trading above a support area, which is marked as a pink color dotted line. This looks like a good area for the stock to move higher.
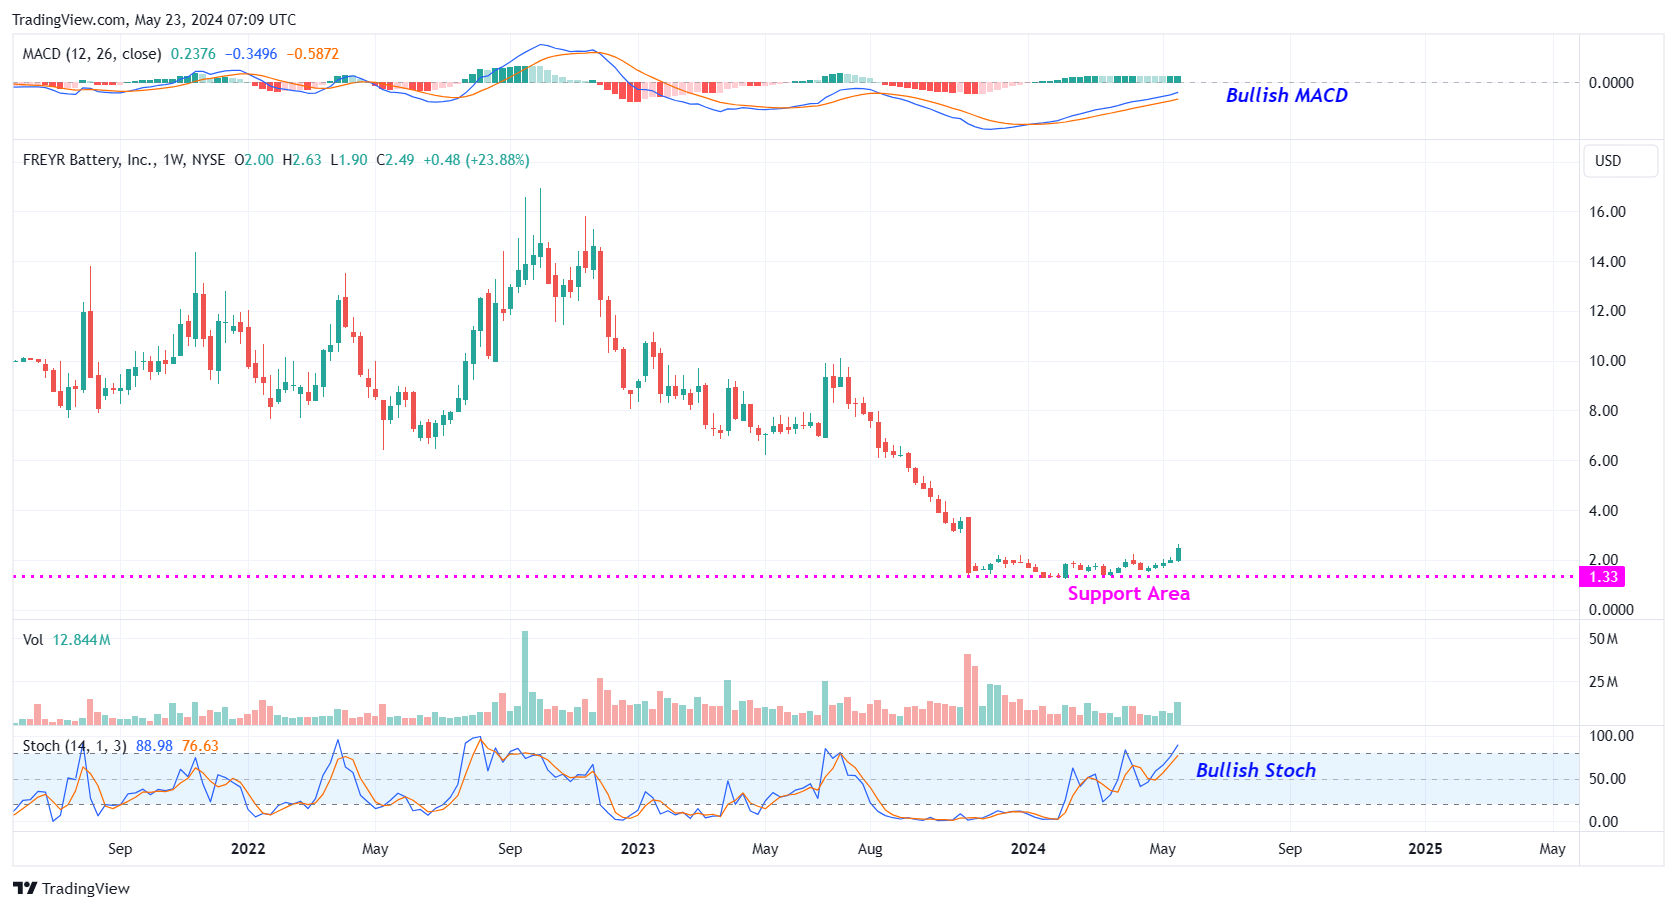
FREY – Weekly Chart
#6 Bullish Stoch: The %K line is above the %D line of the stochastic in the weekly chart, indicating possible bullishness.
#7 MACD above Signal Line: In the weekly chart as well, the MACD (light blue color) is currently above the MACD signal line (orange color). This indicates a possible bullish setup.
Recommended Trade (based on the charts)
Buy Levels: If you want to get in on this trade, the ideal buy level for FREY is above the price of $2.60.
Target Prices: Our first target is $3.70. If it closes above that level, the second target price is $4.50.
Stop Loss: To limit risk, place a stop loss at $2.00. Note that the stop loss is on a closing basis.
Our target potential upside is 42% to 73%.
For a risk of $0.60, our first target reward is $1.10, and the second target reward is $1.90. This is a nearly 1:2 and 1:3 risk-reward trade.
In other words, this trade offers 2x to 3x more potential upside than downside.
Potential Risks / Red Flags:
- The company has a history of net losses.
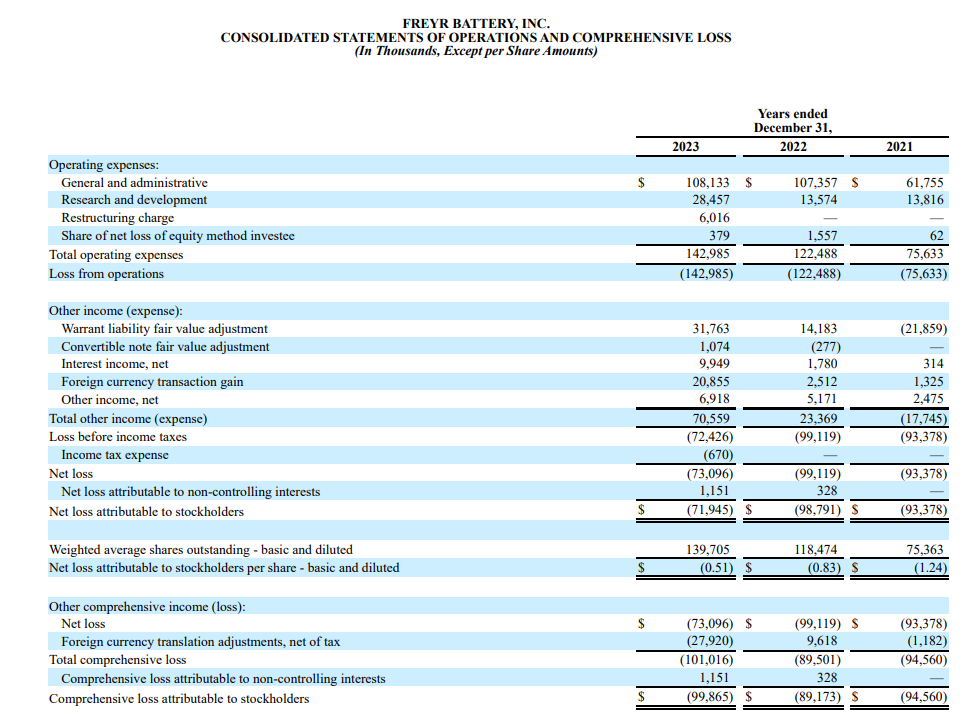
FREY – Consolidated Statements of Operations
- As of December 31, 2023, FREYR has not yet initiated manufacturing or derived revenue from its principal business activities; and may incur significant expenses and generate losses for the foreseeable future.
- Hedge Funds Decreased Holdings by 375.0K Shares Last Quarter.

Hedge Funds | Source: TipRanks.com
- The increase in competition and advances in technology in the battery industry is expected to cause substantial downward pressure on the prices of battery cells. This, in turn, may cause FREYR to lose sales or market share.
- Despite being a loss-making company, the executives are being paid significant compensation.
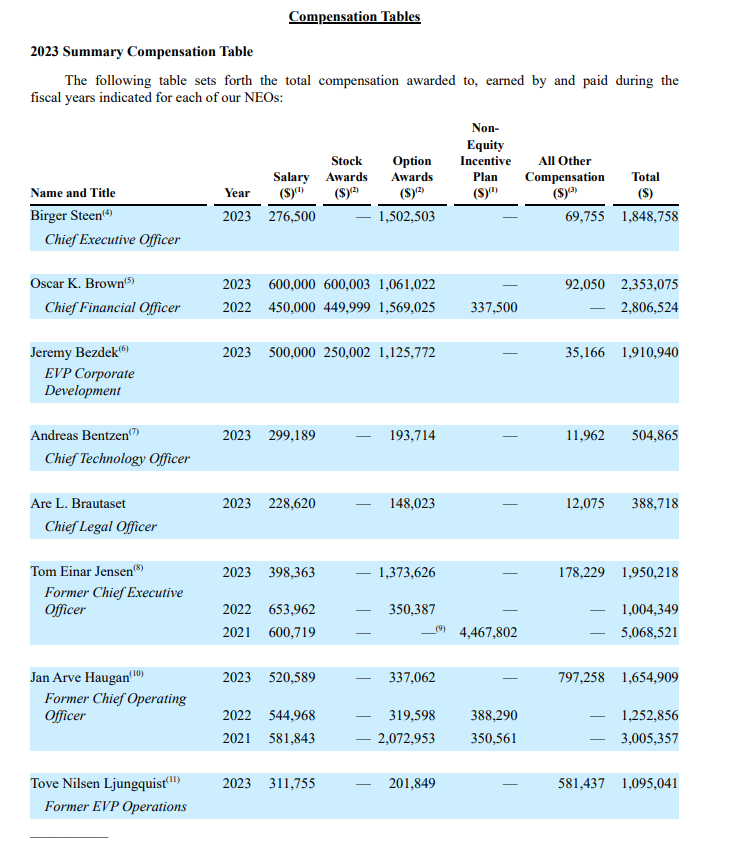
FREY – Executive Compensation
As you can see, today’s featured penny stock offers big upside potential… but it also comes with a number of risks and red flags. As always, when dealing with penny stocks, we advise caution before entering into such high-risk ventures. Remember to think before you trade… understand the risks… and if you decide to trade, stick to your stop-losses!
Happy Trading!
Trades of the Day Research Team
READ BEFORE TRADING PENNY STOCKS: The allure of penny stocks lies in their potential to deliver massive gains in a short period of time. However, in exchange for that opportunity, most penny stocks carry tremendous risk. They can be extremely volatile and are susceptible to “pump and dump” schemes and fraud.
Unlike regular stocks, the financial condition of most penny stock companies can be extremely difficult to analyze, as the majority of such stocks are traded on over-the-counter (OTC) exchanges, which are typically less transparent and less regulated than the major exchanges. In fact, in the penny stock space, it’s often easier to spot warning signs and red flags than it is to identify a sound investment. Nevertheless, we do our best to identify short-term trade opportunities in this exciting space because we know some of our readers are looking for high-risk, high-reward ideas. We just urge you to make sure you fully understand the risks before making any of these trades.
Everyone wants to know when to buy, sell, or hold a stock. FAST Graphs reveals this by clearly illustrating the value of the business relative to its stock price. Get 25% off using Daily Trade Alert's special referral link and coupon code AFFILIATE25
Source: Trades of the Day
