
Corning Incorporated (NYSE: GLW) seems to be poised for a price surge as per its latest charts. The company engages in display technologies, optical communications, environmental technologies, specialty materials, and life sciences businesses.
Bullish Indications
#1 Symmetrical Triangle Pattern Breakout: The daily chart shows that the stock had recently broken out of a Symmetrical Triangle pattern. This is a continuation pattern and is characterized by two converging trend lines connecting a series of sequential peaks and troughs. This pattern is marked on the daily chart as purple color lines. The breakout from a symmetrical triangle pattern usually signifies a bullish move.
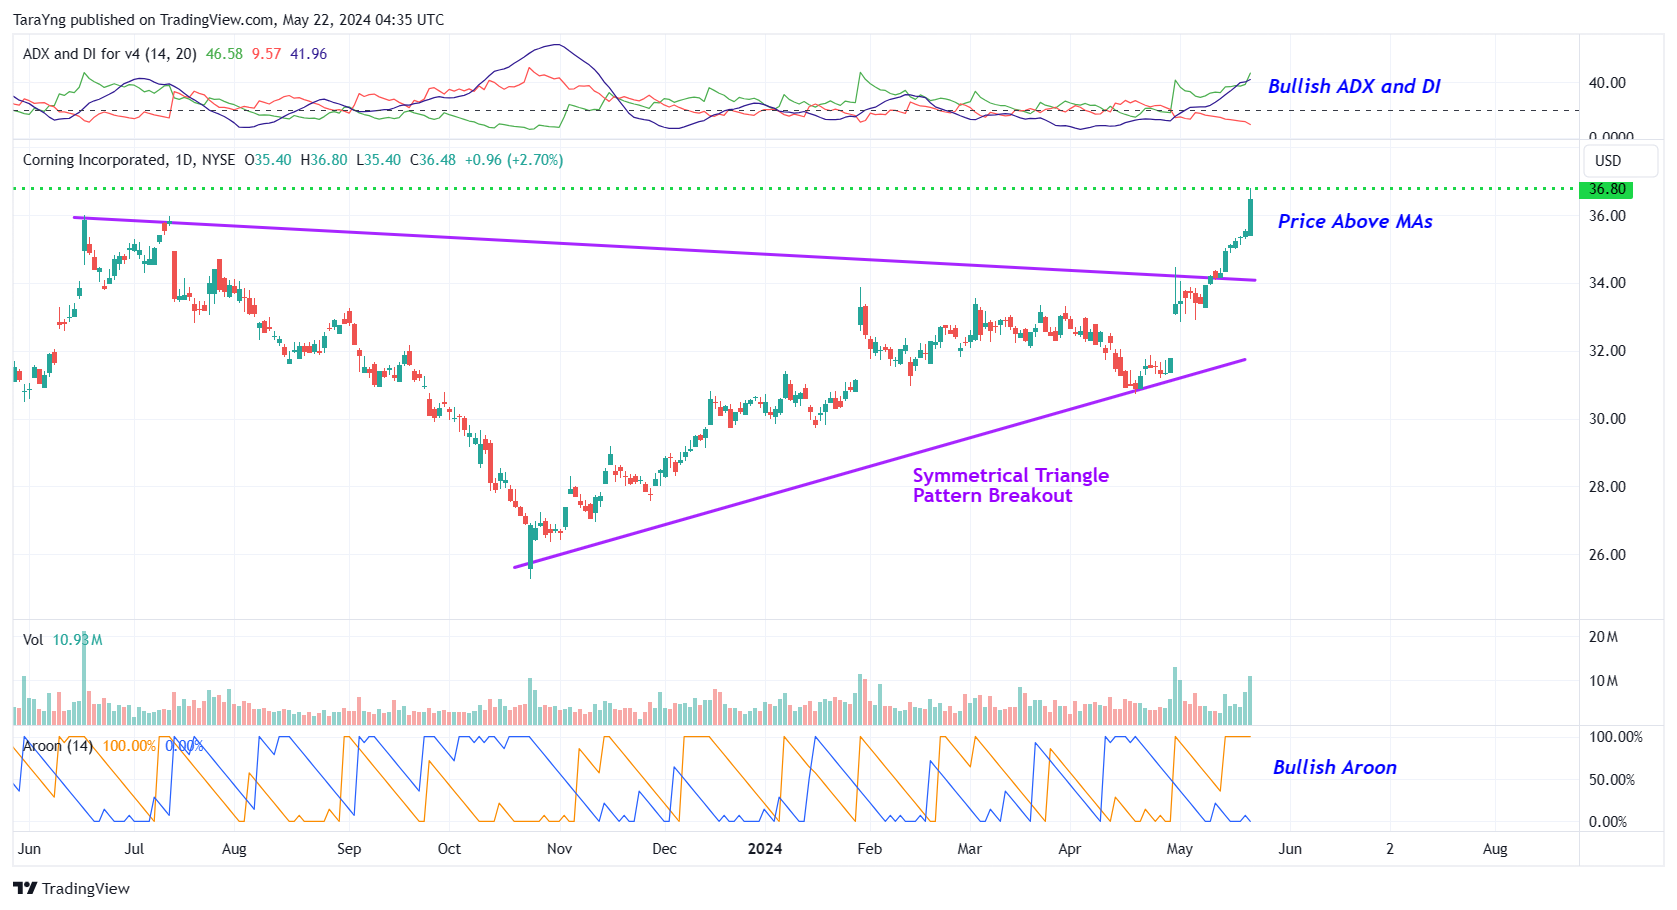
GLW – Daily Chart
#2 Price above MAs: The price is currently above the short-term moving average of 50-day SMA as well as the longer-term moving average of 200-day SMA, indicating that the bulls are still in control. This is a positive indication.
#3 Bullish ADX: The ADX indicator shows that the +DI line is currently above the –DI line and the ADX line has started to move up from below the –DI and +DI lines. This indicates possible bullishness.
#4 Bullish Aroon: The value of Aroon Up (orange line) is above 70 while Aroon Down (blue line) is below 30 in the daily chart. This indicates possible bullishness.
#5 Above Support Area: As you can see from the weekly chart, the stock has currently moved up from a resistance-turned-support level. This level is marked as a pink color dotted line. This looks like a good area for the stock to move higher. The stock is also trading above its 50-week and 200-week SMA, indicating that the bulls are still in control.
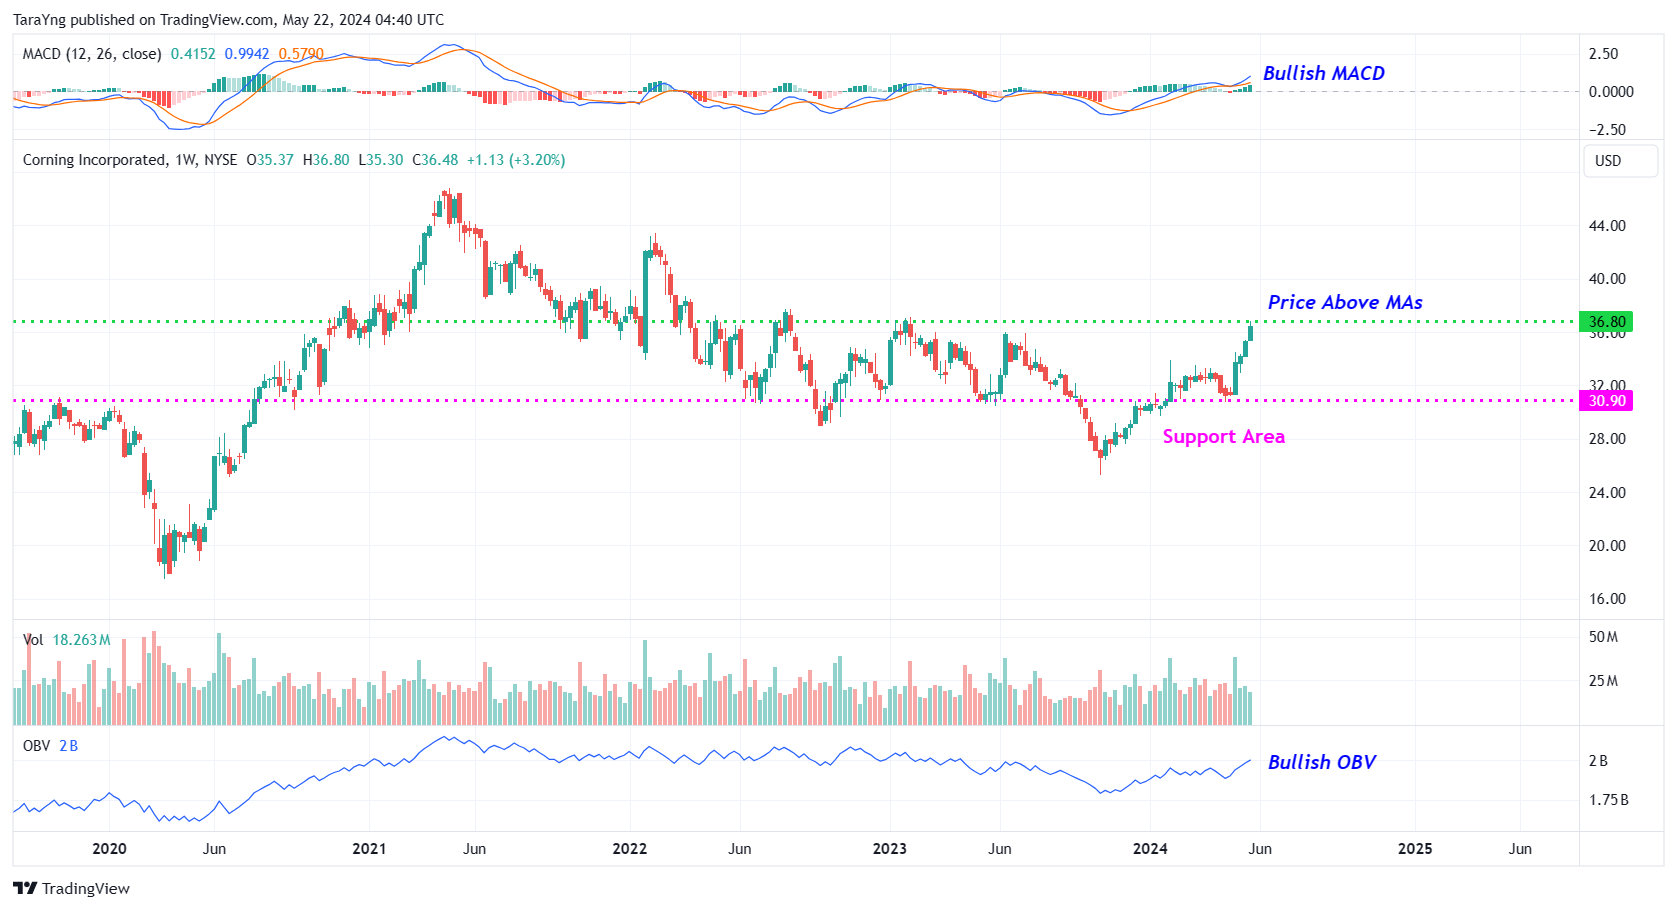
GLW – Weekly Chart
#6 Bullish MACD: The MACD line is above the MACD signal line in the weekly chart, indicating bullishness.
#7 Positive OBV: The weekly chart shows that the OBV indicator is currently rising. OBV rises when volume on up weeks outpaces volume on down weeks. A rising OBV typically reflects positive volume pressure that can lead to higher prices. This is a possible bullish sign.
Recommended Trade (based on the charts)
Buy Levels: If you want to get in on this trade, you can purchase shares of GLW above the price of around $36.80.
TP: Our target prices are $39.80 and $42.50 in the next 3-6 months.
SL: To limit risk, place stop-loss at $34.90. Note that the stop-loss is on a closing basis.
Our target potential upside is 8% to 16% in the next 3 to 6 months.
For a risk of $1.90, our target rewards are $3.00 and $5.70. This is a nearly 1:2 and 1:3 risk-reward trade.
In other words, this trade offers nearly 2x to 3x more potential upside than downside.
Risks to Consider
The stock may reverse its overall trend if it breaks down from the symmetrical triangle pattern with a high volume. The sell-off of the stock could also be triggered in case of any negative news, overall weakness in the market, or any regulatory changes in the sector.
Happy Trading!
Tara
Everyone wants to know when to buy, sell, or hold a stock. FAST Graphs reveals this by clearly illustrating the value of the business relative to its stock price. Get 25% off using Daily Trade Alert's special referral link and coupon code AFFILIATE25
Source: Trades of the Day
