
Picking a winning trade on a consistent basis is not simply a stroke of luck. It’s the result of calculated screening, planning, and deliberation.
With this in mind, we have started a new weekly series on our top 10 stocks to watch this week — stocks that look poised for a possible breakout in the coming days. Traders should add these stocks to their watchlist now.
The Top 10 Stocks to Watch This Week for Possible Breakouts
| Sl # | Name of the Stock | Stock Ticker | Last Close | Buy Level(s) | Reason |
| 1 | SilverBow Resources Inc. | NYSE: SBOW | $37.48 | $38.50 | Symmetrical Triangle Pattern Breakout |
| 2 | Sigma Lithium Corporation | NASDAQ: SGML | $18.56 | $19.10 | Breakout From Consolidation Area |
| 3 | Vale S.A. ADR | NYSE: VALE | $12.99 | $13.50 | Falling Wedge Pattern Breakout |
| 4 | Seabridge Gold, Inc. | NYSE: SA | $15.13 | $16.00 | Flag Pattern |
| 5 | ZTO Express Inc. ADR | NYSE: ZTO | $24.59 | $24.70 | Symmetrical Triangle Pattern Breakout |
| 6 | Newmark Group Inc. | NASDAQ: NMRK | $11.22 | $11.40 | Consolidation Area |
| 7 | Prudential Financial Inc. | NYSE: PRU | $121.31 | $122.00 | Uptrend Channel |
| 8 | Chubb Limited | NYSE: CB | $274.28 | $276.00 | Flag Pattern Breakout |
| 9 | PDD Holdings Inc. ADR | NASDAQ: PDD | $146.19 | $148.00 | Symmetrical Triangle Pattern Breakout |
| 10 | ProFrac Holding Corp | NASDAQ: ACDC | $9.01 | $9.15 | Consolidation Area |
Important: Typically, these trades offer a risk: reward ratio of 1:2 or 1:3 in the next 6 months, which implies 2x to 3x rewards when compared to risks. So, be sure to set your stop-loss levels and target prices accordingly to manage your risk. In addition, these trade ideas are triggered using daily closing prices, not intra-day pricing. So, if you participate in these trades, make sure that you only buy the stock once its daily close is above the recommended price level.
That said, here are the top 10 stocks to watch for a breakout, in no particular order.
#1 SilverBow Resources Inc. (NYSE: SBOW)
Sector: Energy • Oil & Gas E&P
Reason: Symmetrical Triangle Pattern Breakout
A symmetrical triangle is a chart pattern formed by two converging trend lines connecting a series of sequential peaks and troughs. These two lines result in the formation of a triangle that appears to be symmetrical.
A symmetrical triangle pattern is usually formed when there is indecision in the price movements and there is uncertainty among the buyers and sellers. This chart pattern represents a period of consolidation before the price breaks out or breaks down. In case a breakout occurs from the upper trend line, it is a strong bullish indication as it signifies the start of a new bullish trend.
Buy Level(s): The stock has currently broken out of a symmetrical triangle pattern. However, the ideal buy level for SBOW is if the stock closes above the immediate resistance level of $38.50. This is marked in the chart below as a green color dotted line.
Daily chart – SBOW
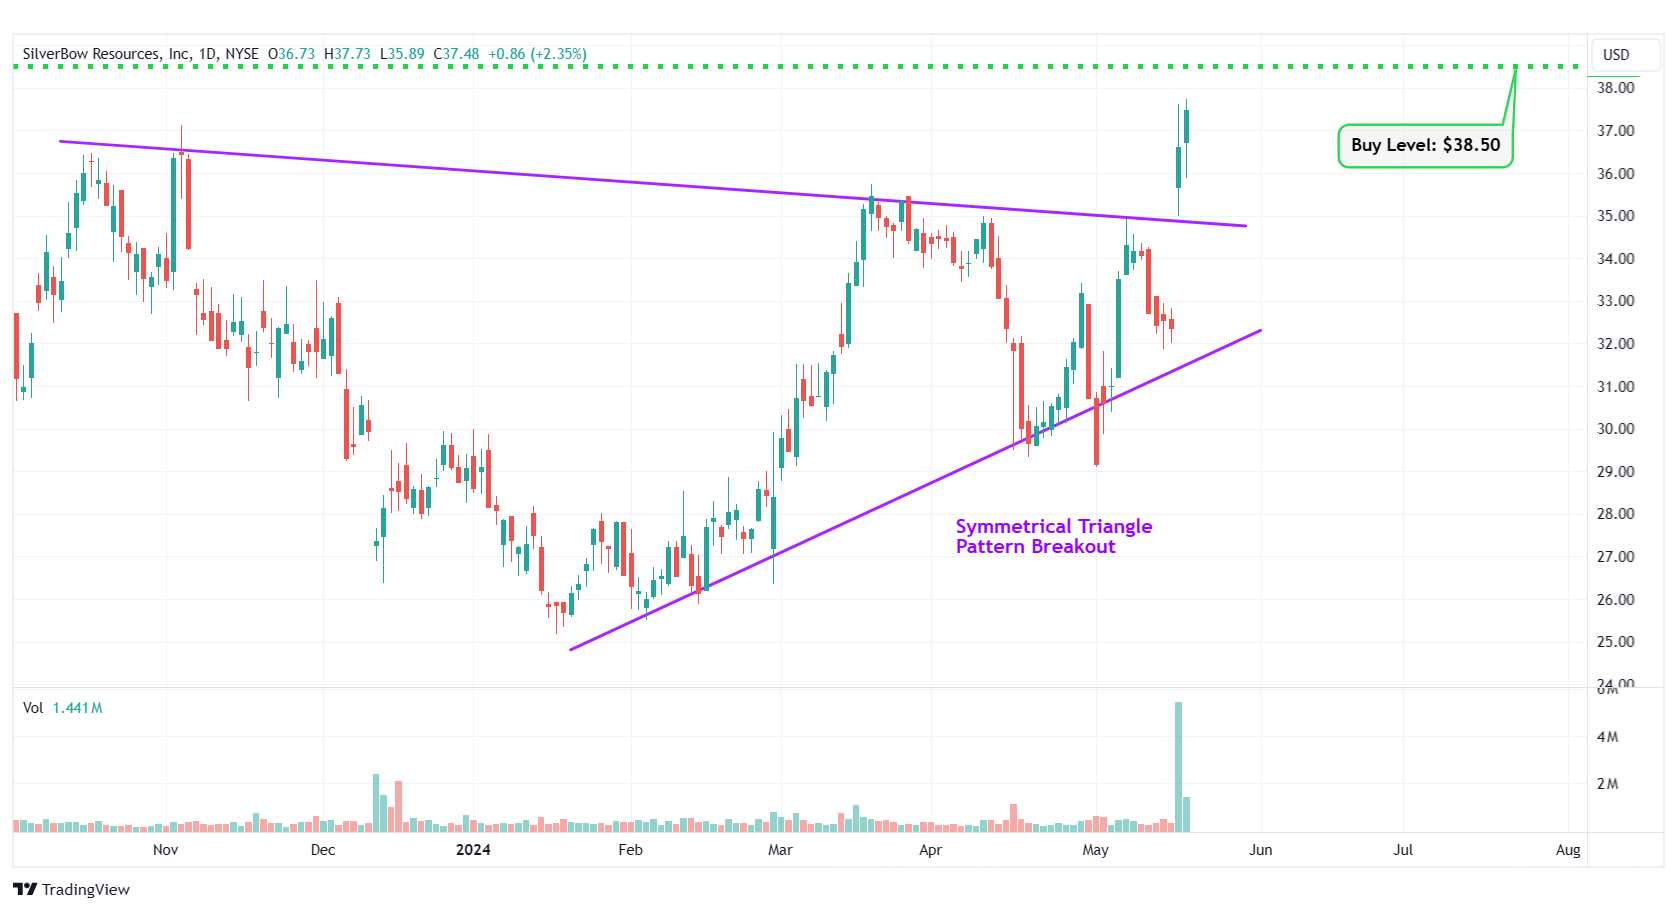
SBOW – Symmetrical Triangle Pattern Breakout
#2 Sigma Lithium Corporation (NASDAQ: SGML)
Sector: Basic Materials • Other Industrial Metals & Mining
Reason: Breakout From a Consolidation Area in the Daily Chart
A Consolidation Area is a price action contained between two parallel lines. It is formed by a lower line that connects the lows, and an upper line that joins the highs. A stock usually trades between the two lines of the consolidation area before finally breaking out from the upper rail.
Buy Level(s): Although the stock has currently broken out of a consolidation area, the ideal buy level for SGML is above the near-term resistance area, which translates to a price of around $19.10. This is marked in the chart below as a green color dotted line.
Daily chart – SGML
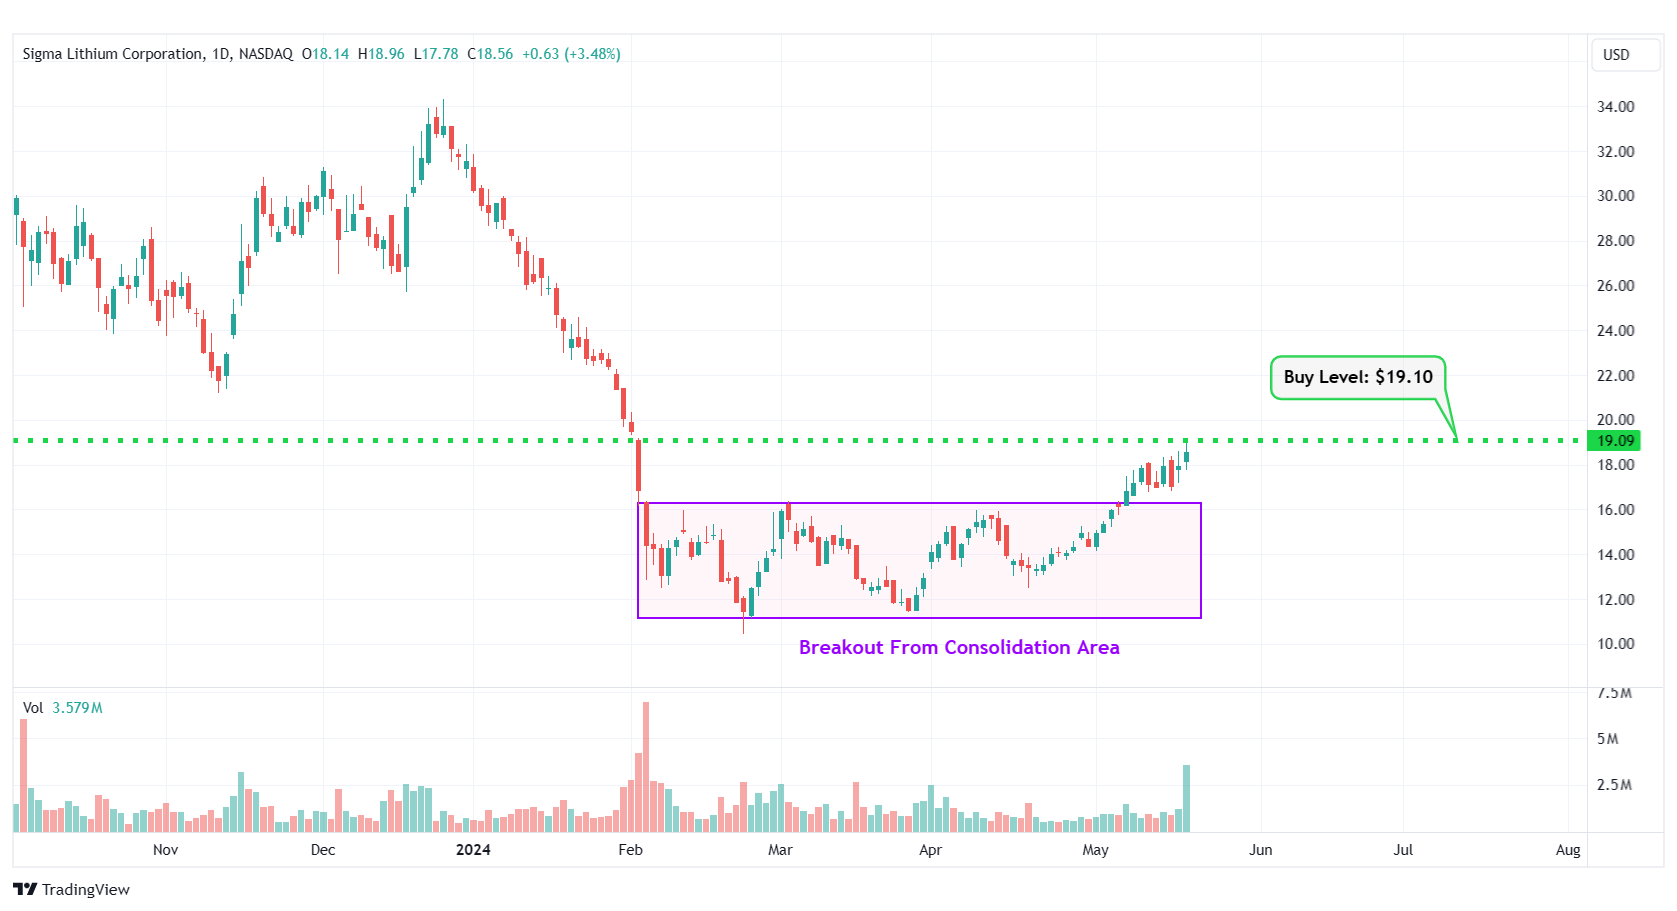
SGML – Breakout From Consolidation Area
#3 Vale S.A. ADR (NYSE: VALE)
Sector: Basic Materials • Other Industrial Metals & Mining
Reason: Falling Wedge Pattern Breakout
A falling wedge pattern is formed by joining two downward-sloping, converging trendlines having a contracting range. The pattern appears to be wide at the top and continues to contract as prices fall. A breakout from a falling wedge pattern can indicate either reversal or continuation depending on where the pattern appeared in the trend.
A stock that has broken out of a falling wedge pattern would have gained momentum and would have the potential to move higher.
Buy Level(s): The stock has currently broken out of a falling wedge pattern. However, the ideal buy level for VALE is above the nearest resistance level of $13.50. This is marked in the chart below as a green color dotted line.
Daily chart – VALE
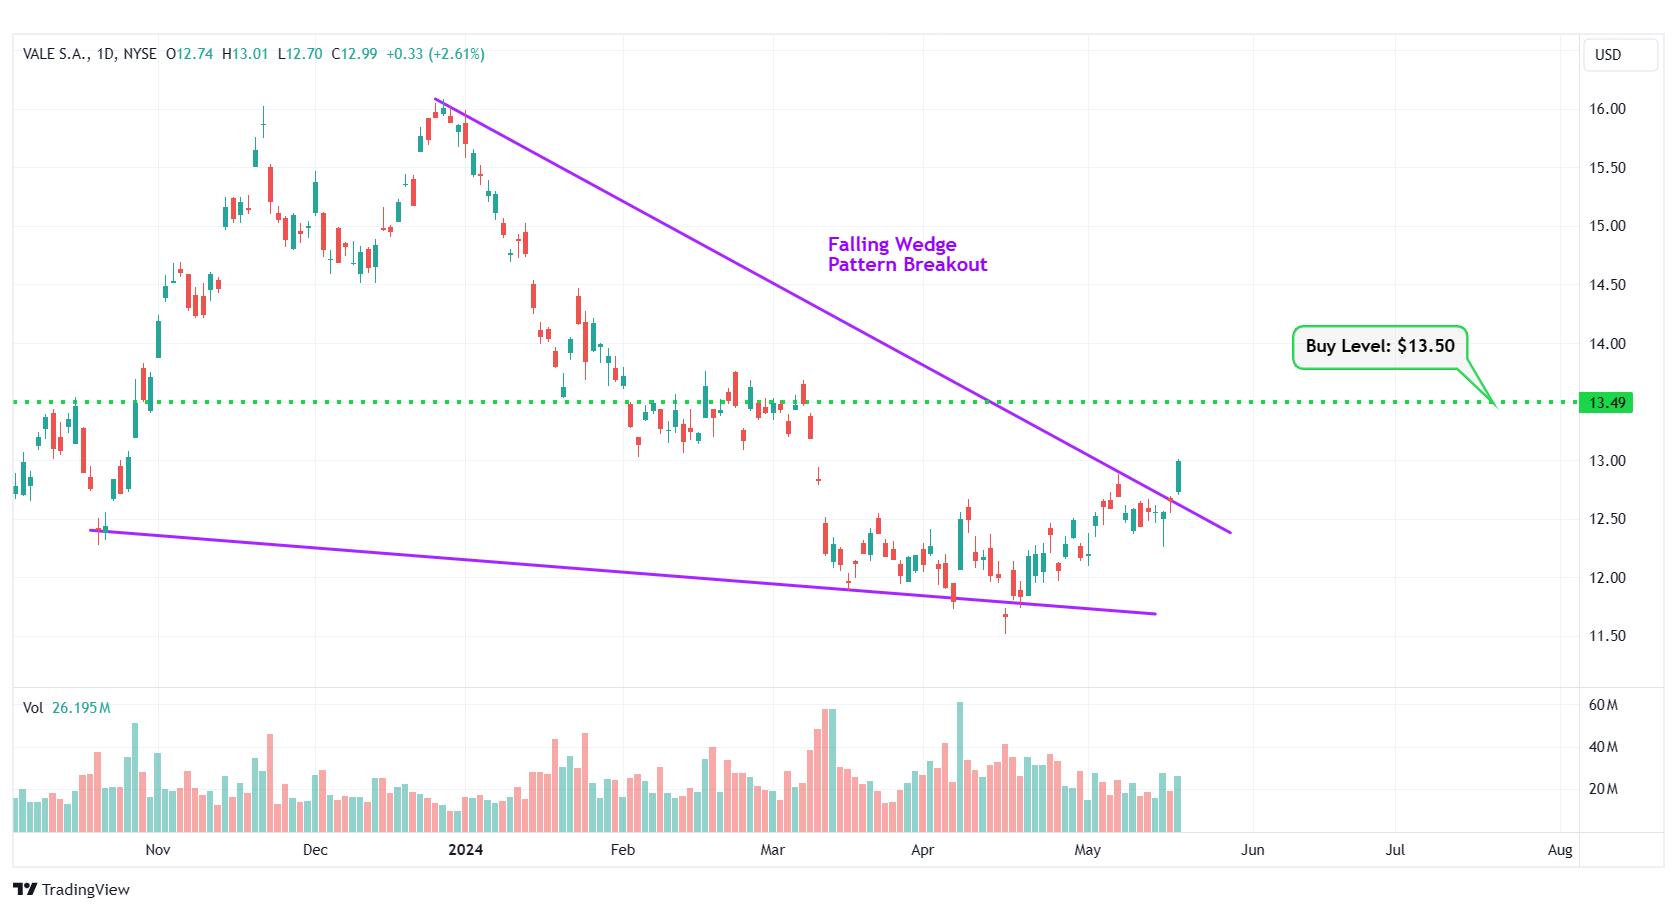
VALE – Falling Wedge Pattern Breakout
#4 Seabridge Gold, Inc. (NYSE: SA)
Sector: Basic Materials • Gold
Reason: Formation of a Flag Pattern
A flag pattern is a short-term continuation pattern that marks a small consolidation before the previous move resumes. The pattern is formed when the market consolidates in a narrow range after a sharp move. For a stock in an uptrend, a breakout from this pattern is typically a strong bullish indication.
Buy Level(s): The ideal buy level for SA is if the stock breaks out of the flag pattern, at around $16.00. This is marked in the chart below as a green color dotted line.
Daily chart – SA
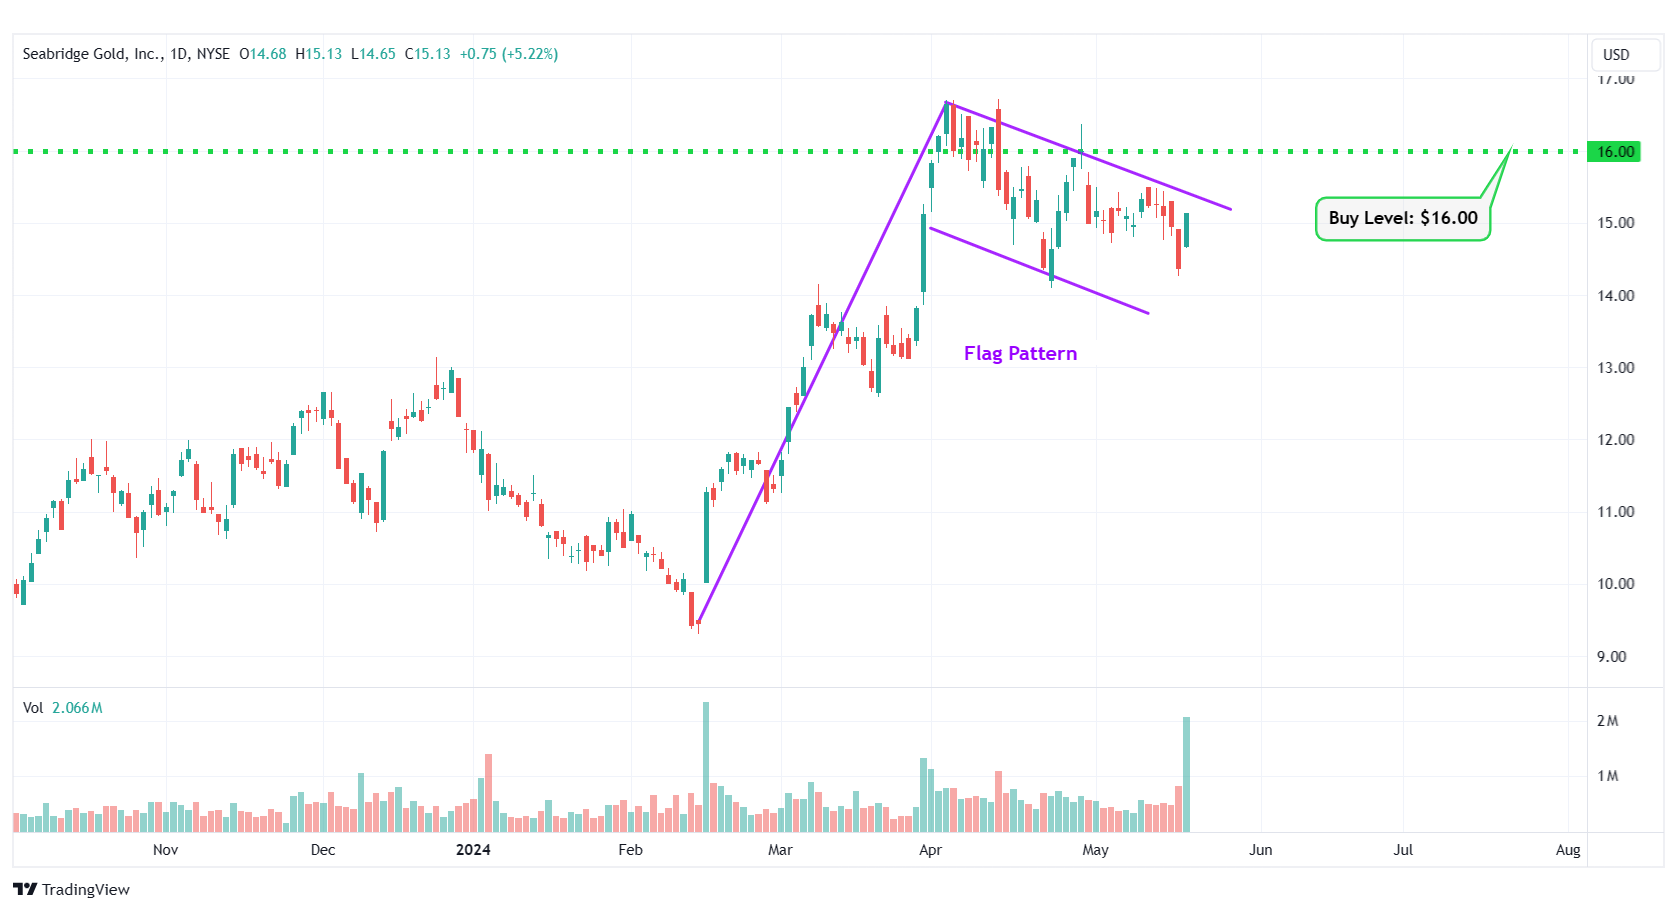
SA – Flag Pattern
#5 ZTO Express Inc. ADR (NYSE: ZTO)
Sector: Industrials • Integrated Freight & Logistics
Reason: Symmetrical Triangle Pattern Breakout
A symmetrical triangle is a chart pattern formed by two converging trend lines connecting a series of sequential peaks and troughs. These two lines result in the formation of a triangle that appears to be symmetrical.
A symmetrical triangle pattern is usually formed when there is indecision in the price movements and there is uncertainty among the buyers and sellers. This chart pattern represents a period of consolidation before the price breaks out or breaks down. In case a breakout occurs from the upper trend line, it is a strong bullish indication as it signifies the start of a new bullish trend.
Buy Level(s): The stock has currently broken out of a symmetrical triangle pattern. However, the ideal buy level for ZTO is if the stock closes above the immediate resistance level of $24.70. This is marked in the chart below as a green color dotted line.
Daily chart – ZTO
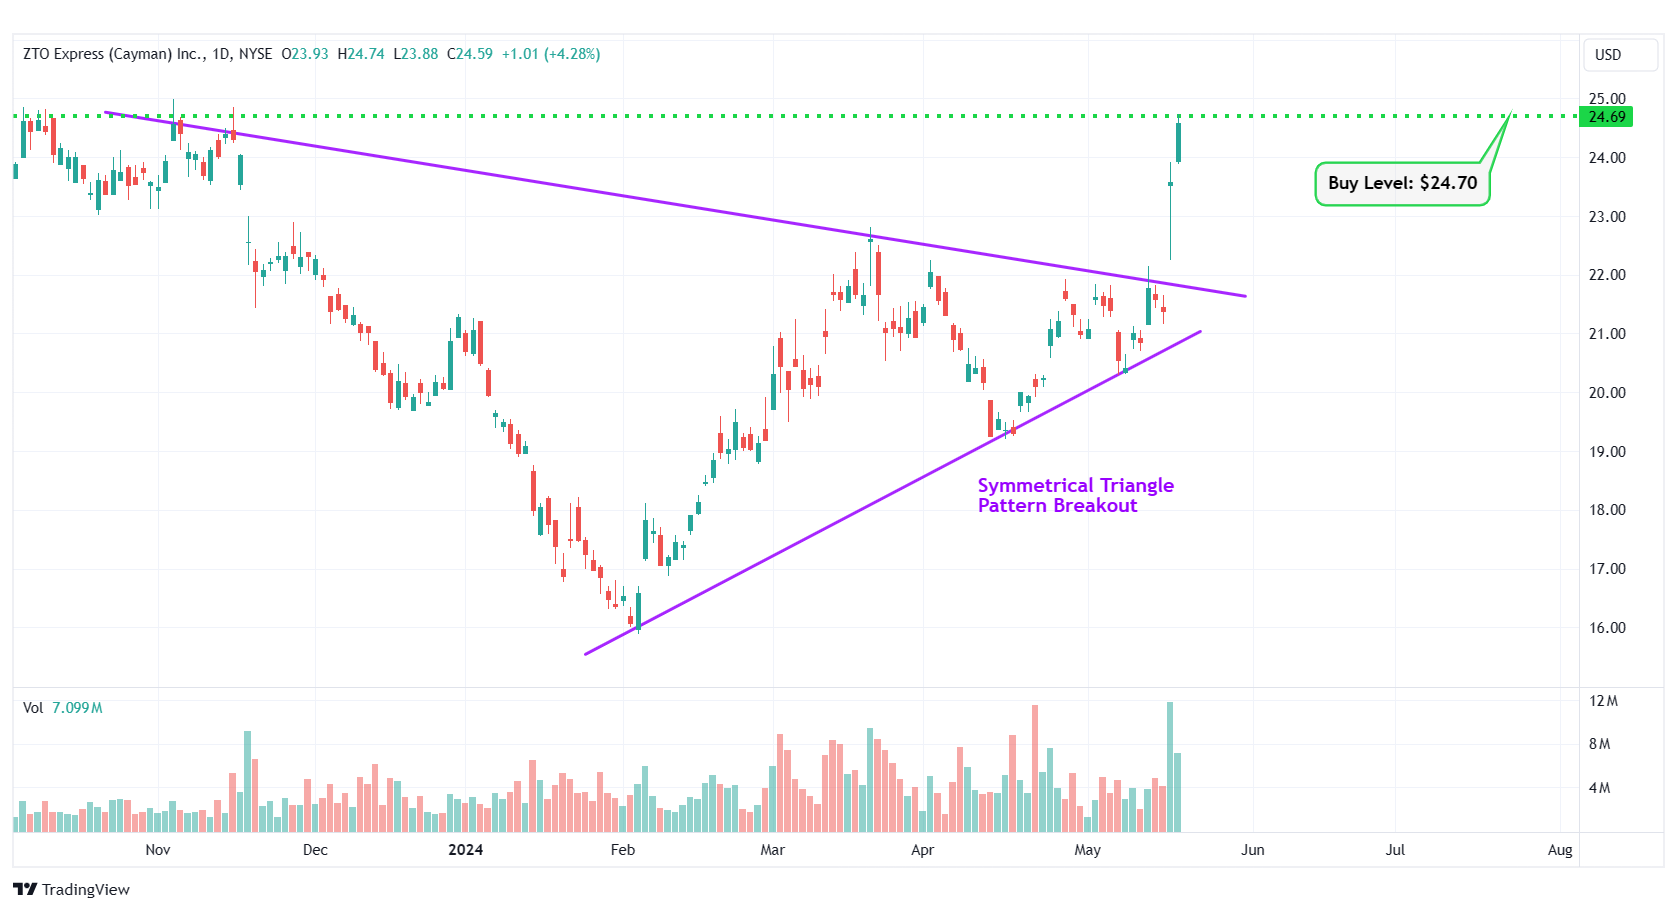
ZTO – Symmetrical Triangle Pattern Breakout
#6 Newmark Group Inc. (NASDAQ: NMRK)
Sector: Real Estate • Real Estate Services
Reason: Formation of a Consolidation Area in the Daily Chart
A Consolidation Area is a price action contained between two parallel lines. It is formed by a lower line that connects the lows, and an upper line that joins the highs. A stock usually trades between the two lines of the consolidation area before finally breaking out from the upper rail.
Buy Level(s): The ideal buy level for NMRK is above the breakout level of the consolidation area, at around $11.40. This is marked in the chart below as a green color dotted line.
Daily chart – NMRK
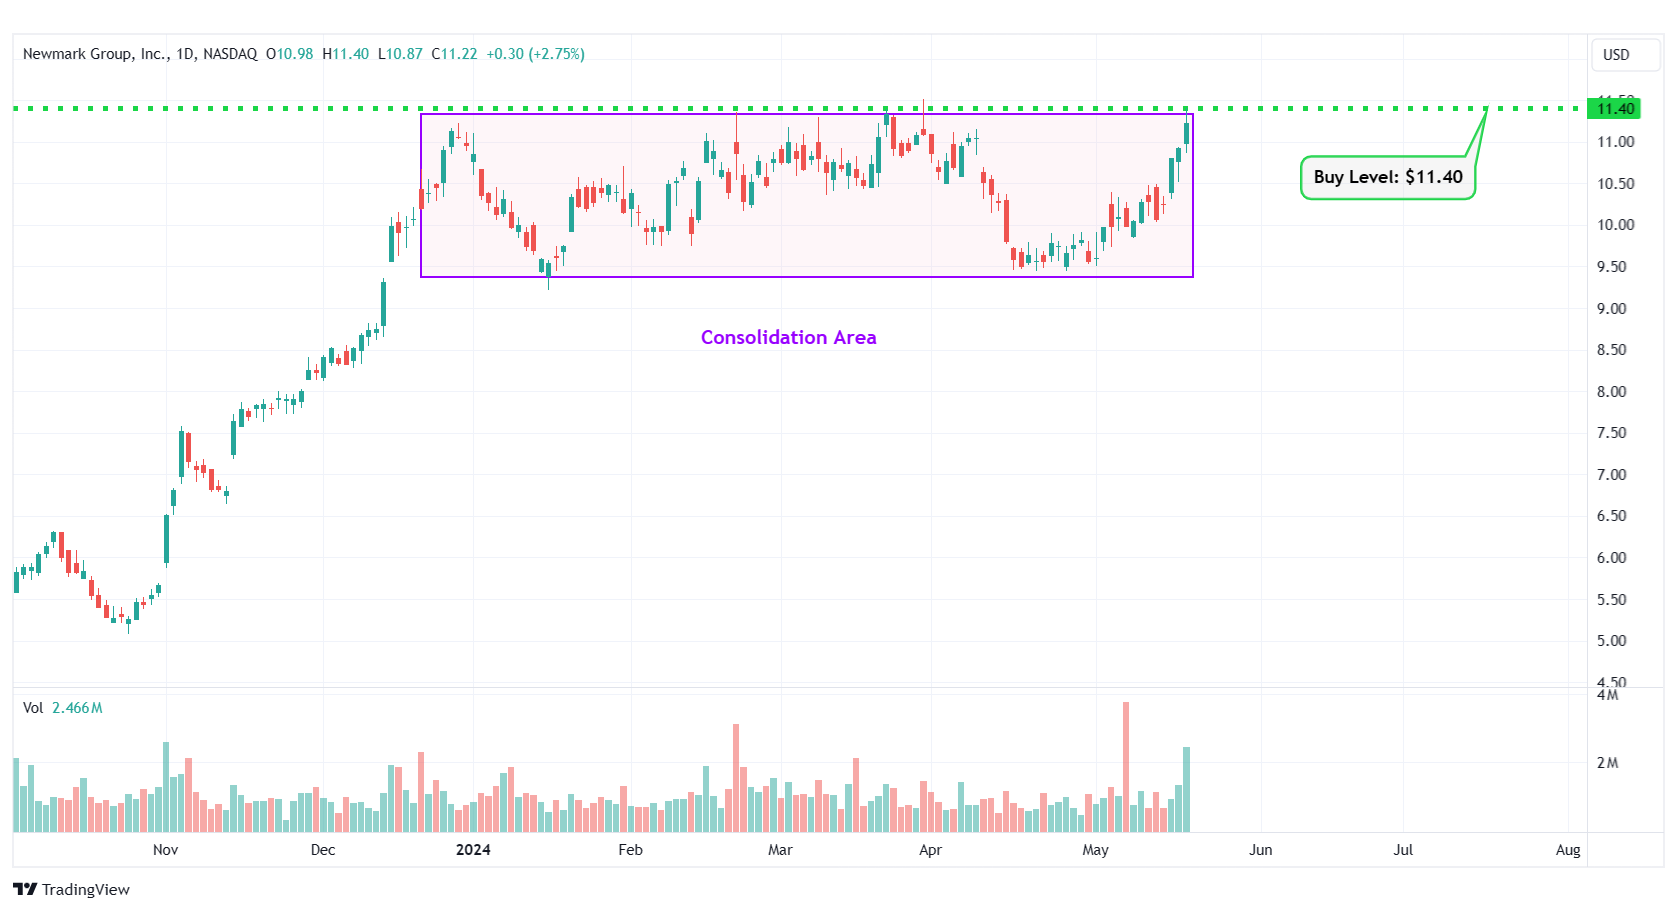
NMRK – Consolidation Area
#7 Prudential Financial Inc. (NYSE: PRU)
Sector: Financial • Insurance – Life
Reason: Formation of an Uptrend Channel
An uptrend channel or an ascending channel is the price action contained between upward sloping parallel lines. It is formed by a lower trend line that connects the swing lows, and an upper channel line that joins the swing highs. A stock usually trades between the two rails of the uptrend channel before finally breaking out from the upper rail.
Buy Level(s): The ideal buy level for PRU is if the stock breaks out of the uptrend channel and has a daily close above $122.00. This is marked in the chart below as a green color dotted line.
Daily chart – PRU
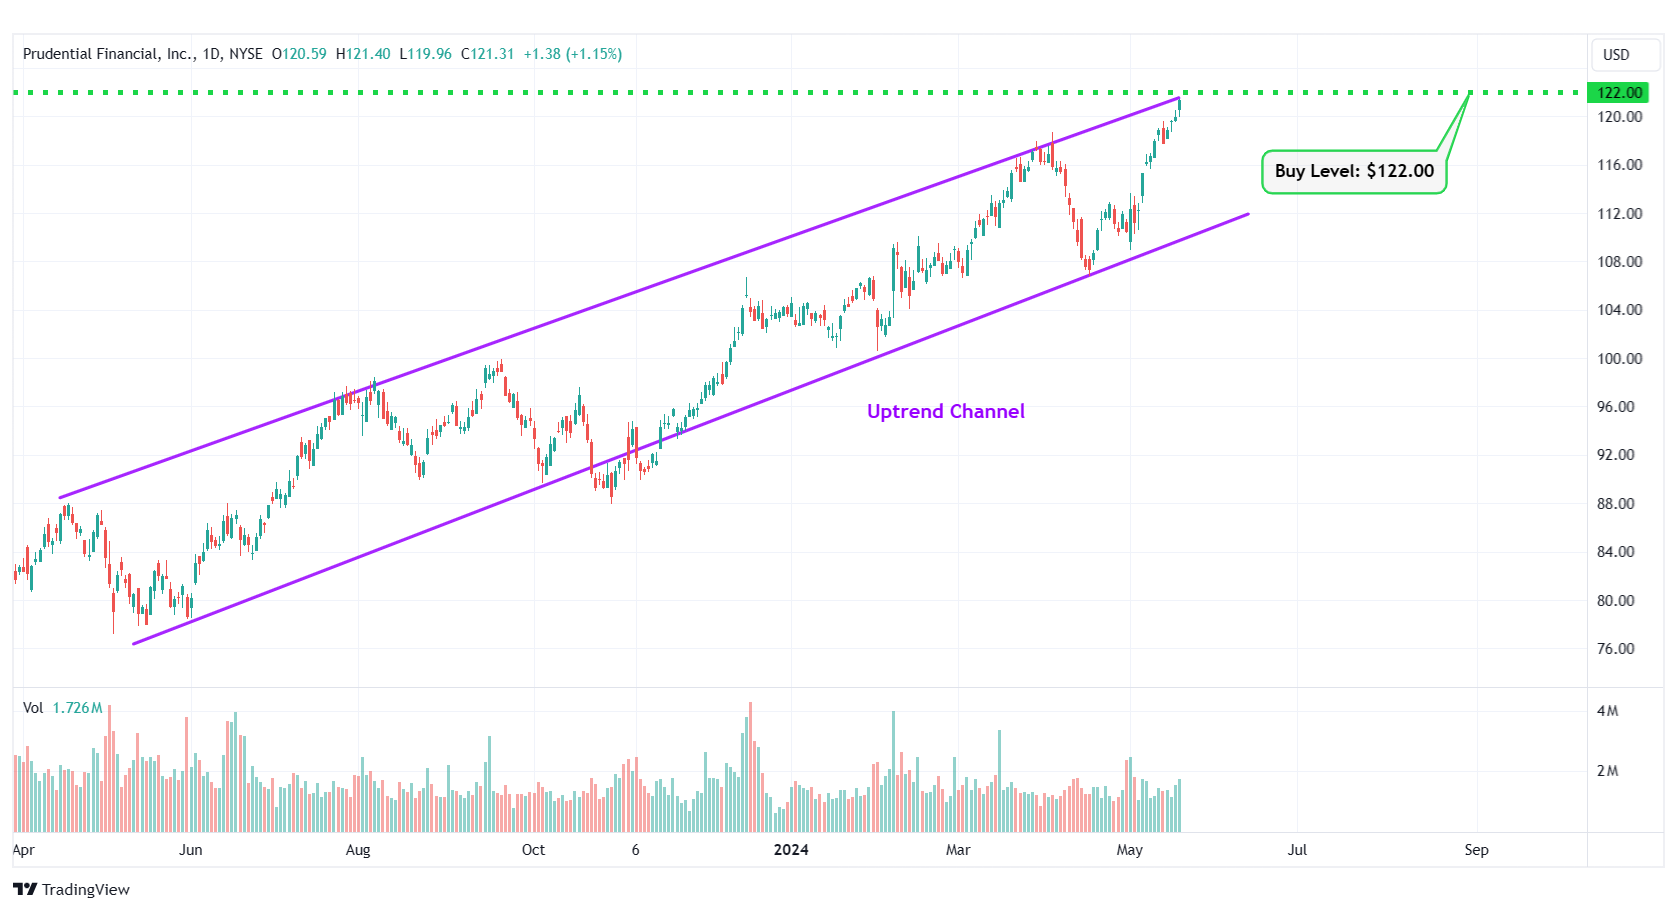
PRU – Uptrend Channel
#8 Chubb Limited (NYSE: CB)
Sector: Financial • Insurance – Property & Casualty
Reason: Breakout From a Flag Pattern
A flag pattern is a short-term continuation pattern that marks a small consolidation before the previous move resumes. The pattern is formed when the market consolidates in a narrow range after a sharp move. For a stock in an uptrend, a breakout from this pattern is typically a strong bullish indication.
Buy Level(s): Although the stock has currently broken out of the flag pattern, the ideal buy level for CB is above the near-term resistance level of $276.00. This is marked in the chart below as a green color dotted line.
Daily chart – CB
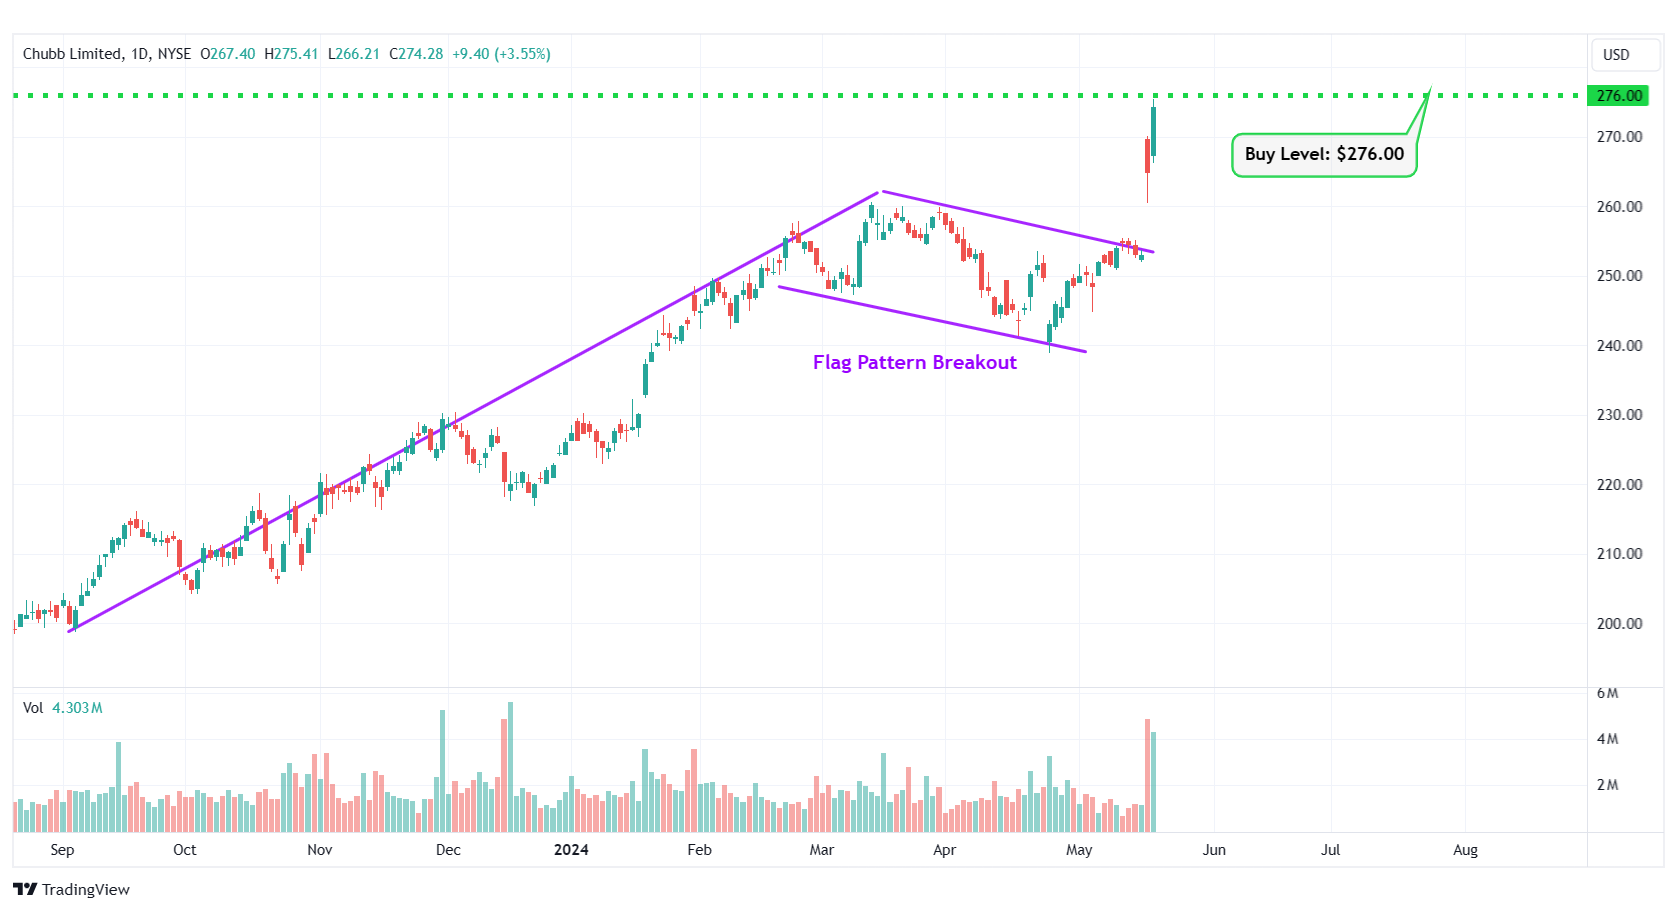
CB – Flag Pattern Breakout
#9 PDD Holdings Inc. ADR (NASDAQ: PDD)
Sector: Consumer Cyclical • Internet Retail
Reason: Symmetrical Triangle Pattern Breakout
A symmetrical triangle is a chart pattern formed by two converging trend lines connecting a series of sequential peaks and troughs. These two lines result in the formation of a triangle that appears to be symmetrical.
A symmetrical triangle pattern is usually formed when there is indecision in the price movements and there is uncertainty among the buyers and sellers. This chart pattern represents a period of consolidation before the price breaks out or breaks down. In case a breakout occurs from the upper trend line, it is a strong bullish indication as it signifies the start of a new bullish trend.
Buy Level(s): The stock has currently broken out of a symmetrical triangle pattern. However, the ideal buy level for PDD is if the stock closes above the immediate resistance level of $148.00. This is marked in the chart below as a green color dotted line.
Daily chart – PDD
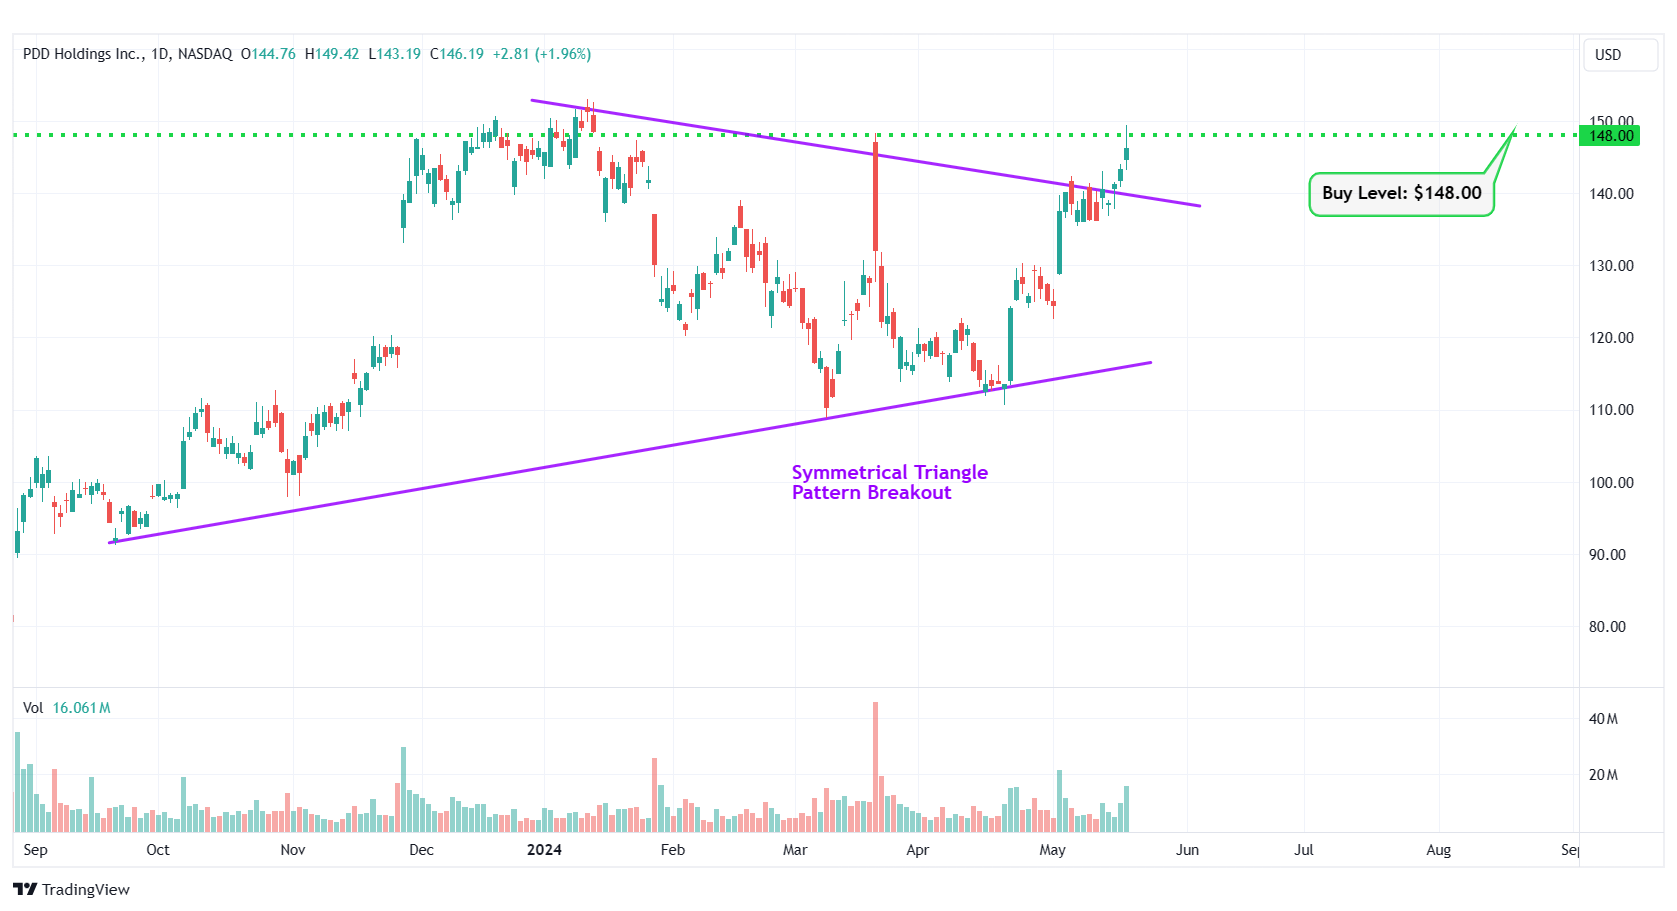
PDD – Symmetrical Triangle Pattern Breakout
#10 ProFrac Holding Corp (NASDAQ: ACDC)
Sector: Energy • Oil & Gas Equipment & Services
Reason: Formation of a Consolidation Area in the Daily Chart
A Consolidation Area is a price action contained between two parallel lines. It is formed by a lower line that connects the lows, and an upper line that joins the highs. A stock usually trades between the two lines of the consolidation area before finally breaking out from the upper rail.
Buy Level(s): The ideal buy level for ACDC is above the breakout level of the consolidation area, at around $9.15. This is marked in the chart below as a green color dotted line.
Daily chart – ACDC
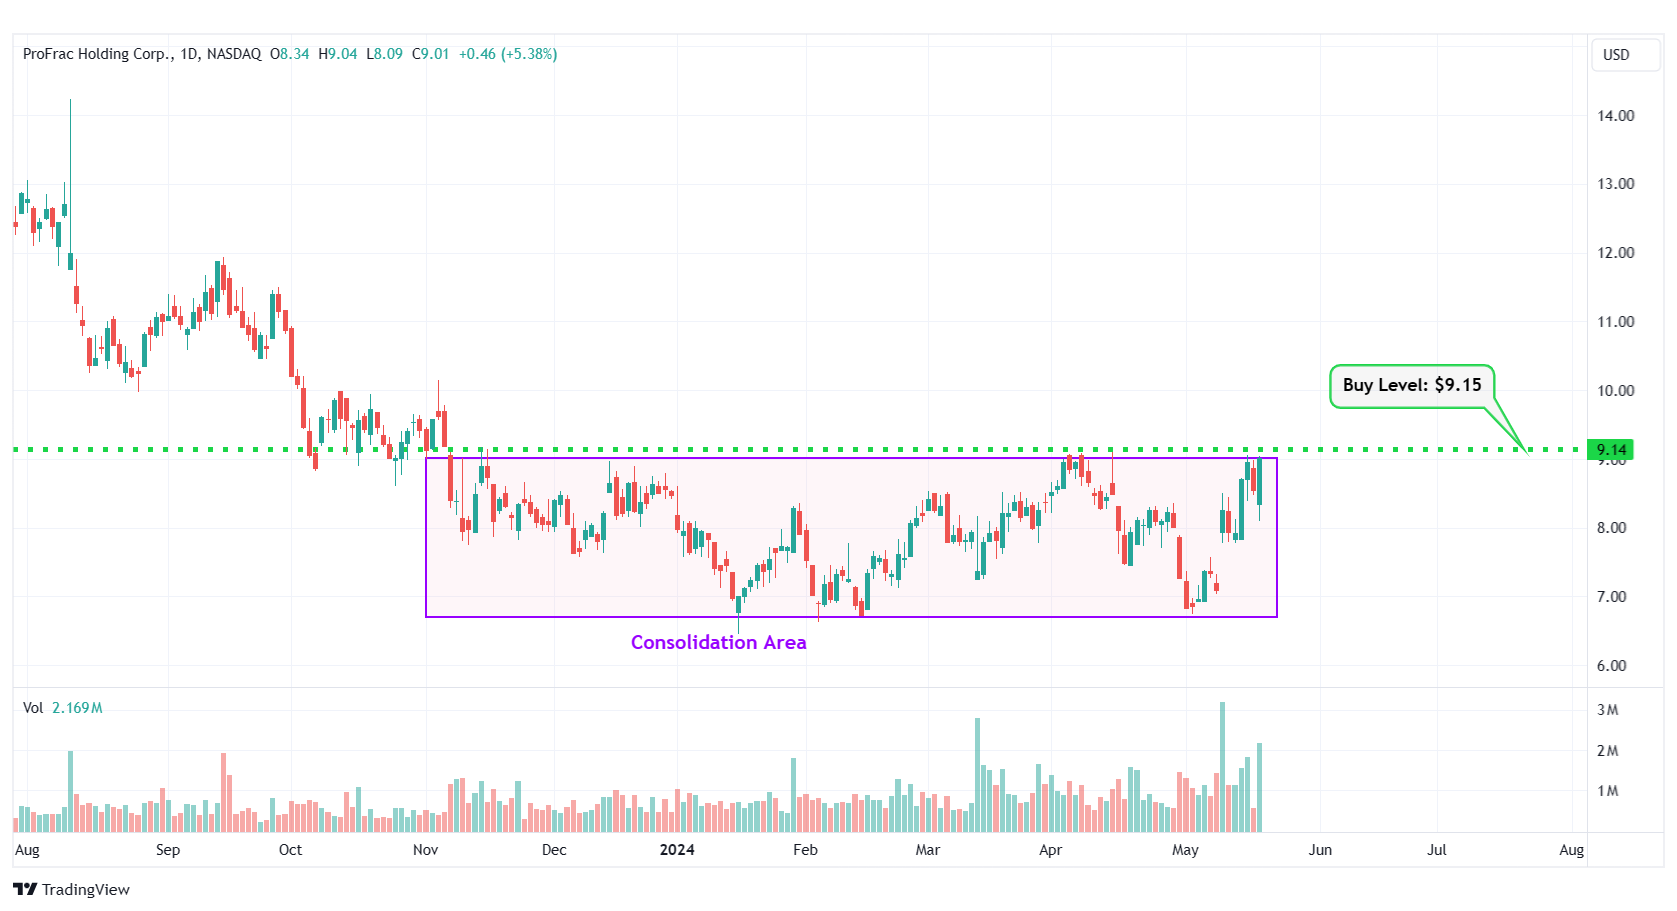
ACDC – Consolidation Area
Happy Trading!
Trades of The Day Research Team
Everyone wants to know when to buy, sell, or hold a stock. FAST Graphs reveals this by clearly illustrating the value of the business relative to its stock price. Get 25% off using Daily Trade Alert's special referral link and coupon code AFFILIATE25
Source: Trades of the Day
