
Picking a winning trade on a consistent basis is not simply a stroke of luck. It’s the result of calculated screening, planning, and deliberation.
With this in mind, we have started a new weekly series on our top 10 stocks to watch this week — stocks that look poised for a possible breakout in the coming days. Traders should add these stocks to their watchlist now.
The Top 10 Stocks to Watch This Week for Possible Breakouts
| Sl # | Name of the Stock | Stock Ticker | Last Close | Buy Level(s) | Reason |
| 1 | H&R Block Inc. | NYSE: HRB | $53.53 | $54.00 | Breakout From Consolidation Area |
| 2 | ITeos Therapeutics Inc. | NASDAQ: ITOS | $17.44 | $18.10 | Symmetrical Triangle Pattern Breakout |
| 3 | Taiwan Semiconductor Manufacturing ADR | NYSE: TSM | $149.26 | $150.60 | Flag Pattern Breakout |
| 4 | American Water Works Co. Inc. | NYSE: AWK | $135.50 | $136.00 | Downtrend Channel Breakout |
| 5 | McDonald’s Corp | NYSE: MCD | $275.00 | $278.20 | Symmetrical Triangle Pattern |
| 6 | Shift4 Payments Inc. | NYSE: FOUR | $65.08 | $67.50 | Falling Wedge Pattern Breakout |
| 7 | Arista Networks Inc. | NYSE: ANET | $314.03 | $316.00 | Flag Pattern Breakout |
| 8 | Sensus Healthcare Inc. | NASDAQ: SRTS | $5.29 | $5.40 | Symmetrical Triangle Pattern Breakout |
| 9 | Hilton Worldwide Holdings Inc. | NYSE: HLT | $208.08 | $211.00 | Flag Pattern Breakout |
| 10 | Caredx Inc. | NASDAQ: CDNA | $14.83 | $15.60 | Symmetrical Triangle Pattern Breakout |
Important: Typically, these trades offer a risk: reward ratio of 1:2 or 1:3 in the next 6 months, which implies 2x to 3x rewards when compared to risks. So, be sure to set your stop-loss levels and target prices accordingly to manage your risk. In addition, these trade ideas are triggered using daily closing prices, not intra-day pricing. So, if you participate in these trades, make sure that you only buy the stock once its daily close is above the recommended price level.
That said, here are the top 10 stocks to watch for a breakout, in no particular order.
#1 H&R Block Inc. (NYSE: HRB)
Sector: Consumer Cyclical • Personal Services
Reason: Breakout From a Consolidation Area in the Daily Chart
A Consolidation Area is a price action contained between two parallel lines. It is formed by a lower line that connects the lows, and an upper line that joins the highs. A stock usually trades between the two lines of the consolidation area before finally breaking out from the upper rail.
Buy Level(s): Although the stock has currently broken out of a consolidation area, the ideal buy level for HRB is above the near-term resistance area, which translates to a price of around $54.00. This is marked in the chart below as a green color dotted line.
Daily chart – HRB

HRB – Breakout From Consolidation Area
#2 ITeos Therapeutics Inc. (NASDAQ: ITOS)
Sector: Healthcare • Biotechnology
Reason: Symmetrical Triangle Pattern Breakout
A symmetrical triangle is a chart pattern formed by two converging trend lines connecting a series of sequential peaks and troughs. These two lines result in the formation of a triangle that appears to be symmetrical.
A symmetrical triangle pattern is usually formed when there is indecision in the price movements and there is uncertainty among the buyers and sellers. This chart pattern represents a period of consolidation before the price breaks out or breaks down. In case a breakout occurs from the upper trend line, it is a strong bullish indication as it signifies the start of a new bullish trend.
Buy Level(s): The stock has currently broken out of a symmetrical triangle pattern. However, the ideal buy level for ITOS is if the stock closes above the immediate resistance level of $18.10. This is marked in the chart below as a green color dotted line.
Daily chart – ITOS
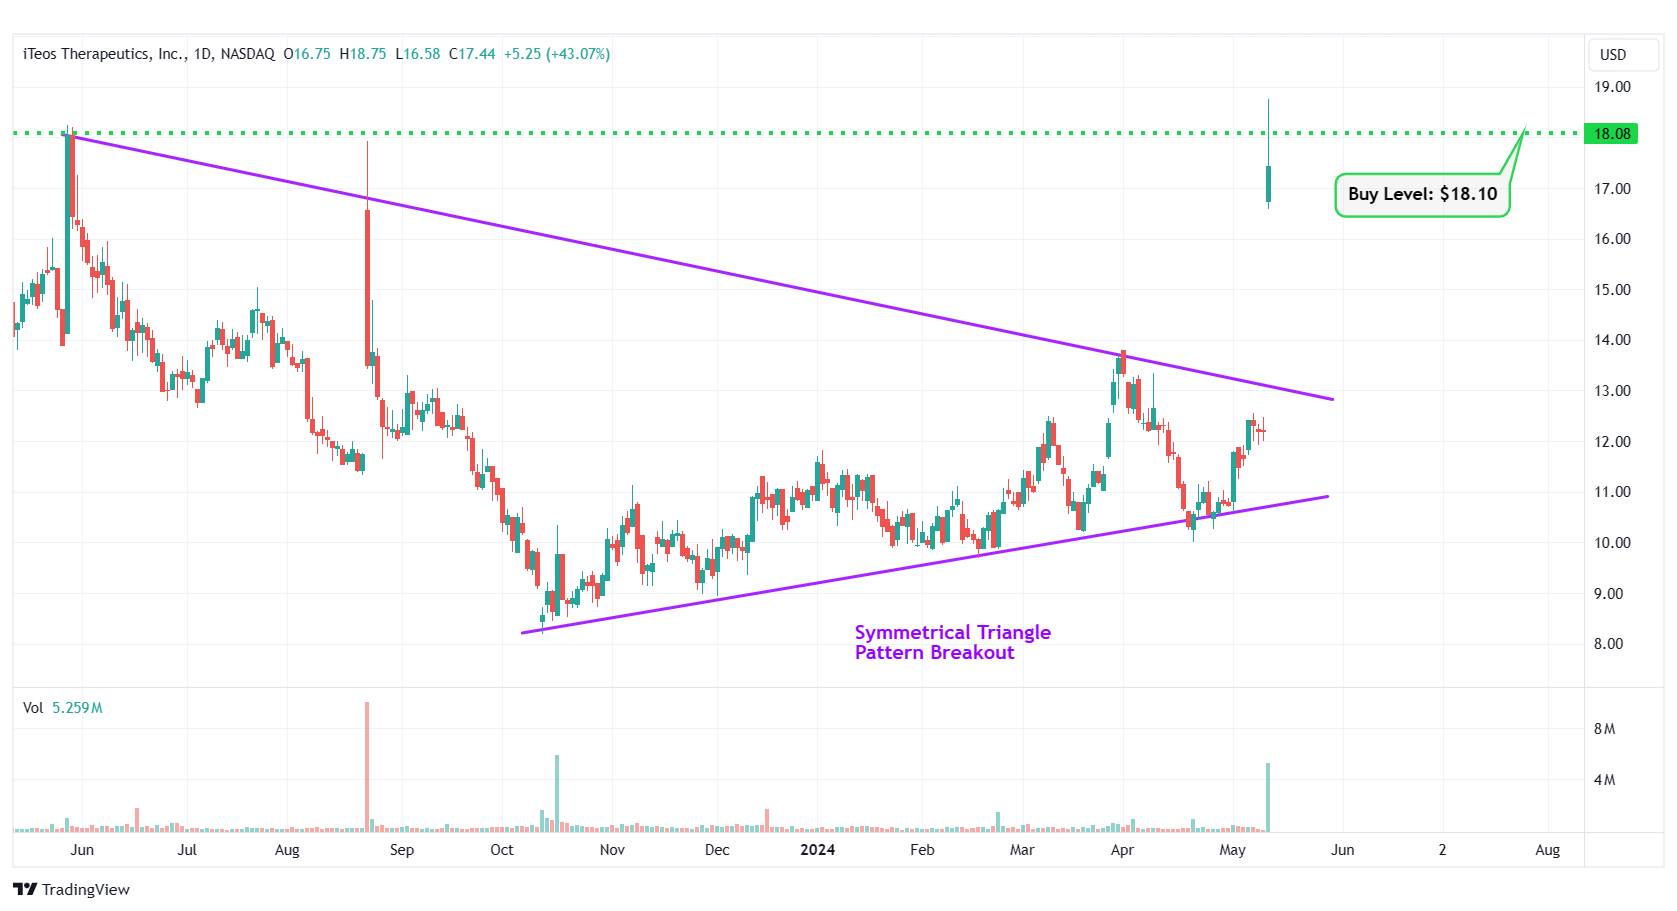
ITOS – Symmetrical Triangle Pattern Breakout
#3 Taiwan Semiconductor Manufacturing ADR (NYSE: TSM)
Sector: Technology • Semiconductors
Reason: Breakout From a Flag Pattern
A flag pattern is a short-term continuation pattern that marks a small consolidation before the previous move resumes. The pattern is formed when the market consolidates in a narrow range after a sharp move. For a stock in an uptrend, a breakout from this pattern is typically a strong bullish indication.
Buy Level(s): Although the stock has currently broken out of the flag pattern, the ideal buy level for TSM is above the near-term resistance level of $150.60. This is marked in the chart below as a green color dotted line.
Daily chart – TSM
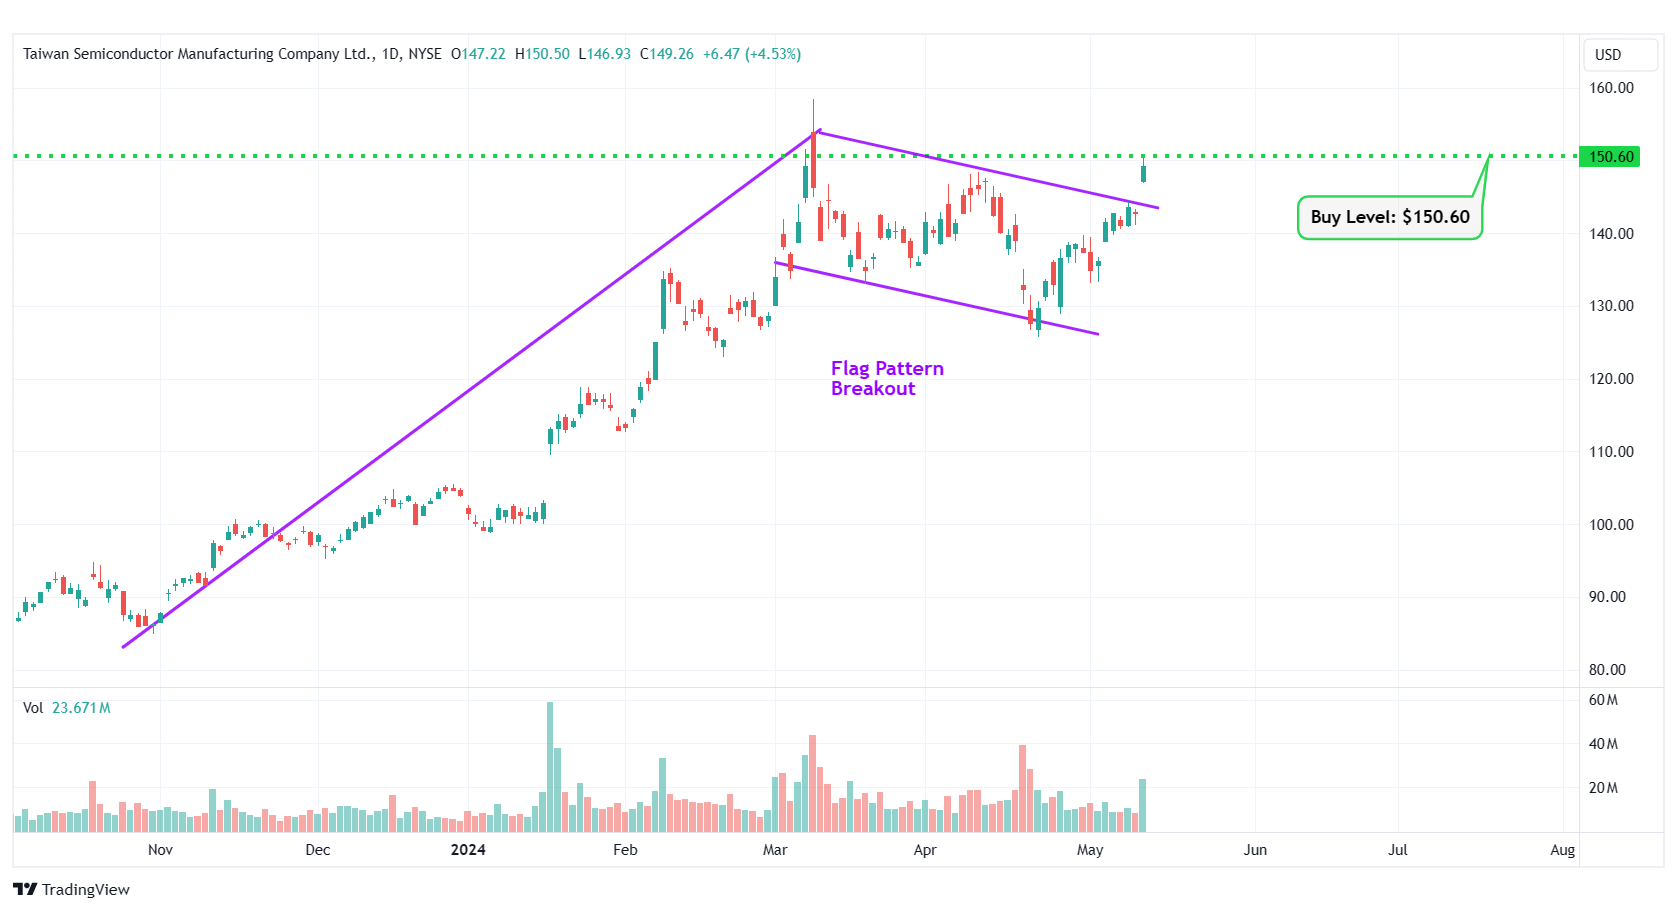
TSM – Flag Pattern Breakout
#4 American Water Works Co. Inc. (NYSE: AWK)
Sector: Utilities • Utilities – Regulated Water
Reason: Downtrend Channel Breakout
A downtrend or descending channel is the price action contained between downward sloping parallel lines. It is formed by two lines that are drawn by connecting the lower highs and lower lows of a stock’s price. Even though this is typically a bearish pattern, a breakout from the upper rail of this pattern is considered a good bullish indication.
Buy Level(s): The daily chart shows that the stock has currently broken out of a downtrend channel. However, there is a near-term resistance level for the stock. Hence, the ideal buy level for AWK is if the stock has a daily close above $136.00. This is marked in the chart below as a green color dotted line.
Daily chart – AWK
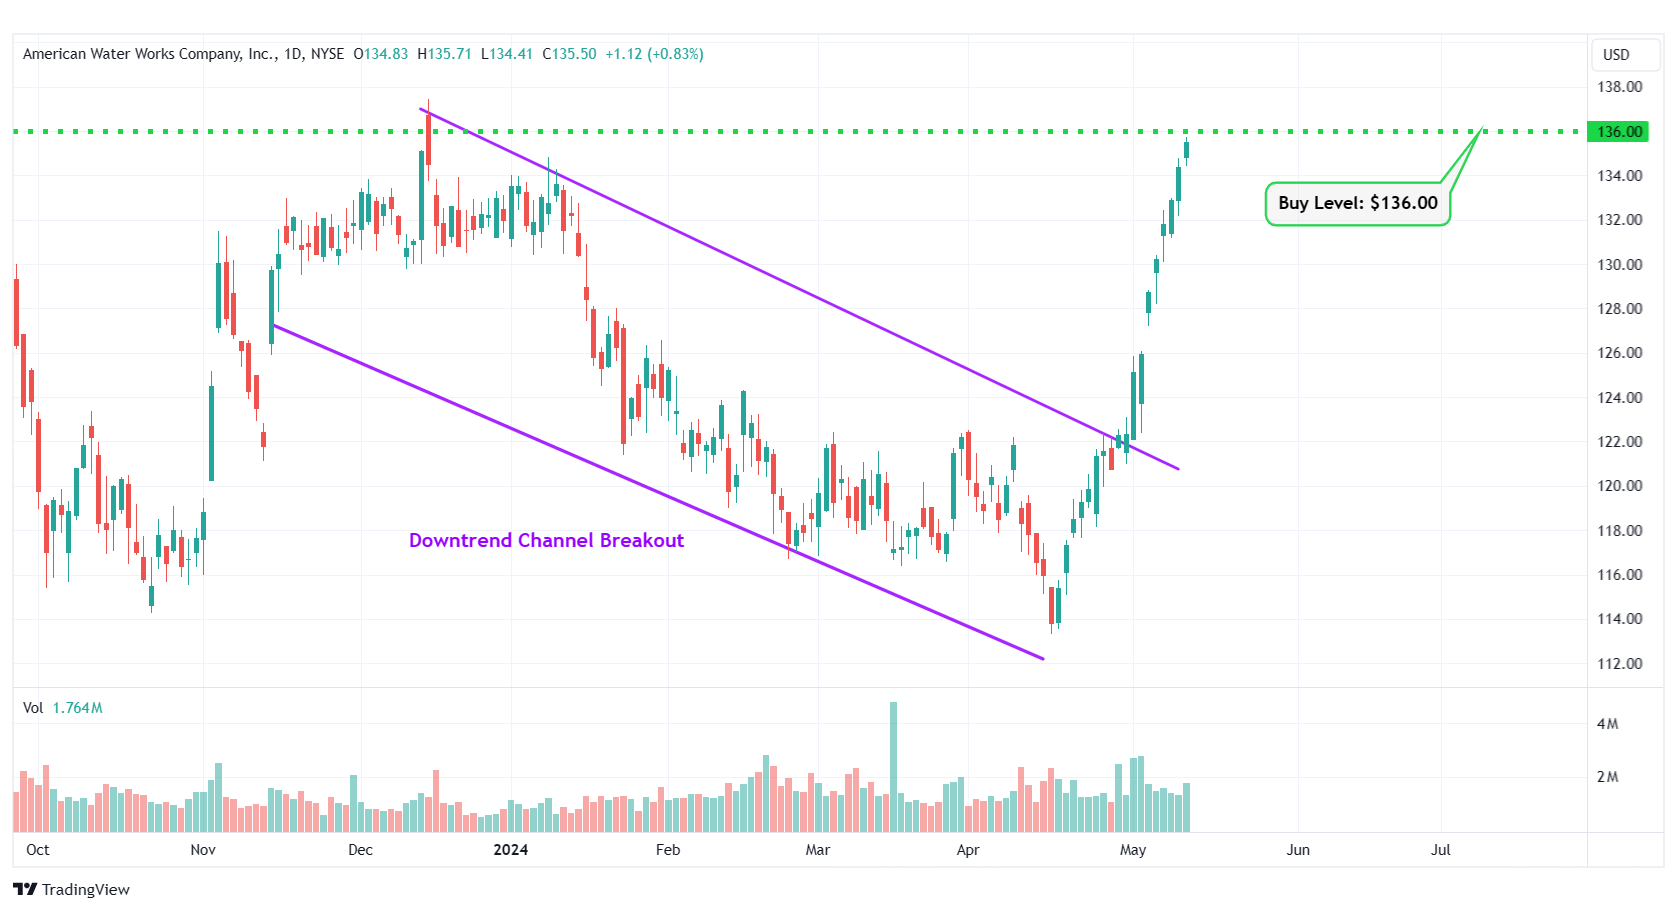
AWK – Downtrend Channel Breakout
#5 McDonald’s Corp (NYSE: MCD)
Sector: Consumer Cyclical • Restaurants
Reason: Formation of a Symmetrical Triangle Pattern
A symmetrical triangle is a chart pattern formed by two converging trend lines connecting a series of sequential peaks and troughs. These two lines result in the formation of a triangle that appears to be symmetrical.
A symmetrical triangle pattern is usually formed when there is indecision in the price movements and there is uncertainty among the buyers and sellers. This chart pattern represents a period of consolidation before the price breaks out or breaks down. In case a breakout occurs from the upper trend line, it is a strong bullish indication as it signifies the start of a new bullish trend.
Buy Level(s): The ideal buy level for MCD is if the stock has a daily close above the breakout level of the symmetrical triangle pattern, at around $278.20. This is marked in the chart below as a green color dotted line.
Daily chart – MCD

MCD – Symmetrical Triangle Pattern
#6 Shift4 Payments Inc. (NYSE: FOUR)
Sector: Technology • Software – Infrastructure
Reason: Falling Wedge Pattern Breakout
A falling wedge pattern is formed by joining two downward-sloping, converging trendlines having a contracting range. The pattern appears to be wide at the top and continues to contract as prices fall. A breakout from a falling wedge pattern can indicate either reversal or continuation depending on where the pattern appeared in the trend.
A stock that has broken out of a falling wedge pattern would have gained momentum and would have the potential to move higher.
Buy Level(s): The stock has currently broken out of a falling wedge pattern. However, the ideal buy level for FOUR is above the nearest resistance level of $67.50. This is marked in the chart below as a green color dotted line.
Daily chart – FOUR
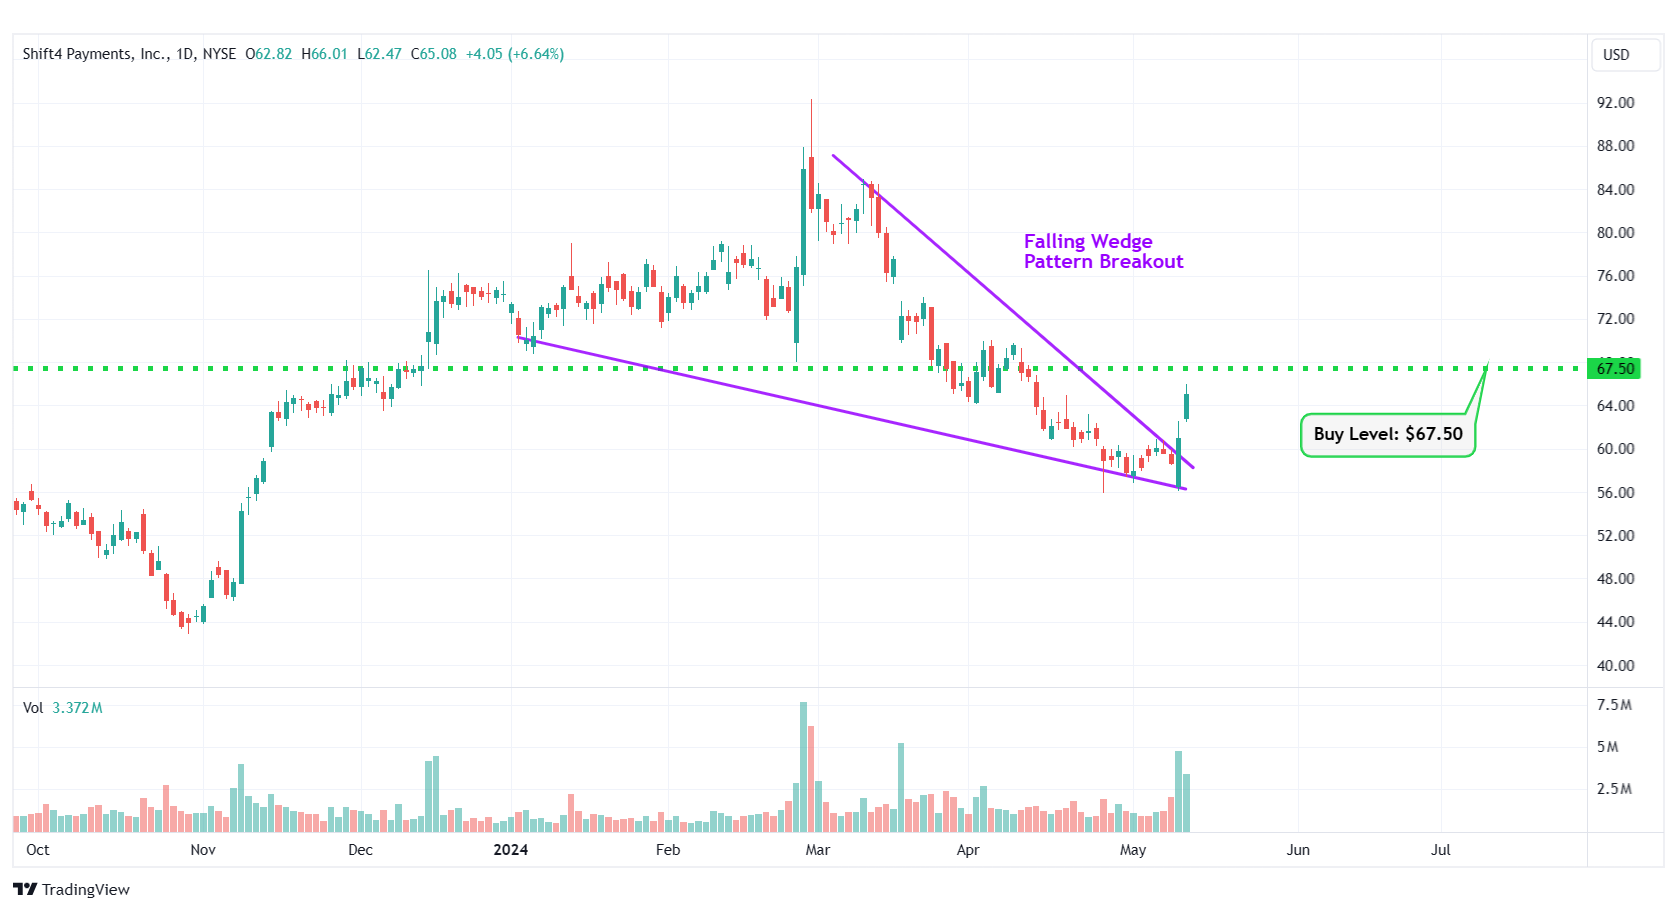
FOUR – Falling Wedge Pattern Breakout
#7 Arista Networks Inc. (NYSE: ANET)
Sector: Technology • Computer Hardware
Reason: Breakout From a Flag Pattern
A flag pattern is a short-term continuation pattern that marks a small consolidation before the previous move resumes. The pattern is formed when the market consolidates in a narrow range after a sharp move. For a stock in an uptrend, a breakout from this pattern is typically a strong bullish indication.
Buy Level(s): Although the stock has currently broken out of the flag pattern, the ideal buy level for ANET is above the near-term resistance level of $316.00. This is marked in the chart below as a green color dotted line.
Daily chart – ANET
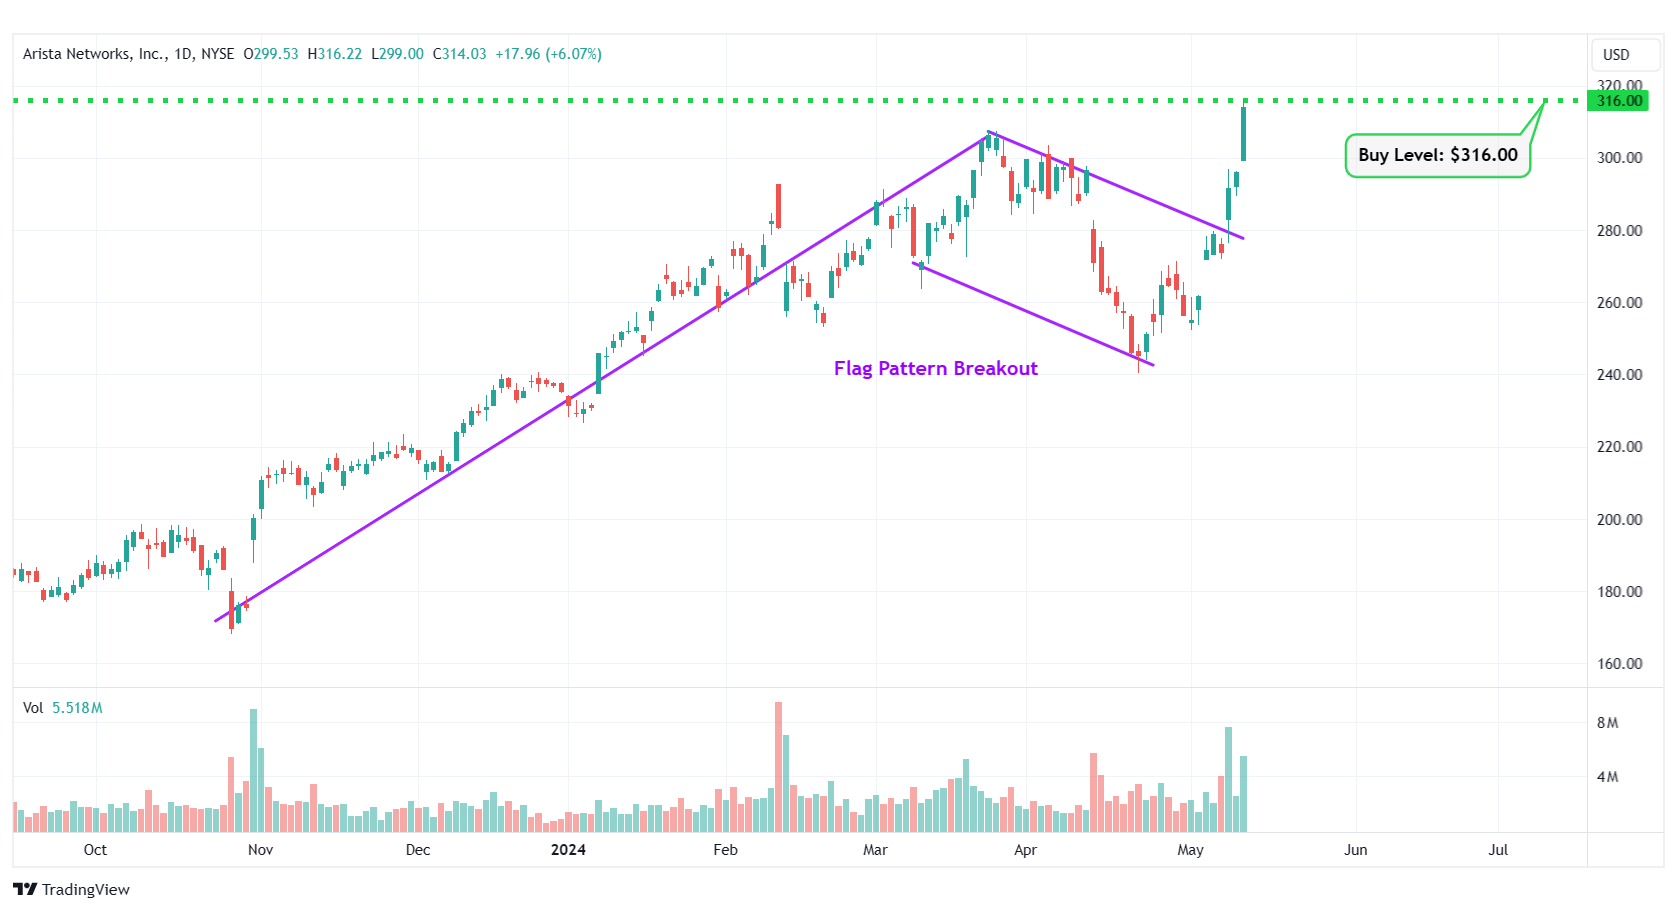
ANET – Flag Pattern Breakout
#8 Sensus Healthcare Inc. (NASDAQ: SRTS)
Sector: Healthcare • Medical Devices
Reason: Symmetrical Triangle Pattern Breakout
A symmetrical triangle is a chart pattern formed by two converging trend lines connecting a series of sequential peaks and troughs. These two lines result in the formation of a triangle that appears to be symmetrical.
A symmetrical triangle pattern is usually formed when there is indecision in the price movements and there is uncertainty among the buyers and sellers. This chart pattern represents a period of consolidation before the price breaks out or breaks down. In case a breakout occurs from the upper trend line, it is a strong bullish indication as it signifies the start of a new bullish trend.
Buy Level(s): The stock has currently broken out of a symmetrical triangle pattern. However, the ideal buy level for SRTS is if the stock closes above the immediate resistance level of $5.40. This is marked in the chart below as a green color dotted line.
Daily chart – SRTS
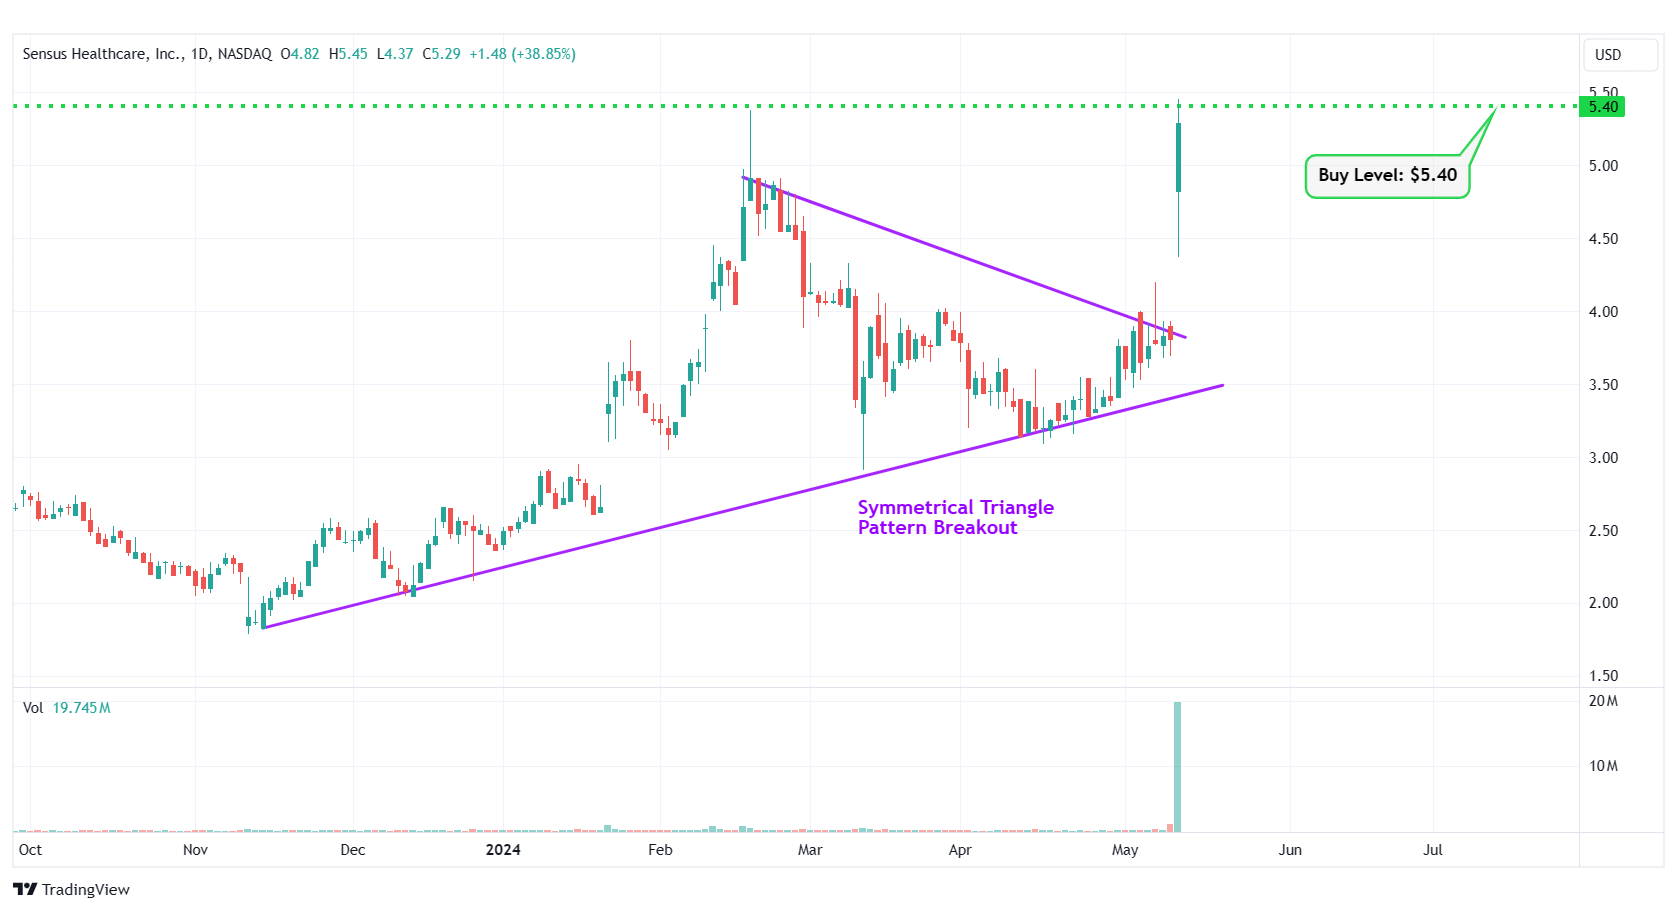
SRTS – Symmetrical Triangle Pattern Breakout
#9 Hilton Worldwide Holdings Inc. (NYSE: HLT)
Sector: Consumer Cyclical • Lodging
Reason: Breakout From a Flag Pattern
A flag pattern is a short-term continuation pattern that marks a small consolidation before the previous move resumes. The pattern is formed when the market consolidates in a narrow range after a sharp move. For a stock in an uptrend, a breakout from this pattern is typically a strong bullish indication.
Buy Level(s): Although the stock has currently broken out of the flag pattern, the ideal buy level for HLT is above the near-term resistance level of $211.00. This is marked in the chart below as a green color dotted line.
Daily chart – HLT
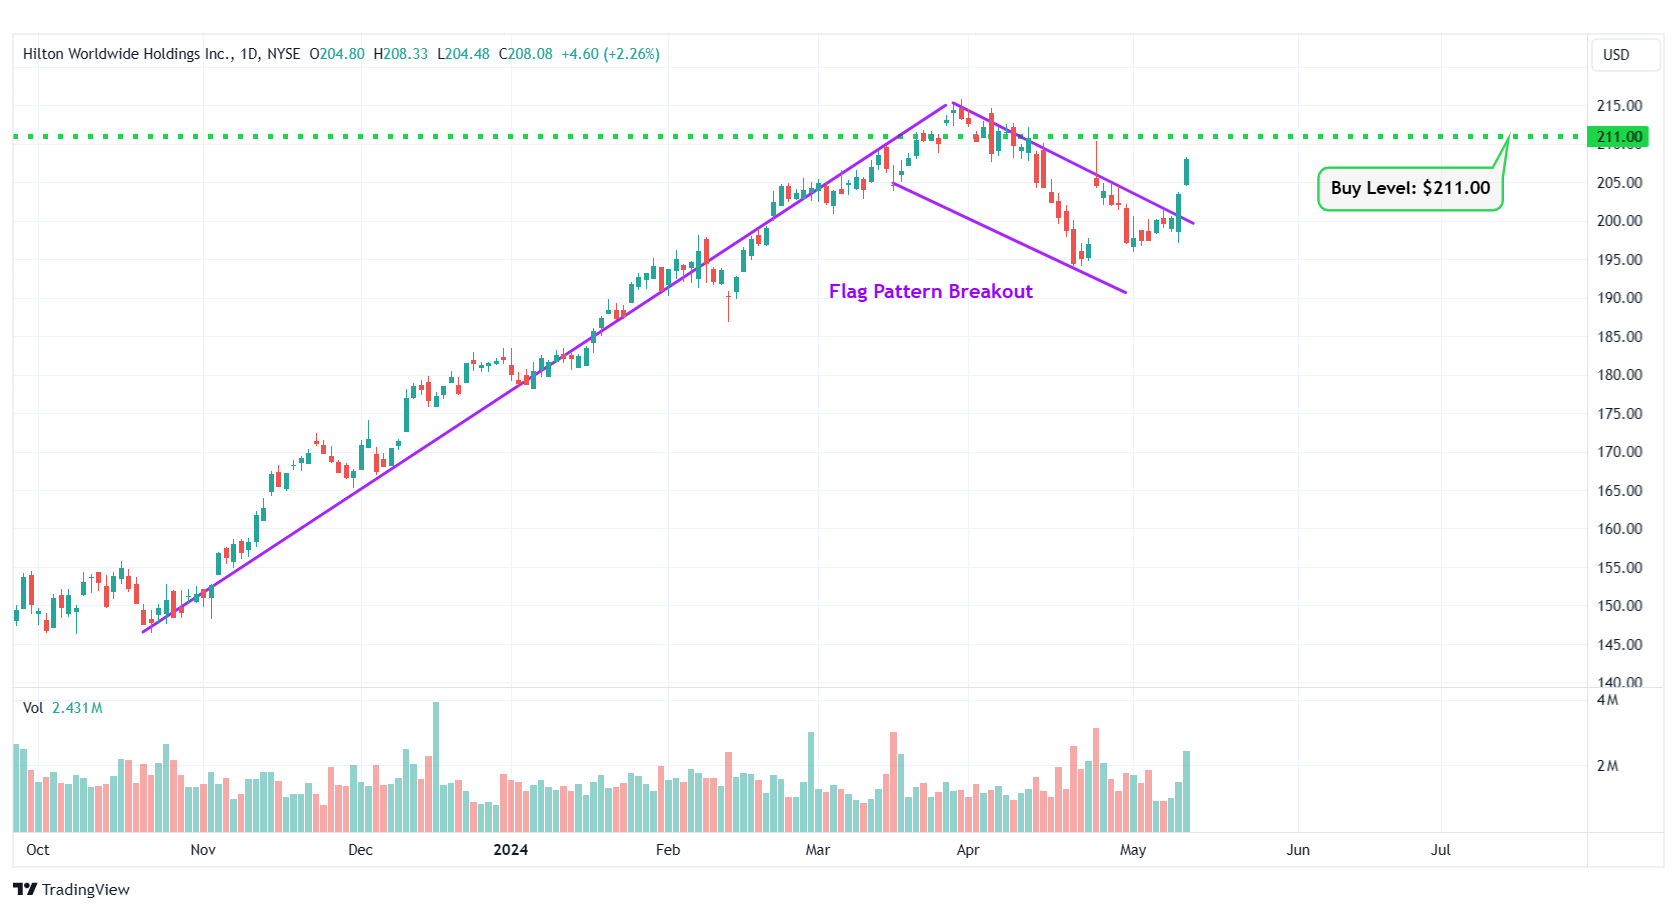
HLT – Flag Pattern Breakout
#10 Caredx Inc. (NASDAQ: CDNA)
Sector: Healthcare • Diagnostics & Research
Reason: Symmetrical Triangle Pattern Breakout
A symmetrical triangle is a chart pattern formed by two converging trend lines connecting a series of sequential peaks and troughs. These two lines result in the formation of a triangle that appears to be symmetrical.
A symmetrical triangle pattern is usually formed when there is indecision in the price movements and there is uncertainty among the buyers and sellers. This chart pattern represents a period of consolidation before the price breaks out or breaks down. In case a breakout occurs from the upper trend line, it is a strong bullish indication as it signifies the start of a new bullish trend.
Buy Level(s): The stock has currently broken out of a symmetrical triangle pattern. However, the ideal buy level for CDNA is if the stock closes above the immediate resistance level of $15.60. This is marked in the chart below as a green color dotted line.
Daily chart – CDNA
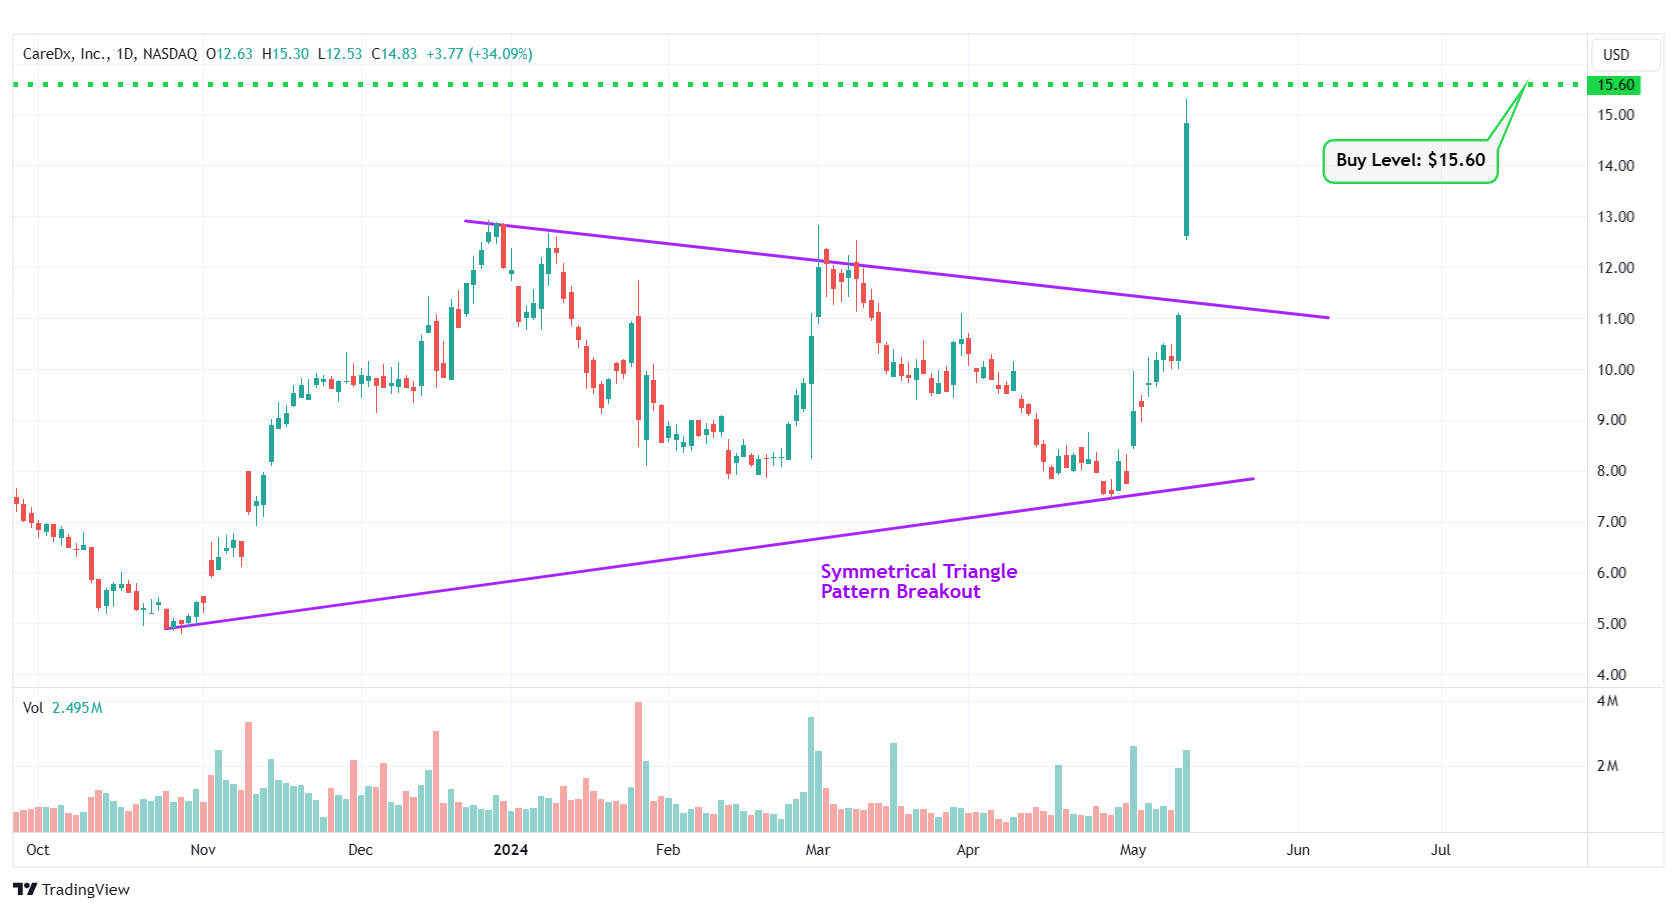
CDNA – Symmetrical Triangle Pattern Breakout
Happy Trading!
Trades of The Day Research Team
Everyone wants to know when to buy, sell, or hold a stock. FAST Graphs reveals this by clearly illustrating the value of the business relative to its stock price. Get 25% off using Daily Trade Alert's special referral link and coupon code AFFILIATE25
Source: Trades of the Day
