
Zai Lab Limited (NASDAQ: ZLAB) seems to be poised for a price surge as per its latest charts. The company develops and commercializes therapies to treat oncology, autoimmune disorders, infectious diseases, and neuroscience.
Its commercial products include Zejula; NUZYRA; Qinlock; and VYVGART. The company also develops Tumor Treating Fields; Repotrectinib; Tisotumab vedotin; Adagrasib; Bemarituzumab; Sulbactam/durlobactam; and KarXT. ZLAB also has license and collaboration agreements with Tesaro, Inc.; NovoCure ; Deciphera; Paratek Bermuda Ltd.; argenx; BMS; Mirati; Amgen; Innoviva ; and Karuna.
Bullish Indications
#1 Downtrend Channel Breakout: As you can see from the daily chart, the stock had been trading within a downtrend channel during the past few weeks. This is marked in the daily chart in purple color. Currently, the stock has broken out of the downtrend channel with a high volume. Once the stock breaks out from a downtrend channel, it has the potential to move further up.

ZLAB – Daily Chart
#2 Price above MA: The price is currently above the short-term moving average of 50-day SMA, indicating that the bulls are gaining control. This is a positive indication.
#3 Bullish ADX: The ADX indicator shows that the +DI line is currently above the –DI line and the ADX line has started to move up from below the –DI and +DI lines. This indicates possible bullishness.
#4 Bullish Aroon: The value of Aroon Up (orange line) is above 70 while Aroon Down (blue line) is below 30 in the daily chart. This indicates possible bullishness.
#5 Above Support Area: As you can see from the weekly chart, the stock has currently moved up from a long-term support level. This level is marked as a pink color dotted line. This looks like a good area for the stock to move higher.
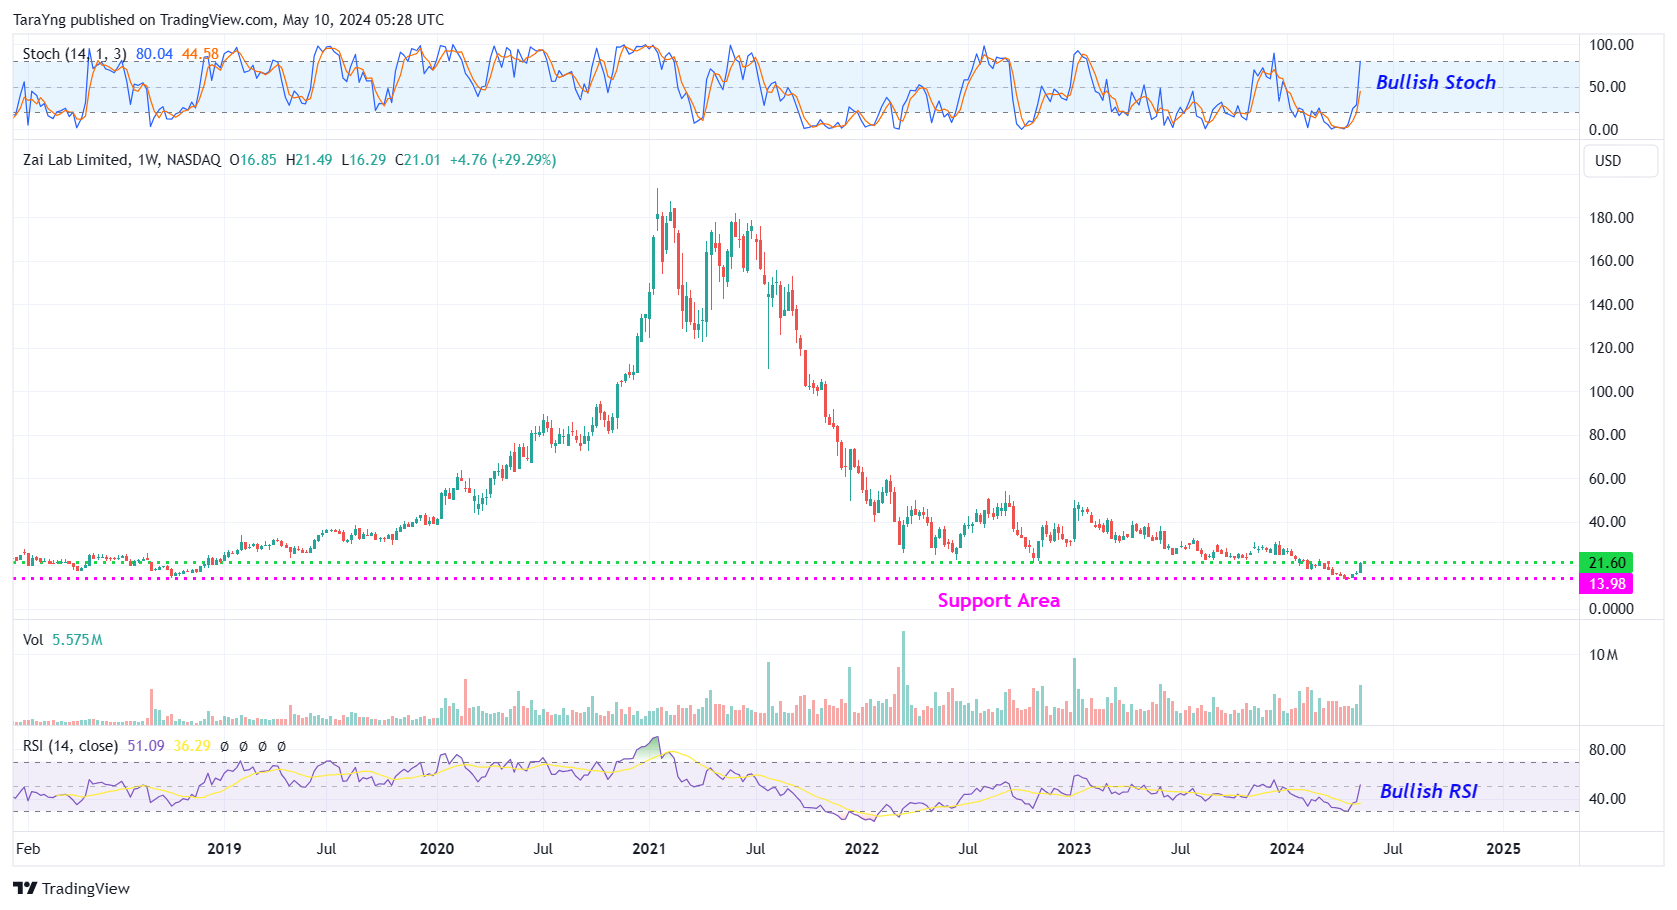
ZLAB – Weekly Chart
#6 %K above %D: The %K (blue) line of stochastic has currently crossed above the %D (Orange) line in the weekly chart and is also moving higher from oversold levels. This is a possible bullish indication.
#7 Bullish RSI: In the weekly chart, the RSI is currently above 50 and moving higher. This is a possible bullish sign.
Recommended Trade (based on the charts)
Buy Levels: If you want to get in on this trade, you can purchase shares of ZLAB above the price of around $21.60.
TP: Our target prices are $27.00 and $31.00 in the next 3-6 months.
SL: To limit risk, place stop-loss at $18.50. Note that the stop-loss is on a closing basis.
Our target potential upside is 25% to 44% in the next 3 to 6 months.
For a risk of $3.10, our target rewards are $5.40 and $9.40. This is a nearly 1:2 and 1:3 risk-reward trade.
In other words, this trade offers nearly 2x to 3x more potential upside than downside.
Risks to Consider
The stock may reverse its overall trend if it breaks down from the trend channel with a high volume. The sell-off of the stock could also be triggered in case of any negative news, overall weakness in the market, or any regulatory changes in the sector.
Happy Trading!
Tara
Everyone wants to know when to buy, sell, or hold a stock. FAST Graphs reveals this by clearly illustrating the value of the business relative to its stock price. Get 25% off using Daily Trade Alert's special referral link and coupon code AFFILIATE25
Source: Trades of the Day
