
GeneDx Holdings Corp. (NASDAQ: WGS) seems to be poised for a price surge as per its latest charts. The company provides genomics-related diagnostic and information services. The company offers Centrellis, an AI-driven health intelligence platform. WGS provides genetic diagnostic tests, screening solutions, and information with a focus on pediatrics, rare diseases for children and adults, and hereditary cancer screening.
Bullish Indications
#1 Ascending Triangle Pattern Breakout: The daily chart shows that the stock has currently broken out of an Ascending Triangle pattern. An Ascending Triangle pattern is a bullish pattern. This is marked on the daily chart in purple color lines. A breakout from this pattern typically indicates bullishness. The base of the triangle generally acts as a good support level after the breakout.
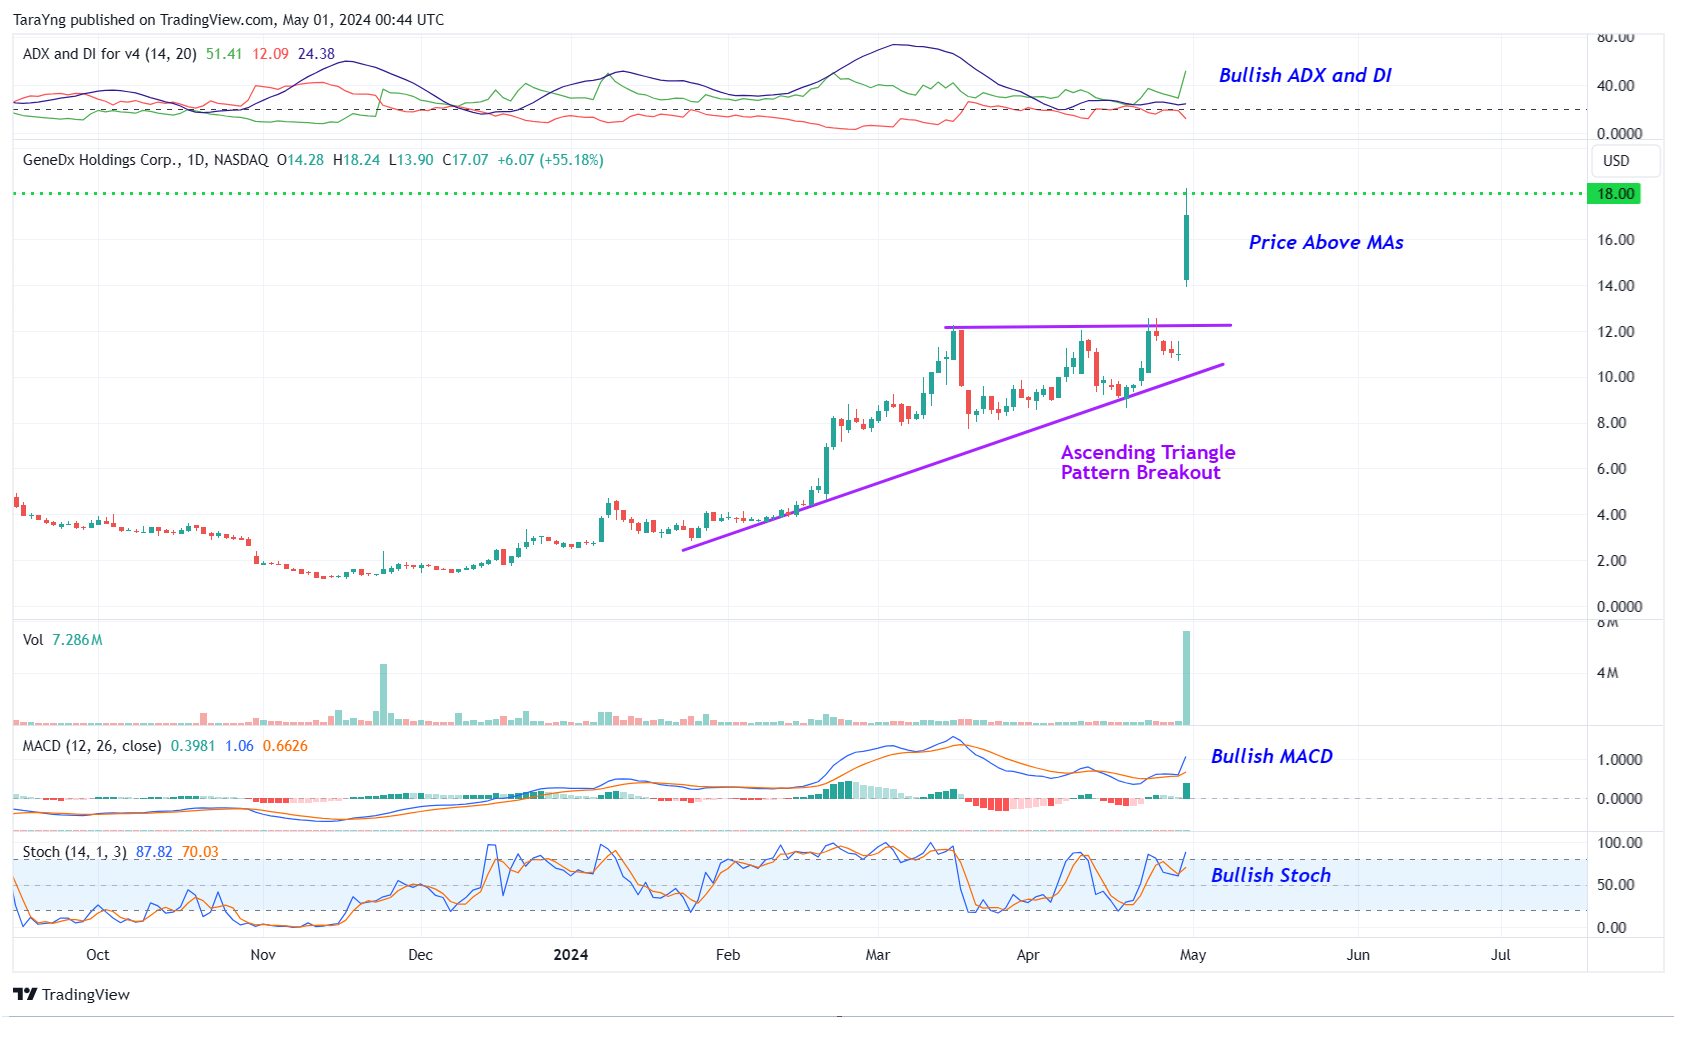
WGS – Daily Chart
#2 Price above MAs: The price is currently above the short-term moving average of 50-day SMA as well as the longer-term moving average of 200-day SMA, indicating that the bulls are still in control. This is a positive indication.
#3 MACD Above Signal Line: In the daily chart, the MACD line (light blue color) is currently above the MACD signal line (orange color) which is typically considered bullish.
#4 Bullish ADX: The ADX indicator shows that the +DI line is currently above the –DI line and the ADX line has started to move up from below the –DI and +DI lines. This indicates possible bullishness.
#5 Bullish Stoch: The %K line is above the %D line of the stochastic in the daily chart, indicating possible bullishness.
#6 Above Support Area: As you can see from the weekly chart, the stock has currently moved up from a support level. This level is marked as a pink color dotted line. This looks like a good area for the stock to move higher. The stock is also trading above its 50-week SMA, indicating that the bulls are gaining control.
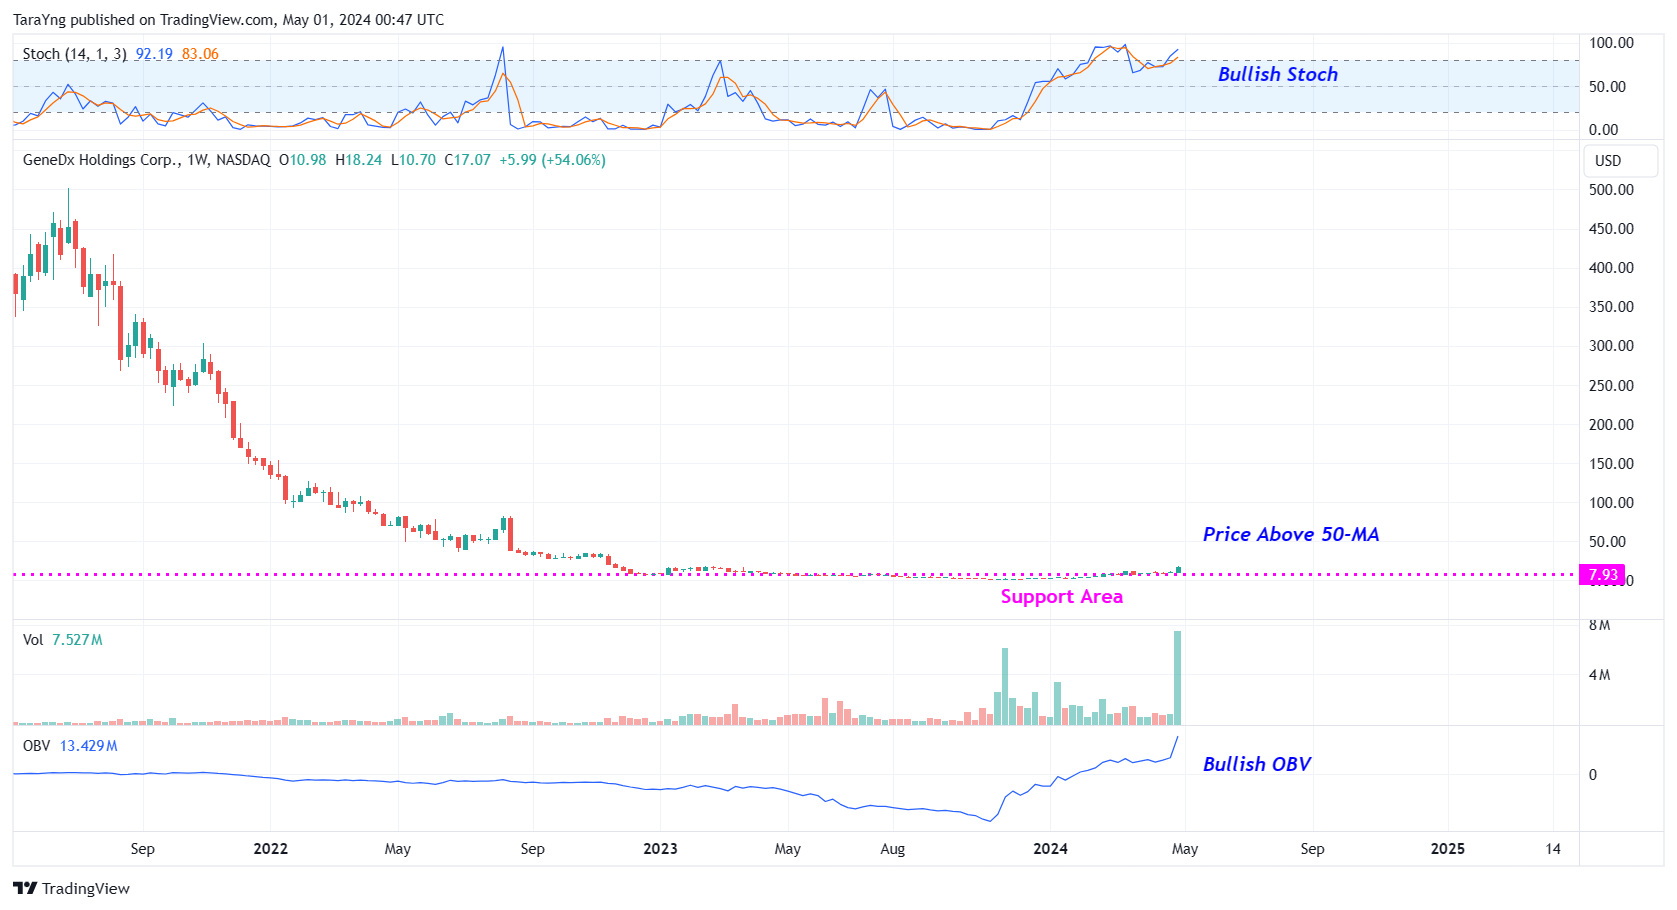
WGS – Weekly Chart
#7 %K above %D: The %K (blue) line of stochastic has currently crossed above the %D (Orange) line in the weekly chart as well. This is a possible bullish indication.
#8 Positive OBV: The weekly chart shows that the OBV indicator is currently rising. OBV rises when volume on up weeks outpaces volume on down weeks. A rising OBV typically reflects positive volume pressure that can lead to higher prices.
Recommended Trade (based on the charts)
Buy Levels: If you want to get in on this trade, you can purchase shares of WGS above the price of around $18.00.
TP: Our target prices are $20.80 and $23.00 in the next 3-6 months.
SL: To limit risk, place stop-loss at $16.40. Note that the stop-loss is on a closing basis.
Our target potential upside is 16% to 28% in the next 3 to 6 months.
For a risk of $1.60, our target rewards are $2.80 and $5.00. This is a nearly 1:2 and 1:3 risk-reward trade.
In other words, this trade offers nearly 2x to 3x more potential upside than downside.
Risks to Consider
The stock may reverse its overall trend if it breaks down from the ascending triangle pattern with a high volume. The sell-off of the stock could also be triggered in case of any negative news, overall weakness in the market, or any regulatory changes in the sector.
Happy Trading!
Tara
Top Stock Expert Who Called Nvidia at Less Than a Dollar Says... "$1,000 in Each of These Stocks Could Make You a Millionaire" By 2030.
Source: Trades of the Day
