
We recently started a series called “Penny Stock of the Day”. These ideas are geared towards traders with an extremely high risk appetite.
Our Penny Stock of the Day is chosen by screening for stocks under $5 and then applying technical analysis on the shortlisted set of penny stocks showing unusual volume. When making these trades, please make sure to pay vigilant attention to pricing moves and have a strict stop loss in place to avoid significant losses.
Penny Stock of the Day: Geron Corporation (NASDAQ: GERN)
Today’s penny stock pick is the late-stage clinical biopharmaceutical company, Geron Corporation (NASDAQ: GERN).
Geron Corporation focuses on the development and commercialization of therapeutics for myeloid hematologic malignancies. It develops imetelstat, a telomerase inhibitor that is in Phase 3 clinical trials, which inhibits the uncontrolled proliferation of malignant stem and progenitor cells in myeloid hematologic malignancies for the treatment of low or intermediate-1 risk myelodysplastic syndromes and intermediate-2 or high-risk myelofibrosis.
Website: https://www.geron.com/
Latest 10-k report: https://d18rn0p25nwr6d.cloudfront.net/CIK-0000886744/d105b45d-a5f6-45a5-906c-062dd4f2f8de.pdf
Analyst Consensus: As per TipRanks Analytics, based on 7 Wall Street analysts offering 12-month price targets for GERN in the last 3 months, the stock has an average price target of $5.79, which is nearly 40% upside from current levels.

Analysts | Source: TipRanks.com
Potential Catalysts / Reasons for the Hype:
- TD Cowen started coverage of Geron with a buy rating and a price target at $10.
- The company’s oncology drug candidate imetelstat is expected to receive FDA approval in June for the treatment of low-risk myelodysplastic syndrome, with global sales of $3.3B anticipated by 2035.
On analyzing the company’s stock charts, there seem to be multiple bullish indications…
Bullish Indications
#1 Breakout From Consolidation Area: The daily chart shows that the stock has broken out of a consolidation area and is moving higher. This is marked as a purple color rectangle in the chart. Whenever a stock breaks out of a consolidation area, it typically moves higher.
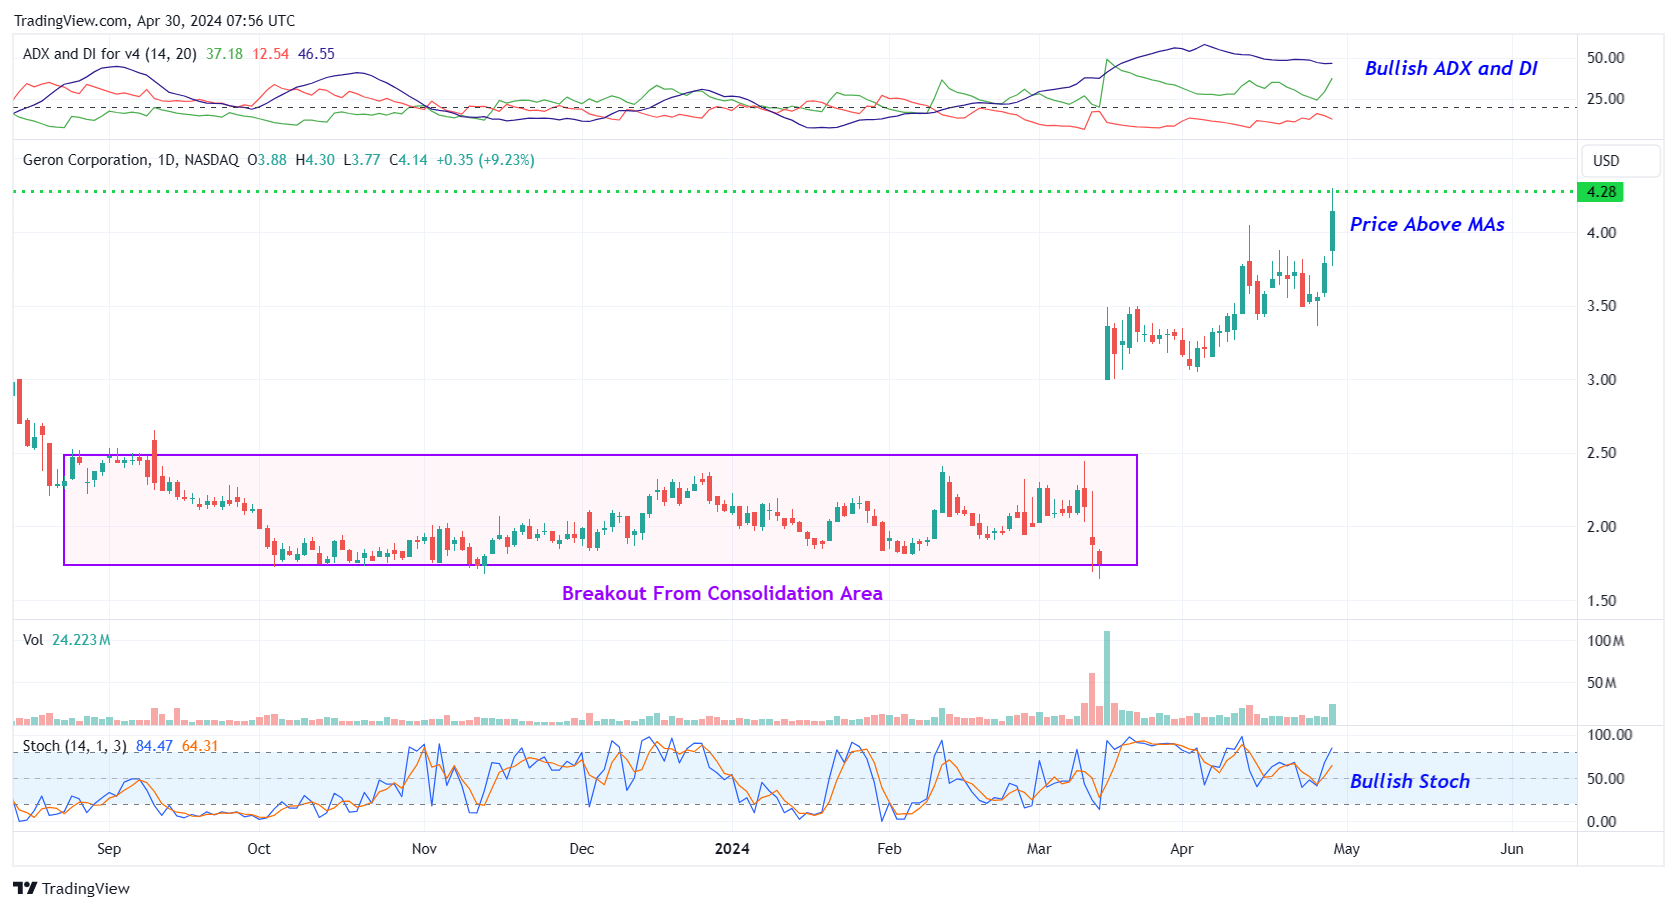
GERN – Daily Chart
#2 Bullish ADX and DI: The ADX indicator shows bullishness as the +DI line is above the -DI line, and the ADX line is currently moving higher from below the +DI and -DI lines.
#3 Price above MAs: The stock is currently above its 50-day as well as 200-day SMA, indicating that the bulls have currently gained control.
#4 Bullish Stoch: The %K line of the stochastic is above the %D line, and has also moved higher from oversold levels, indicating possible bullishness.
#5 Above Support Area: The weekly chart shows that the stock is currently trading above a support area, which is marked as a pink color dotted line. This looks like a good area for the stock to move higher. The stock is also trading above its 50-week as well as 200-week SMA, indicating that the bulls are gaining firm control.
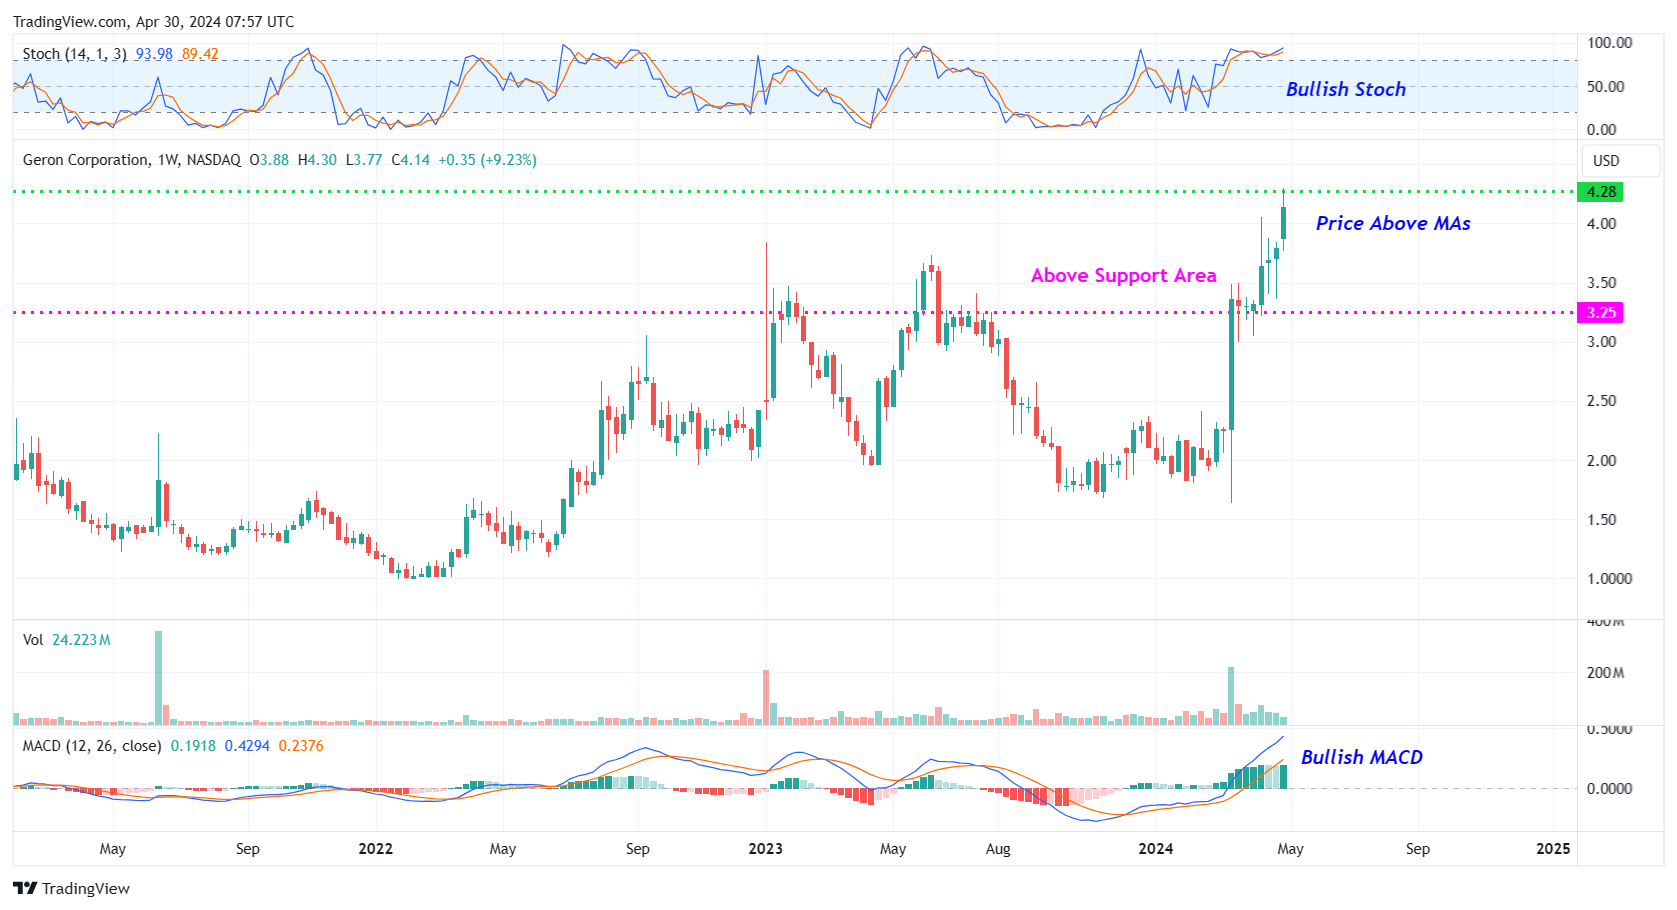
GERN – Weekly Chart
#6 Bullish Stoch: The %K line is above the %D line of the stochastic in the weekly chart as well, indicating possible bullishness.
#7 MACD above Signal Line: In the weekly chart, the MACD (light blue color) is currently above the MACD signal line (orange color). This indicates a possible bullish setup.
Recommended Trade (based on the charts)
Buy Levels: If you want to get in on this trade, the ideal buy level for GERN is above the price of $4.30.
Target Prices: Our first target is $5.50. If it closes above that level, the second target price is $6.50.
Stop Loss: To limit risk, place a stop loss at $3.60. Note that the stop loss is on a closing basis.
Our target potential upside is 28% to 51%.
For a risk of $0.70, our first target reward is $1.20, and the second target reward is $2.20. This is a nearly 1:2 and 1:3 risk-reward trade.
In other words, this trade offers 2x to 3x more potential upside than downside.
Potential Risks / Red Flags:
- The company has a history of net losses. As of December 31, 2023, GERN had an accumulated deficit of approximately $1.6 billion.

GERN – Consolidated Statements of Operations
- The company has ongoing legal proceedings. In 2020, three securities class action lawsuits were filed against the company and certain of its officers. In 2020 and 2021, seven shareholder derivative actions were filed in a number of courts, naming as defendants certain of the company’s then current officers and certain of the former members of the board.
- Hedge Funds Decreased Holdings by 3M Shares Last Quarter.
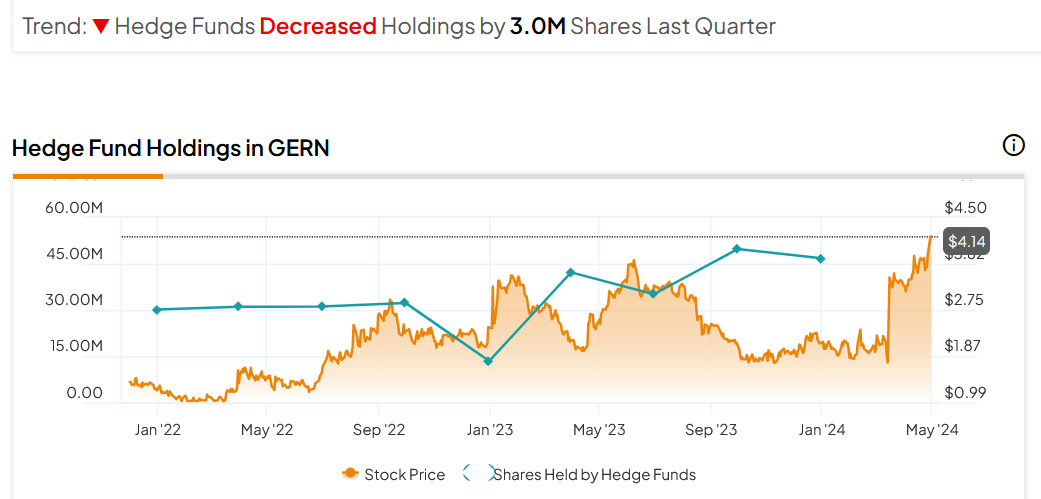
Hedge Funds | Source: TipRanks.com
- Despite being a loss-making company, the executives are being paid significant compensation.

GERN – Executive Compensation
- The company’s future success depends solely on imetelstat, its only product candidate. If GERN is unable to obtain regulatory approval for and successfully commercialize imetelstat, or experience significant delays in doing so, the company’s business will be severely harmed
As you can see, today’s featured penny stock offers big upside potential… but it also comes with a number of risks and red flags. As always, when dealing with penny stocks, we advise caution before entering into such high-risk ventures. Remember to think before you trade… understand the risks… and if you decide to trade, stick to your stop-losses!
Happy Trading!
Trades of the Day Research Team
READ BEFORE TRADING PENNY STOCKS: The allure of penny stocks lies in their potential to deliver massive gains in a short period of time. However, in exchange for that opportunity, most penny stocks carry tremendous risk. They can be extremely volatile and are susceptible to “pump and dump” schemes and fraud.
Unlike regular stocks, the financial condition of most penny stock companies can be extremely difficult to analyze, as the majority of such stocks are traded on over-the-counter (OTC) exchanges, which are typically less transparent and less regulated than the major exchanges. In fact, in the penny stock space, it’s often easier to spot warning signs and red flags than it is to identify a sound investment. Nevertheless, we do our best to identify short-term trade opportunities in this exciting space because we know some of our readers are looking for high-risk, high-reward ideas. We just urge you to make sure you fully understand the risks before making any of these trades.
Everyone wants to know when to buy, sell, or hold a stock. FAST Graphs reveals this by clearly illustrating the value of the business relative to its stock price. Get 25% off using Daily Trade Alert's special referral link and coupon code AFFILIATE25
Source: Trades of the Day
