
Wells Fargo & Company (NYSE: WFC) seems to be poised for a price surge as per its latest charts. The company provides diversified banking, investment, mortgage, and consumer and commercial finance products and services in the United States and internationally.
The company operates through four segments: Consumer Banking and Lending; Commercial Banking; Corporate and Investment Banking; and Wealth and Investment Management.
Bullish Indications
#1 Breakout from Flag Pattern: The daily chart shows that the stock was in an uptrend after which it started consolidating and was in a narrow range. This is a classic flag pattern and is marked in the chart in purple color. Currently, the stock has broken out of the flag. A Flag is a continuation pattern. Whenever a stock breaks out of the flag pattern, it typically continues its previous trend (uptrend in this case).
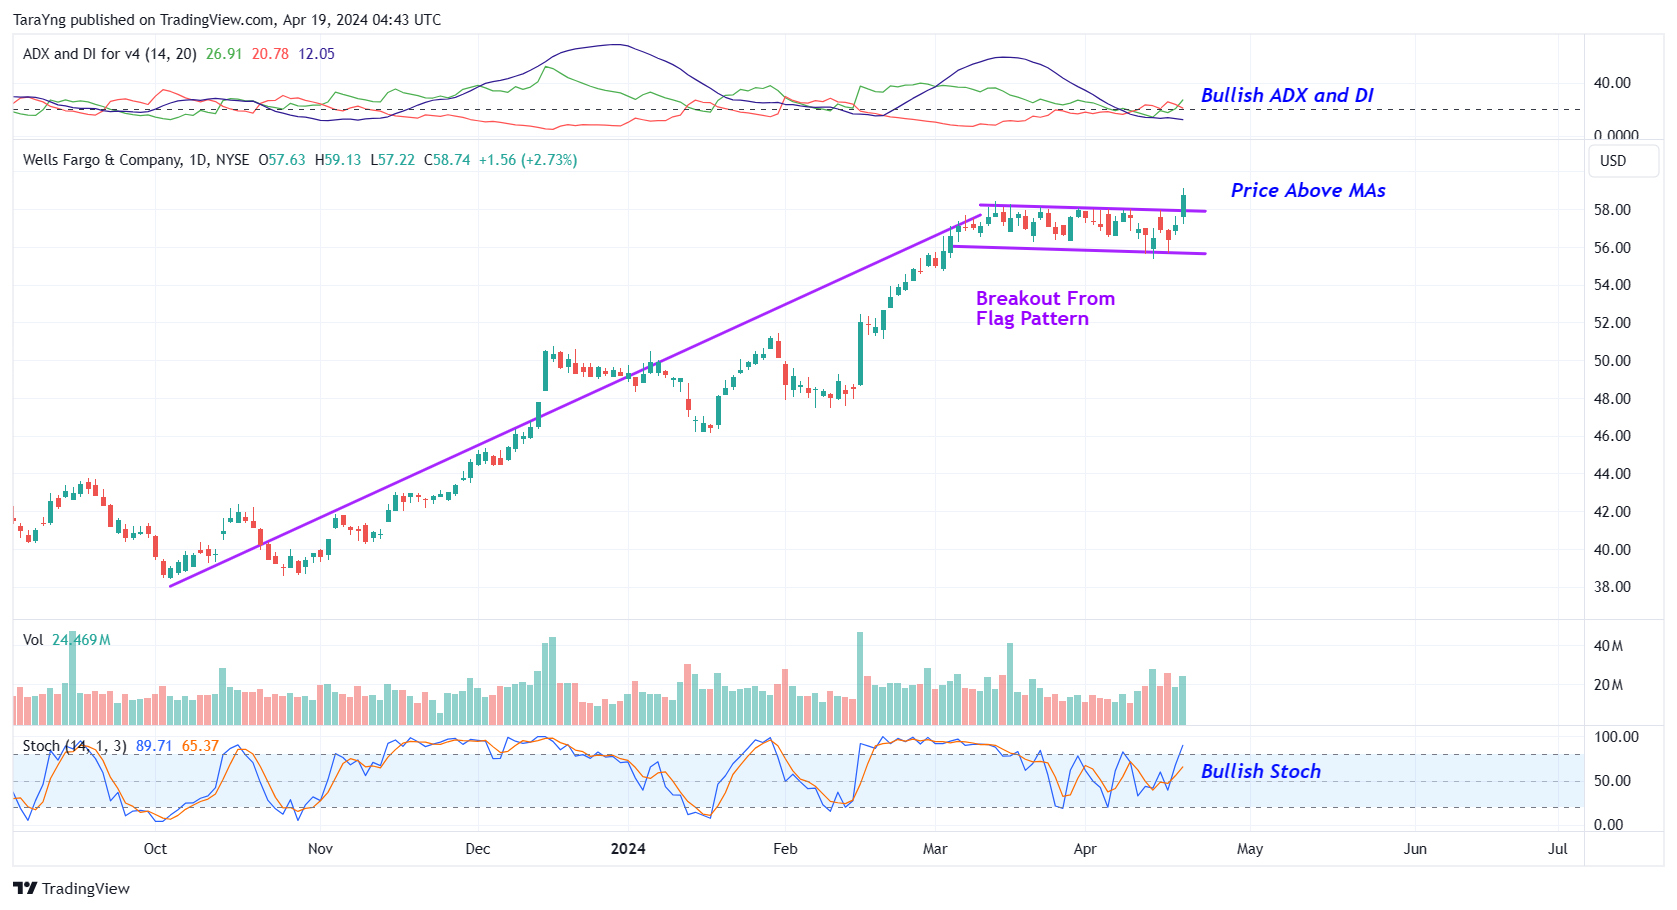
WFC – Daily Chart
#2 Price above MAs: The price is currently above the short-term moving average of 50-day SMA as well as the longer-term moving average of 200-day SMA, indicating that the bulls are still in control. This is a positive indication.
#3 Bullish Stoch: The %K line is above the %D line of the stochastic in the daily chart, indicating possible bullishness.
#4 Bullish ADX: The ADX indicator shows that the +DI line is currently above the –DI line and the ADX line has started to move up from below the –DI and +DI lines. This indicates possible bullishness.
#5 Downtrend Channel Breakout: As you can see from the weekly chart, the stock had been trading within a downtrend channel during the past few weeks. This is marked in the chart in pink color. Currently, the stock has broken out of the downtrend channel. Once the stock breaks out from a downtrend channel, it has the potential to move further up. The stock is also trading above its 50-week and 200-week SMA. All these are possible bullish indications.
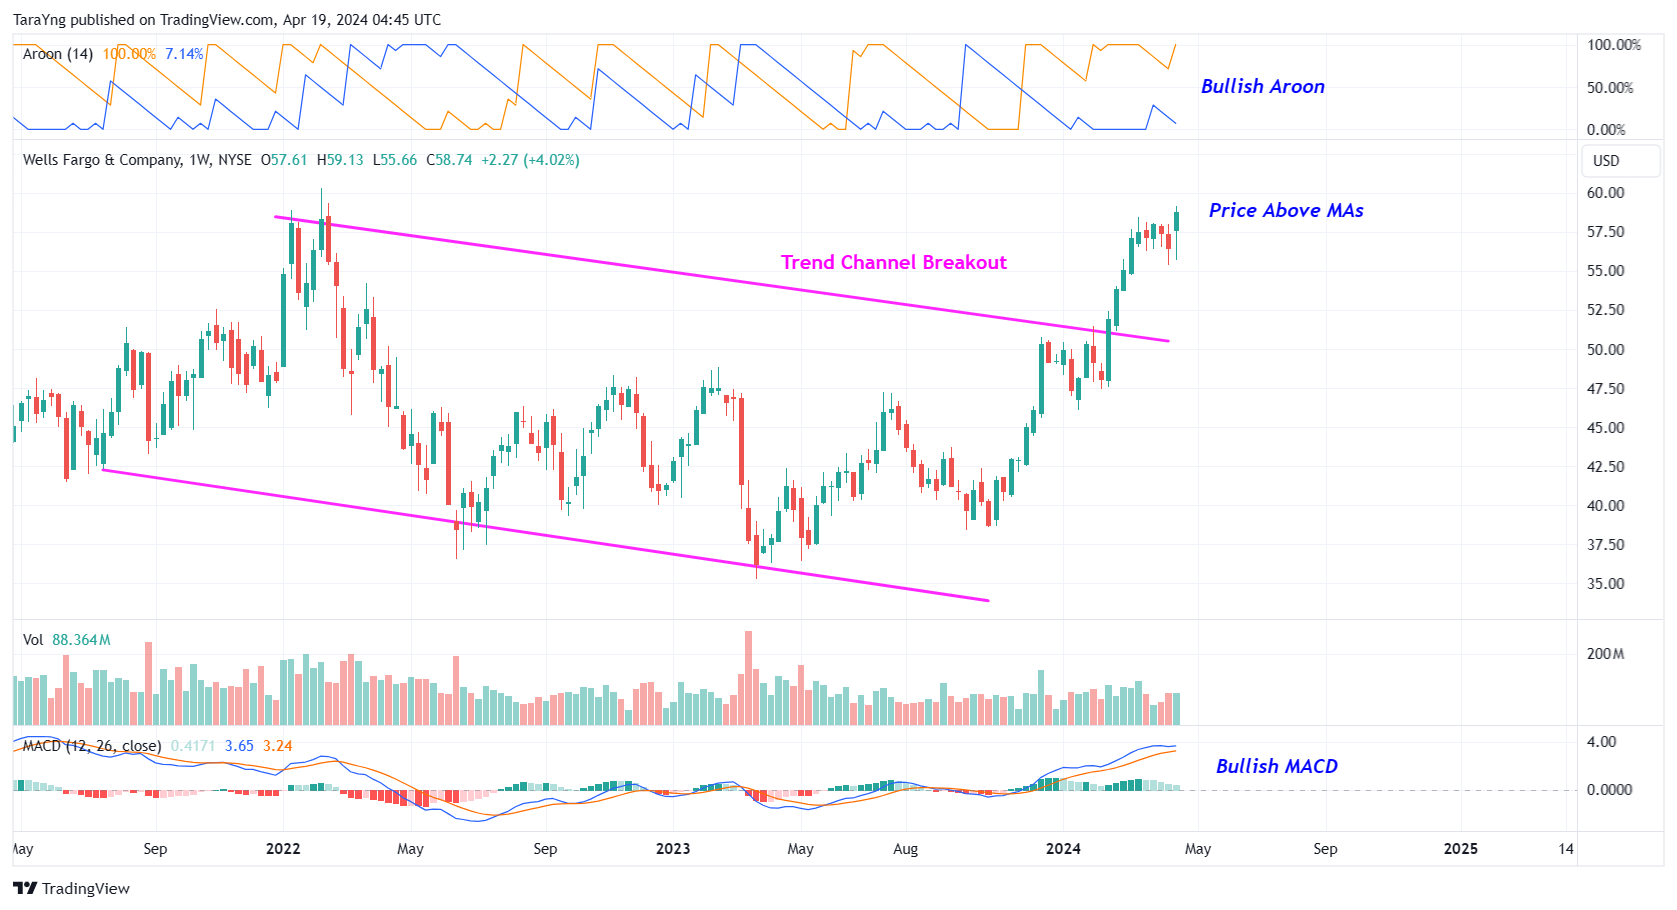
WFC – Weekly Chart
#6 Bullish Aroon: The value of Aroon Up (orange line) is above 70 while Aroon Down (blue line) is below 30 in the weekly chart. This indicates possible bullishness.
#6 Bullish MACD: The MACD line is above the MACD signal line in the weekly chart, indicating bullishness.
Recommended Trade (based on the charts)
Buy Levels: If you want to get in on this trade, you can purchase shares of WFC above the price of around $59.
TP: Our target prices are $66 and $72 in the next 3-6 months.
SL: To limit risk, place stop-loss at $55. Note that the stop-loss is on a closing basis.
Our target potential upside is 12% to 22% in the next 3 to 6 months.
For a risk of $4.00, our target rewards are $7.00 and $13.00. This is a nearly 1:2 and 1:3 risk-reward trade.
In other words, this trade offers nearly 2x to 3x more potential upside than downside.
Risks to Consider
The stock may reverse its overall trend if it breaks down from the trend channel with a high volume. The sell-off of the stock could also be triggered in case of any negative news, overall weakness in the market, or any regulatory changes in the sector.
Happy Trading!
Tara
Legendary fund manager Louis Navellier – a man Forbes calls "the king of quants" – is going "ALL-IN" on this game-changing AI technology. He says, "This is the culmination of everything you've been reading about AI for the last 60 years."Get the details...
Source: Trades of the Day
